How to FUDGE your FIBSWhere you start and end the fib trace (0-1) is critical
There will be ''obvious'' points that mostly work fine.
But often the NON-obvious points fit BETTER.
Fibonacci

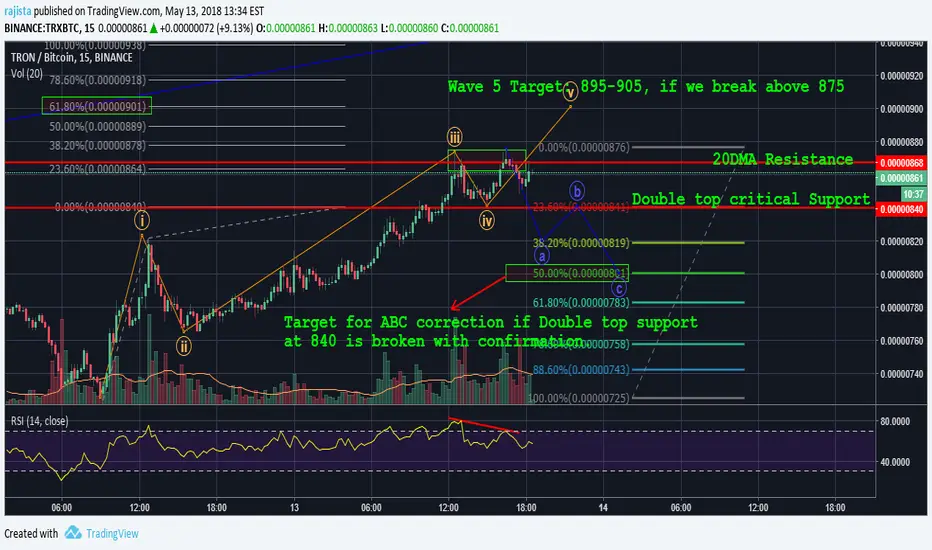
#tron $trx #tron 15min chart analysis: (Short-term analysis)#tron $trx #tron 15min chart analysis: (Short-term analysis)
Bullish bias: If we break above 875- Wave 5 Target: 895-905,
Bearish bias: If Double top support at 840 is broken with confirmation. Target for ABC correction: 800-810sats. #Crypto $crypto #cryptocurrency
www.tradingview.com
LTC: Long Term Bull Theory Ticker: COINBASE:LTCUSD
Timeframe: 1D/2-3 years
Quick LTC long term theory more for me to reference back to. Will also dabble with a long term bear theory even though it scares the living piss out of me.
Short Term: Slightly Bearish
Mid Term: Neutral
Long Term: Bullish Af
Current Market Sentiment: Tired of the FUD, Skiddish Bear

ont/btc analysis (2x signal)I think ont will goes down to the area 0.00070-0.00075 and after that the next rally begins. my target prices are 0.00179 btc and 0.00209 btc. can ont do that? we will see the next week.
P:86
Entry area: 0.00070-0.00075 btc
TP1 : 0.00179 btc
TP2 : 0.00201 btc
Can ont do that?

Just a correction in BTC/USD befor flying to the moonAs the weekly chart shows we have correction to 7800$ where it matches to fibo level of 61.8% and a pullback from previous resistance line.
It is better to have the correction this week not later, due to small distance from resistance line.
P: 9050$
TP: 7800$

5 STEPS TO CHANNEL THE TARGET WAVE 5 USING ELLIOTT WAVESSTEP 1 - Once the 1 wave is completed use Fib Retracement to find out the possible wave 2 level. Usually wave 2 is 0.5 - 0.8 of wave 1. In a uptrend Fib level is close to 0.8 but its the opposite on downtrend
STEP 2- Once the wave 2 is completed use Fib Extension to find out the possible wave 3 level. Usually wave 3 is 1.618 of wave 1 or 2.618 of wave 2.
STEP 3 - Once the wave 3 is completed then you can draw a line to join 1 and 3 and then draw a parallel line on wave 2 to project the wave 4. Usually wave 4 is 0.5 - 0.618 of wave 3
STEP 4 - Once wave 4 is completed then you can draw a line to join wave 2 and 4 and then remove the previously drawn line joining wave 1 and 3
STEP 5 - Then draw a parallel lines from wave 1 and 3 and the 50% trend line of the above parallel lines to project wave 5. Usually wave 5 is 1 or 0.618 of wave 1

Testing New StrategyUsing pivots, Fibonacci and trend lines. Blue boxes are zones. If the price breaks any of the zones, I predict the price to go on that direction once there is confirmation on the hourly chart e.g. engulfing candle. Currently, box has broken for a downtrend. This is just a test and in the future will add in targets and stop losses (but the blue box zones can be an indication of those).

Nasdaq_Indexes_Look into todays action_Shorts considered only. Occasionally I will be slapping together a commentary about the days action on my favorite index and making a point to pickout the best entry of the day. This does not mean I take these entries. I simply point them out.
These posts will be short simple and insightful.
Notice the daily is bearish. We know better than to hold onto long positions.
Over the weekend SPX and DOWJ setup very nice looking sell signals. Market makers know all of us retail traders sat around and thought about how bad we wanted to get short all weekend. So first thing this morning they gave us our fills. NQ pushed lower and stopped out tight long trades and entered silly short orders. Then the market made a substantial move higher only to stop out the retail short traders. Only to stall around lunchtime.
Markets ticked around until 2pm when we finally started showing bearish signals and my plan allowed my to trade with the direction of the daily.
Price broke the lunchtime level and then formed a perfect verification process to confirm we were about to move lower. The market took back all the days gains between 2 and 3:50. Notice the 5 minute chart in the comments below.Cant post the 5 min which truly shows the details of today's move.
What a day. Stay tuned!
If you found this analysis useful or thoughtful Likes/Comments/Follows are much appreciated! Disclaimer: Your data may be different. Material is educational only. Trade at your own risk!

XAUUSD - ABCD PatternHow to trade the ABCD pattern
This is an example of a bullish ABCD pattern.
Ideally, Point C should be Fibonacci retracement between 61.8% to 78.6% of the A-B leg.
Point D should be a Fibonacci extension between 127% to 161.8% of the B-C leg.
Stop loss should be below D or previous low.
Take profit can be at the 38.2% and 61.8% Fibonacci retracement of the C-D leg.

Cypher pattern - Good Example #2DISCLAIMER - Your money is not in danger but guaranteed to disappear if you follow my trades. These ideas and trades are mostly for my personal use as a journal, but I try to provide as much value as possible to the community
Cypher patterns supposedly have 80% completion ratio. This one worked flawlessly
X - recent bottom
A - recent top
B - must touch 0.382 fib retracement and close BEFORE 0.618 of X-A. We have 0.455 - GOOD
C - must touch 1.272 fib extension and close BEFORE 1.414 of X-A. We have 1.244 - NOT QUITE. If you are really pedantic with it, you may choose to ignore this one. In my book so far, it worked !
D - nosedive required after C. Buy Entry - 0.786 retracement of X-C
Look at that bounce - pattern could not have worked better (as long as you don't need the 1.272 point to be hit and can settle for a 1.244) The extra volume and RSI cross-over are bonuses. No point to measure - both 382 and 618 targets hit.

Cypher Pattern - Good example #1DISCLAIMER - Your money is not in danger but guaranteed to disappear if you follow my trades. These ideas and trades are mostly for my personal use as a journal, but I try to provide as much value as possible to the community
Cypher patterns supposedly have 80% completion ratio. This one worked flawlessly
X - recent bottom
A - recent top
B - must touch 0.382 fib retracement and close BEFORE 0.618 of X-A. We have 0.463 - GOOD
C - must touch 1.272 fib extension and close BEFORE 1.414 of X-A. We have 1.265 - SORT OF. If you are really pedantic with it, you may choose to ignore this one. In my book, it counts.
D - nosedive required after C. Buy Entry - 0.786 retracement of X-C
The price bounced exactly on the 0.768 retracement level and easily hit the first target, which is 0.382 fib extension. It BARELY missed the 0.618 level depending on how pedantic you are with the charting tools. In fact it hit it but much later.

Cypher Pattern - Bad Example #1DISCLAIMER - Your money is not in danger but guaranteed to disappear if you follow my trades. These ideas and trades are mostly for my personal use as a journal, but I try to provide as much value as possible to the community
Cypher patterns supposedly have 80% completion ratio. This one failed
X - recent bottom
A - recent top
B - must touch 0.382 fib retracement and close BEFORE 0.618 of X-A. We have 0.463 - GOOD
C - must touch 1.272 fib extension and close BEFORE 1.414 of X-A. We have 1.367 - GOOD
D - nosedive required after C. Buy Entry - 0.786 retracement of X-C
We can see the price bounced in that area (the wick being much lower and touching X level. The pattern was close to being correct however the bears were too strong. If you were lucky - you could get a quick scalp.
Do Cyphers only work in sideways markets? Not in Bear/Bull markets?
I'll be following this up with some good Cyphers

Quick notes about Inverted Head and ShouldersHello dear friends,
this is more of a study than a chart.
Here is what i did:
* I sampled 16 IHS that showed over the past year and were visible on the 4hr chart.
* I took in consideration sloppy patterns but ignored the ones that didn't complete or patterns that were too small or too big to discern on the 4hr.
* targets are calculated roughly based on the closest fib as result, some targets have fallen slightly above or below that number.
* By target i mean the peak price that was reached after pattern completion and within the timeframe equal to the time length of the pattern itself, and before reached a lower point than the low tip of the right shoulder
* The outcome post pattern defines what happens after that pattern has reached its target within the calculated timeframe. Lower means the price dropped below the right shoulder lowest point, higher means the price continued climbing higher before any drop
* The way i calculate IHS targets might be a bit unusual, but it works well for me. I calculate the length of the head from its lowest point to the meeting point with the right shoulder. Target calculations are a fib percent of that height.
* Mind you, this is a quick study, nothing bulletproof or scientifically sound.
And here are my key findings:
1. Out of 16, 3 failed, 7 reached 100% or above
2. the average success score is a retrace of 67% of the head size within the time length equal to the time length it took the pattern to form
3. 50% of the time, the price dropped lower than the pattern right shoulder or more after reach the pattern target
Details:
/
a. 50% / lower
b. 61.8% / higher
c. 100% / higher
d. 23.6% / lower
e. 100% / higher
f. 100% / higher
g. 0% / lower
e. 0% / lower
f. 23.6% / higher
g. 100% / lower
h. 78.6% / higher
i. 161% / lower
j. 23.6% / higher
k. 161% / lower
l. 0%/ lower
m. 100% / higher
Again please take these findings with a grain of salt, this is by no mean super accurate and can be prone to error. But as a broad overview, hope you'll find this insightful.

MUE-BTC on 1D - Review how price moves. Mixed signalsReview to see how trade plays out:
Bullish:
- Kumo Edge to Edge
- Previous TK crossover however not as strong as it was below the cloud.
- Kumo cloud is flat...price tends to be attracted to this.
Bearish
- Future kumo cloud is bullish
- Potential double top formation
- Similar pattern back in July when it did drop down before further gains
- Low volume
Buy: 0.00002443
Target: 0.00003160 (Sell 75% and leave rest for Long)
SL: 0.00001986 (below the previous support at psychological 2000 level)
RRR: 2.0

Invest in yourself before invest your moneyIs buy & hold a strategy for penny stocks?
Some says yes, some says no. The answer really depends how skillful the investors are.
In this penny stock example, buy and hold is definitely a poor choice.
A 30% gain in 171 days VS a 255% gain in 80 days.
I pointed out many alert positions. Please move your cursor to the blue spots.
These alerts tell you to think about STOP LOSS to protect your PROFIT.
You may have to develop some technical analysis skills like below:
Left chart
Understand candlesticks pattern
Spot moving averages crossovers
Spot MACD crossover
Apply Fibonacci Retracement
Draw one or more trend line(s)
Right chart
Understand candlesticks pattern
Check S/R levels
Spot Tenkan-sen & Kijun-sen crossovers
Check Chikou-span position
Check price is under cloud
The next step is to develop your mindset:
According to a Stanford Research Institute report, 87.5% of our success in life comes from our attitude, with only 12.5% coming from skill.
If there were only 50 technical analysis methods in the world, then you learnt only 10 of them. You got only 2.5%, a tiny portion of your success. You attitude then will be a massive action that move you forward.
Do you know the power of beliefs? There are many people giving up trading because they cannot handle their negative emotions. I knew you're thinking fear & greed, but you may probably forget some emotions holding you back such as distress, disappointment and discouragement. The more bad news your heard from TV, magazines, and forums, your mind is filled with a lot of negative comments. Why not you go to hang around with positive thinking traders, fully technical analysts in some trading seminars face to face. They will encourage you and sometimes empower you, much better than sharing with your own friends. You must find the way to improve yourself. You must dump the past trading experience in order to absorb professional advice.
Do you have the best place to do your chart analysis? I was telling some of my students “Can you not doing your analysis on a dining table; not analyzing & watching TV at the same time; not Facebook messenging while you are doing day-trades?” You need a FOCUS on what you are trading. Some says trading bitcoins can generate a lot of money, then you jump from your boat into their boat with no understandings their structure and foundation. If you lose, then it is your responsible, not others.
At last I encourage all of the beginners that we are all riding the waves in the many markets (Forex, shares, crypto, indices, futures, options, etc). Therefore, you are not alone. Do not underestimate the negative emotions sometimes engulf someone's lives. As you are not alone, you are in this tradingview family !!
When you make money, share it. Share how you make it win (not by gambling)
When you lose money, share it, too. Share how to make it lose (no excuses).
Be a responsible generous trader you are, find your peak performance, equip your skills to unleash your momentum to success.
The PAST does not equal the FUTURE unless you live there.
Thank you for reading.
All the best

Learning how USD corrolates with non-USD currencies. EURCADMy CURRENT definition of RISK.
RISK ON
USD down, moving XXX/USD currencies up and USD/XXX currencies down.
or
RISK OFF
USD up, moving XXX/USD currencies down and USD/XXX currencies up.
Mid term (3 wks-6mo) I lean bias towards 2018 trading in RISK ON mode. Which means
EURUSD is a buy mid-term.
USDCAD is a sell mid-term.
In the last several months we have been in RISK ON mode with EURUSD in a obvious uptrend. I've noticed EURCAD trends UP when we are risk on.
So mid-term we cannot expect to short EURCAD because we know the underlying currencies are in up trends. Short term I do believe there is room for a pullback to the 1.53 or 1.52 levels coupled with a pullback in EURUSD. But ultimately I will be looking to trade EURCAD higher in months to come.
Full Disclaimer: This is a test I'm running to better understand how correlations among two USD pegged pairs perform when pegged against each other. I will be referencing both EURUSD and USDCAD often. EURUSD is perfectly 1-1 inversely correlated with USD. This is because the EURUSD is the strongest correlated currency to the USD in the world and ultimately controls EURCAD by nature. Trade between the United States and the European Union is over half of USD transactions so EURO's are the most strongly correlated out of all other currencies. That being said when I'm looking at the price of EURUSD, I'm actually reflecting on the price of USD if that makes any sense. EURUSD is up when USD is down BECAUSE USD is down! I track USD with the US Dollar index. Ticker DXY.
If you found this useful or thoughtful Likes/Comments/Follows are much appreciated!
Disclaimer: Oanda data shown. Material is educational only. Trade at your own risk!
and ultimately controls EURCAD by nature

USD/JPY 1H ANALYSIS (Bearish trend) price has been in bearish run making lower highs, and lower lows in form of pullbacks. seeing price now making a retracement can give us an opportunity to short this market once identifying a trend continuation off our fibonnacci levels and take profit at the lows where buying demand is identified, leaving stop loss right above previous structure high and manage to be apart of the trend. if by any means the price forms anything out side your plans get out. -self

For next time: how to spot the reversal, making money as a bear.Fib extensions.
Draw a high from the previous high to the bottom of it's real correction (4h retraces to the 20MA, in BTCUSD's case, work.)
Now, extend to the current peak.
Is it failing to retest the 0.236? Get out, prepare a to buy at the 0.618 if it holds.
0.618 holds? buy but prepare to sell at 0.382.
0.618 fails? try at 1.0
Buy at 1.0 but prepare to sell at 0.618.
0.618 is now resistance?
Congratulations, you have a bearish reversal.
Feel free to keep playing this game of buying and selling at fib levels and moving averages: if it will drop to 1.618, sell again at 1. Drop to 2.618, sell at 2.0, drop to 3.618, sell at .. well, 2.0 again if it will reach it. otherwise 2.618
If there's signs of a reversal, you can draw a new fib retracement from the top to the newly minted bottom and repeat the same game up the stairs
What i'm trying to say is..
Bitcoin isn't done dropping, but that doenst mean there arent any opportunities.

BTCUSD 22-Nov-2017 broke new high (Daily)BTCUSD broke to a new high at $8375.
Possibly looking to correct between the 7650 - 8290 range.
Resistand : 8290
Support : 7650

BTCUSD 1H Bullish ContinuationPrice dropped to 50% fib retracement then reversed long. First Entry would have been after 1 candle pullback @ 8010.00. Original buy stop was 8110.00. First take profit would be swing high. Price hit swing high and broke above it. Nice to watch and learn how this pair reacts to fast drops in price.

Elliott Wave: Week of 11/20/17 - Unhappy Thanksgiving?The odds are lining up against the bulls. They may see a holiday cheer with a kiss of 2600 if lucky. However, the pullback from 2597 is incomplete and Bears are preparing for their feast. Continuing last week's issue the pullback is underway for an eventual total of 2-3% from the 2597 peak.
Elliott wave count, a Fibonacci level of 1 from the the 2/2016 low, a head and shoulder technical analysis pattern and violation of a lower channel line are all bearish signs for the near term. There is even a case for a harmonic butterfly pattern I've placed here:
The Bears will have their time - for now. Happy Thanksgiving and enjoy the holiday.

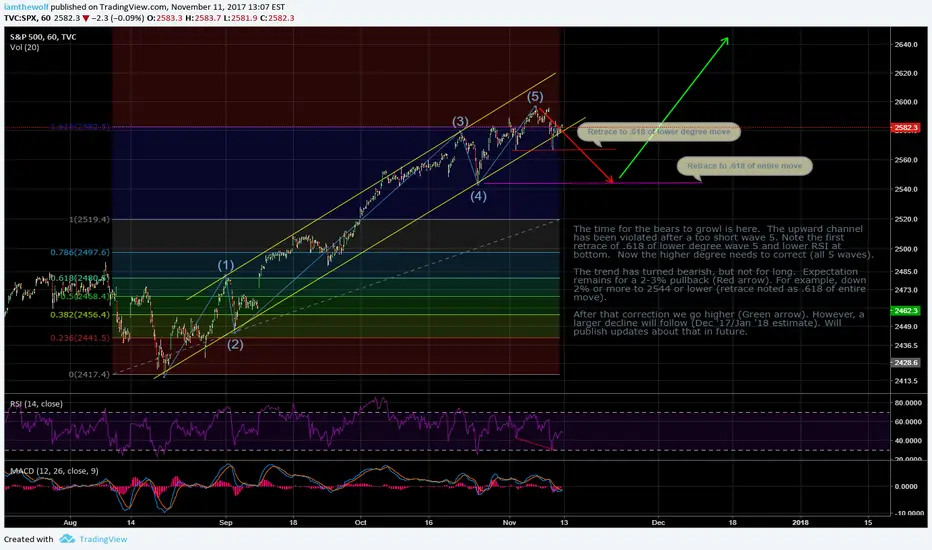
Elliott Wave: Week of 11/13/17 - Something for everyoneTime for a pause of the upward trend while the Bears to welcome cooler times. Their romp will be brief, but I expect their volume to be loud. A pullback of 2-3% has been long anticipated and is finally here. For the Bulls it provides a breather before the next advance. A much larger tussle is ahead in Dec/Jan. For now, there is something for everyone.
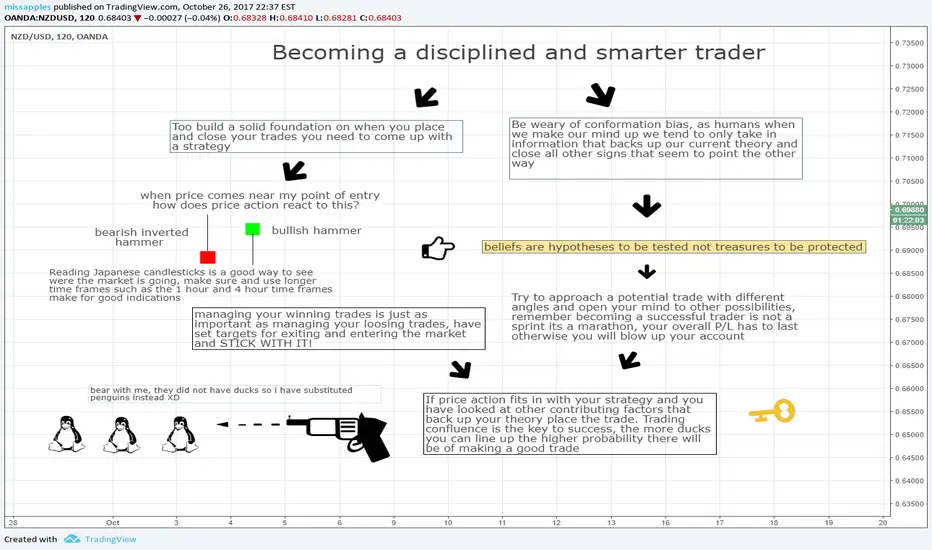
Becoming a disciplined and more thoughtful traderHello there, everyday i look in the chat and i see people making trades based on fomo, chasing price and news and i wanted to bring to life a few steps that i have in place before making a trade. I hope this is helpful! best of luck!