Beginners tutorial - How to correctly use your FIB tool.If you enjoyed the turorial please comment below and i will upload more of these educational videos.
Fibonacci

What to look for in a high probability trade set up Price pulled back and closed at the 38.2% Fibonacci Retracement Level ; 50% Fibonacci Retracement Level ; Horizontal Support Resistance Level ; EMA 10 Support Level ; EMA 20 Support Level.
These conditions created a favorable environment for a long position in the currency market. Watch for more of these conditions for high probability trade set ups.

⁉️ How to use Fibonacci Retracement?‼️ Forex traders use Fibonacci retracements to pinpoint where to place orders for market entry, taking profits and stop-loss orders. Fibonacci levels are commonly used in forex trading to identify and trade off support and resistance levels. After a significant price movement up or down, the new support and resistance levels are often at or near these trend lines . Usually the price retracts to 50% or untile OTE (0.62, 0.705, 0.79) before another impulse movement occurs.

Best Pairs To Trade For BeginnersWatch this short clip for my top 5 pairs beginner should look to trade starting out and even as you advance in your career.
Emjoy!!!

Fibonacci Analysis - Part 1
A. Fibonacci Series
01. The Fibonacci series is a sequence of numbers starting from zero arranged so that the value of any number in the series is the sum of the previous two numbers.
02. The Fibonacci sequence is as follows:
0 , 1, 1, 2, 3, 5, 8, 13, 21, 34, 55, 89, 144, 233, 377, 610, …
B. Properties Of The Fibonacci Series
03. The series extends to infinity.
04. Divide any number in the series by the previous number; the ratio is always approximately 1.618. For example:
610/377 = 1.618
377/233 = 1.618
233/144 = 1.618
05. The ratio of 1.618 is considered as the Golden Ratio.
06. Further into the ratio properties, one can find remarkable consistency when a number in the Fibonacci series is divided by its immediate succeeding number. For example:
89/144 = 0.618
144/233 = 0.618
377/610 = 0.618
07. Similar consistency can be found when any number in the Fibonacci series is divided by a number two places higher. For example:
13/34 = 0.382
21/55 = 0.382
34/89 = 0.382
08. Also, consistency is when a number in the Fibonacci series is divided by a number 3 places higher. For example:
13/55 = 0.236
21/89 = 0.236
34/144 = 0.236
55/233 = 0.236
C. Fibonacci Retracement
09. Fibonacci analysis can be applied when there is a noticeable up-move or down-move in prices.
10. Whenever the stock moves either upwards or downwards sharply, it usually tends to retrace back before its next move.
11. ‘The retracement level forecast’ is a technique that can identify up to which level retracement can happen.
12. Fibonacci retracements are movements in the chart that go against the trend.
13. In finance, Fibonacci retracement is a method of technical analysis for determining support and resistance levels. It is named after the Fibonacci sequence of numbers, whose ratios provide price levels to which markets tend to retrace a portion of a move before a trend continues in the original direction.
14. A Fibonacci retracement forecast is created by taking two extreme points on a chart and dividing the vertical distance by important Fibonacci ratios.
15. 0% is considered to be the start of the retracement, while 100% is a complete reversal to the original price before the move.
16. Horizontal lines are drawn in the chart for these price levels to provide support and resistance levels.
17. Unlike moving averages, Fibonacci retracement levels are static prices. They do not change.
18. Because these levels are inflection points, traders expect some type of price action, either a break or a rejection.
19. The 0.618 Fibonacci retracement that is often used by stock analysts approximates to the "golden ratio".
D. How should you use the Fibonacci retracement levels?
20. Think of a situation where you wanted to buy a particular stock, but you have not been able to do so because of a sharp run-up in the stock.
21. The most prudent action to take would be to wait for a retracement in the stock in such a situation.
22. Fibonacci retracement levels such as 61.8%, 38.2%, and 23.6% act as a potential level up to which a stock can correct.
YASER RAHMATI

Elliott Wave zig zags can be a gateway to other patterns. It is important to remember that just because you have a completed zig zig, you do not necessarily have a completed correction... it could only just be the beginning. Please like and follow if helpful. Cheers!

What is Potential Reversal zone and how to make it?How can we find a Potential Reversal Zone?
Is it enough to just make a simple Retracement or we can make our support zone narrower? how can we be more confident about our possible supports?
What are Fibonacci levels for different types of Fibonacci and what are typical ones among them? How can we implement different wave degrees to make our PRZ even stronger?
You can find answers to all above questions in this video.
I hope you to enjoy this video and wish you all the best.

FIBONACCI TOOL | common reversal levels📊
⚠️Fibonacci levels are one of the most popular tools for analysis. These are price levels that are located in certain parts of the movement corresponding to the mathematical Fibonacci numbers.
✅What are Fibonacci numbers?
🟢In the XIII century, the famous scientist Leonardo of Pisa lived in the Republic of Pisa – the first major medieval mathematician in Europe. On the cover of one of his most famous works was attributed filius Bonacci (son of Bonacci). Hence the nickname Fibonacci.
🟢The Fibonacci numbers are a sequence of numbers derived from Leonardo's experiment on rabbits. The Pisan mathematician decided to find out how many pairs of rabbits will be in a fenced pen a year after the start of breeding (provided that there will be only one pair in the pen in the first month). In the third month, the cuts began to multiply recurrently – each subsequent number was equal to the sum of the previous two (1, 2, 3, 5, 8, 13, etc.).
🟢If any number from the sequence is divided by the previous one, you get a number tending to 1.61803398875… This number is the "golden ratio". In algebra, such a number is called the Greek letter phi. When dividing any number from the sequence by the following, the inverse of phi 0.618 is obtained. When dividing any number from the sequence by the number following one, 0.382 is obtained. In this form, Fibonacci numbers are much more familiar to traders.
✅Correction levels
🟢Correction (retracement) - movement against an existing trend. The correction "absorbs" part of the trend movement. Of the Fibonacci numbers, 38.2 are mainly used for correction levels (from the previous trend movement), 50%, 61,8%, 78,6%.
🟢Correction levels are based on candle wicks, in other words, on their maximum or minimum points. To build a correction level, you need to find a trend. Fibo levels can be asymmetrical, so it is especially important to pay attention to where the beginning and end of the wave on which the level is being built are located.
🟢On a downtrend, 0% at the bottom, 100% at the top. When ascending, the opposite is true. The most significant correction level is 61.8. When a breakdown of this level occurs, a new trend in the opposite direction usually begins. After that, it is necessary to build a new corrective level.
🟢Correction pattern – movement between minor correction levels. After such a move, the price usually moves to the key level of 61.8. 4 patterns are depending on which levels of correction the price concerns.
❗️Even if the skills of analyzing the state of the market by Fibonacci levels will not be a big advantage in trading, then in any case it is a great (and to some extent integral) experience of technical analysis. Fibo levels can be combined with a footprint, deltas, and other tools. The trader will understand only in practice if it is possible to benefit from this or not.
❤️ Please, support our work with like & comment! ❤️

Discount/ premium pricing - SMC📉 We use the Fibonacci retracements for spotting discount and premium levels in a range.
📝 We draw the Fibonacci tool from the bottom to the top in an uptrend, and from the top to the bottom in a downtrend.
Terminologies:
EQL: equilibrium = a state of physical balance (50%).
Discount: we buy from
Premium: we sell from
To make it more approachable, we can compare using the fib tool as a scanner when you go to the supermarket. You won't buy the product when it's expensive, but only buy when it's cheap. Beside that - if we want to sell a product to a supermarket, we want to get the highest price as possible.
Combining it with order blocks
You can basically increase the probability of order blocks with the fib tool. Order blocks that are not in discount you won't buy from, and order blocks that are not in premium you won't sell from.

Why Price Matters - SPX to $4200The SPX reversal to $4,200 provides an opportunity to learn from the pros and get back to the basics of trading. This means understanding the numbers and being able to buy things wholesale and sell them at a retail price. With this knowledge, you can be a successful trader.

Quantum Mechanics in Financial MarketsWave–particle duality is the concept in quantum mechanics that every particle or quantum entity may be described as either a particle or a wave.
Basically has 2 types of behavior.
Duality concept is present in Financial Markets
We have 2 directions of outcomes of the market activity.
UP and Down assumed as Bulls and Bears
Whatever we see on a chart is nothing but outcome of Interference of Bulls and Bears in a given TIME.
Indeed at given price we have certain confrontation of 2 forces. Like a spin of a particle, it has 2 CHARGES when MEASURED at given point of TIME: Positive and Negative.
Wave dualism are applied to fractal with fibonacci ratios.
These ratios are used irregularly in my analyses not by a chance.
Just like the alternation of the dim and contrasting bright colors are used to simulate the Quantum Phenomena.
The steeper the angle of incline of fibonacci channels the more it is related to TIMING of the Fractal.
We witnessed in my number of ideas how Fibonacci ratios work well with reversals.
The direction of fib channels covers the MOMENTUM of the market representing the dualism of the market inside ratios.
Behavior of masses rhymes on lines of Fibonacci Channels which shows interconnectedness of critical points of the market activity.
Peaks and Bottoms must be indexed with fibonacci ratios and adjusted to golden ratio to make sense out of bits waves.
Crossing means a takeover of either of participants of the market activity.
Just playing with a fractal idea using fibs within fibs initially the setup hadn't developed yet, so I pulled from current resistance down to support, checked overhead and to the left price history for confluence with the idea, and sure enough price action is respecting them on the money. As the chart develops I will reset the fibs to what ever the larger chart pattern begins to form.

How To Trade Pullbacks Using The Fibonacci Retracement ToolHey Purpose Traders. I pray all is well. In this video, I wanted to give you a deep, but quick insight on how you can trade pullbacks using the Fibonacci Retracement Tool.
I'd love to know your thoughts and if you have any questions. Lets chat in the comment section below.

Trend-Based Fibonacci ExtensionIn this video I offer a tutorial on how to use the trend-based Fibonacci extension tool on multiple timeframes.

Fibonacci Retracement LevelsIn this video I offer a tutorial on how to draw fibonacci retracement levels on various timeframes.

LINKUSDT The Importance of 0.886 and 0.146 Fibonacci RatiosWhy 14.6% (.146) and 88.6% (.886) are important levels on Fibonacci retracement? The 14.6 Fibonacci ratio, wich has a high mean of assertivity, is mirroned by 88.6, which has become an important entry level and stop loss in the market. 88.6 = 1 - X, X = 14.6. These are hidden levels on the standard scale. But you can add them manually.
As you can see on chart, my fave way to use the Fibonacci Retracement is setting the .50 level at the pivot point** that precedes a pullback, i.e. the lowest low of the first downtrend. The price generally tends to retrace at least to the 0.707* level, which is another hidden level. The most common case in the crypto market, according to my experiences, is the price going into the zone between 0.886 and 0.786. In many cases touching 88.6, which can be considered a conservative point for a stop loss. If the price does not retrace from this zone, then a potential trend reversal can be considered. I have considered the range between 88.6 and 78.6 to be a 'short zone', that is, a zone where I usually wait for a reversive price action, or you could say a potential reversal zone.
When price follows the trend after retracing then I consider 14.6% as my potential target. Means that tendence continues.
This complete zig zag movement is what we call a swing, upward or downward.
*0.707 (70.7%) is the square root of 0.5 Fibonacci ratio, wich is a ratio between 1 and 2.
**Pivot points (some call them "swing points") are those areas where important short term reversals take place.
Okay, let's see what happens during this trade.
Thanks for your attention.

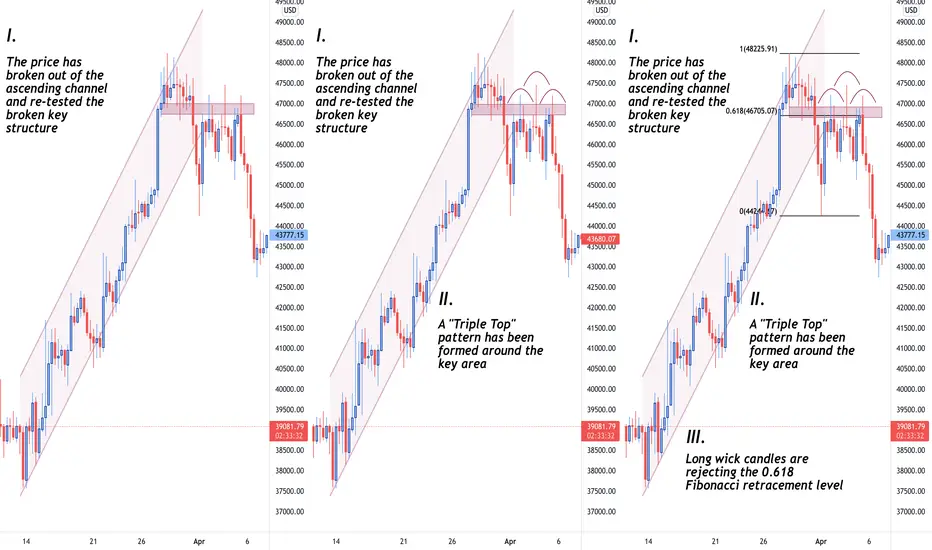
Power of Having Multiple Confluences in TradingThe more confluences you have, the more confident you are in the fact that your technical setup will play out according to the plan. Confluences come in different shapes and styles, whether it is combining some Moving Averages and Bollinger Bands with price action, or having your grandma flip a coin a decide the faith of Bitcoin.
On the graphical illustration that you can see on the screen, 3 confluences have been utilised to back up our idea and they are the following:
1) "Break + retest" formation
2) "Triple Top" pattern
3) Fibonacci retracement tool
It can be noticed from the left hand side of the screen, that the price has nicely broken out of the ascending channel and re-tested the local key structure. Moving to the next step, it can be emphasised that a nice "Triple Top" pattern has been formed. Lastly, we add another confluence to back up a possible scenario that we have eyes on by using the 61.8% Fibonacci retracement level, which is referred to as the "Golden Zone". Taking a look at the chart, we can clearly observe that long candle wicks are nicely rejecting this very zone.
All in all, combining multiple confluences give us enough confluence to back up our sentiment. However, nothing is 100% guaranteed in the markets, meaning that it is not promised that your trade will play out perfectly no matter how many confluences you have. Thus, be risk-tolerant, patient, and cold-blooded!
Have a great upcoming weekend, everyone!
FIBONACCI Retracement ✅✅✅‼️ Forex traders use Fibonacci retracements to pinpoint where to place orders for market entry, taking profits and stop-loss orders. Fibonacci levels are commonly used in forex trading to identify and trade off support and resistance levels. After a significant price movement up or down, the new support and resistance levels are often at or near these trend lines . Usually the price retracts to 50% or untile OTE (0.62, 0.705, 0.79) before another impulse movement occurs.

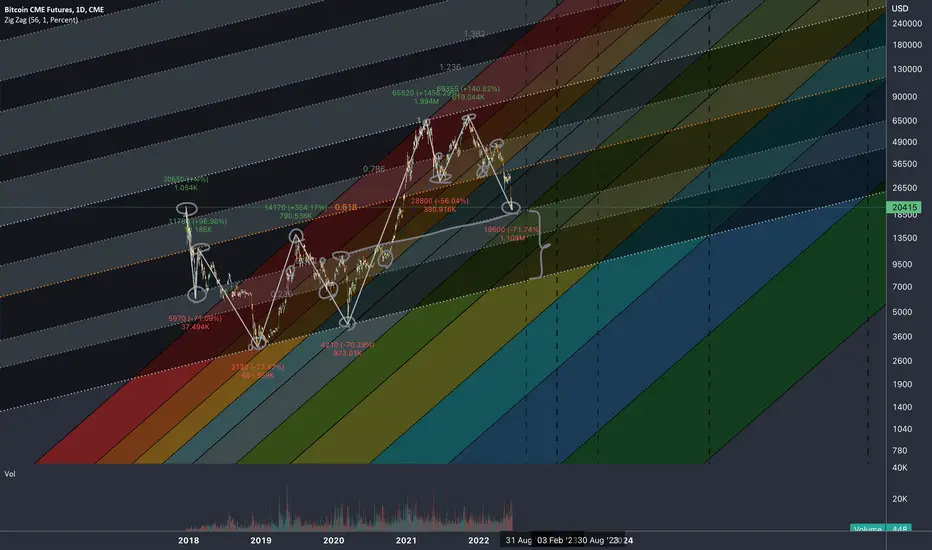
1977 Interactive Double Zigzag Elliott Wave TheoryS&P 500 Index (SPX)
Trying to dive into some Elliott wave theory and I have a more "interactive" chart to present based off of historical data. I chose this sequence and timeframe because it seems easiest to understand with confirmed examples from some of my own reading materials. This was notated by previously known EWT masters to be a "Double Zigzag" corrective wave, in a bull market. I have taken the time to attempt to notate the subdivisions more clearly. This may not be perfect, but it is the best I can provide of a learning resource at this moment from my current understanding of EWT. The wave degrees may be slightly wrong but I think the wave count is technically correct as long as the first wave C of the first move down is actually some sort of diagonal. I also speculated that it could be a triple-three but I think a diagonal impulse makes more sense in that phase of wave C. Thanks for checking it out! Follow for more EWT ideas!
My Elliott wave analyses could be wrong at any moment , this is practice solely for educational purposes. Please do your own research as always!
Thanks for tuning in :) Disclaimer, anyone in the trade needs to do their own due diligence and decide what is right for YOU. My charts can be wrong at any time and it's very important that you have your own strategies and plans in place. I run this channel for my own educational purposes of learning to trade, and I will never be 100% right, so please do not let me confirm any bias for you! (Dangerous to do so, stay safe and remember the basics & rules of risk assessment.) Expect the unexpected and happy trading!

Take Profit Screener Indicator updateWith this new version, the Fibonacci borders are calculated and placed automatically on your charts.
No need to place the top border manually any more.
You still have the possibility to move it manually if you consider that the indicator has not identified the right ATH (Pivot point)
Enjoy !

How to use different types of Fibonacci in TradingViewWave Relationships and their relation by Fibonacci Ratios are among the most helpful tools for target prediction.
There are different types of Fibonacci and different tools with different names in different software packages. This may make users somehow confused . Here, we try to shed some light on various mostly used Fibonacci types and explain their usage for target prediction. Also we explain their related tool in TradingView and their way of implementations.
As shown on the chart, there are four main types of Fibonacci :
1- Internal Retracement
2. External Retracement (Extension)
3. Expansion
4. Projection
Before going through details, it is worth to mention that knowing wave relationships is a key to implement Fibonacci tools accurately. Different types of wave relationships is beyond the scope of this publication. Here, for simplification, we show most simple type of wave cycle which is ascending complete cycle with one 5 leg up impulse and one abc form of correction . Also, we try to explain more typical Fibonacci Ratios for target prediction and skip less often ones.
1. Internal Retracement:
This is simply for calculation of the amount of correction in the main trend. It means we can predict where a counter trend correction may end.
As shown on the chart, it can be used for target prediction of wave 2 and 4 in an up trend and also wave B in a down trend. It can also be used for calculation of end of wave C which is the end of correction of whole up going wave. Green arrows on the picture show the direction of using this tool which is "Fib Reracement" in TradinView. For example, we put first point at the start of wave 1 and second point at the end of this wave for obtaining possible targets for wave 2 and so on.
Wave 2 can end at 0.382, 0.5, 0.618 and 0.786 Fibonacci Retracement levels of wave 1. Fibonacci levels at which wave 2 ends can send us a signal about the amount of next waves. This is again beyond the scope of this publication.
Wave 4 can typically end at 0.382 or 0.5 Retracement of wave 3. Less and more amount of Retracements are also possible, but those make wave relations more complicated and does not match with our simple shown example.
Wave B typically corrects 0.382 , 0.5 and 0.618 of wave A in a simple zigzag correction. More Retracements signals for more complicated corrections e.g a flat correction.
Wave C Retracement levels are similar to wave 2 in shown wave cycle since it is end of a larger degree wave 2.
2. External Retracement:
This Fibonacci which is also called " Extension" can be used for calculation of end of wave 3 or 5 in an up trend and end of wave C ( which is end of whole correction) in a down trend.
We have same tool as internal retracement in TradingView however ,unlike internal Retracement, an extension should be drawn from a high to a low in an up trend and vice versa as shown by green arrows on the related figure.
Wave 3 Fibonacci Ratios by extension depends on the amount of wave 2 correction. For example, 1.618 or 2.618 extension of wave 2 can be the target for wave 3. Robert. C. Miner has proposed a very useful table for targets using external retracement.
Wave 5 typical targets are 1.272, 1.414 and 1.618 extensions of wave 4. This ratios are also the same for calculation of end of wave C.
3. Expansion:
Based on my experience, Fibo expansion is most useful when we have over extended waves for example over extended wave 3. In this case , 1.618 or even 2.618 Fibo levels can be the typical targets.
Related tool in TradingView is Trend-Based Fib Extension. Please note that this tool in TradingView is a three point Fibonacci while expansion is two point Fibonacci tool. Therefore, Implementing this tool for obtaining Expansion levels is a little tricky. For example, for calculation of wave 3 we should put first point at the start of wave 1 and double click on end of wave 1.
There are also more details in implementing Fibo expansion for example we have different types of Fibo expansion. We can skip details here to keep this publication as simple as possible.
4. Projection:
This is the only 3 points Fibonacci that we have. Some software packages call this Fibonacci as Expansion !!. Its related tool in TradingView is Trend-Based Fibo Extension. It is a very useful tool for calculation of end of wave 3, 5 and C.
Again green arrows show how to use this tool . For example, For wave 3 target calculation we set first point at the start of wave 1, second point at end of wave 1 and third point at the end of wave 2 or start of wave 3.
1.618 and 2.618 Fibo levels are typical for end of an extended wave 3 when using Fibo projection.
100 % Projection of wave 1 from low of wave 4 is a typical one for end of wave 5 target. Also 0.382 or 0.618 projection of wave 1-3 from low of wave 4 is a helpful ratio for wave 5 target calculation.
For a wave C, most common projection is 100 % of wave A from top of wave B.
How to make a Potential Reversal Zone ( PRZ) :
We can make our potential reversal zone stronger by combining all proposed tools . Take another look at the figures. What can we see? yes. We know four tools now for calculation of end of wave C. Suppose how strong a possible buy zone can be when 4 different tools suggest it as potential reversal target !
Hope this to be helpful. Please do not hesitate to ask questions if you feel need to ask.
Good luck every one.

messing around with circles & fibsMainly experimental 👽
Using 20/07 swing low and daily PA prior to that date, start determining the circles levels (roughly 9 11 18 24 28 32 34 38 50 54 56 59 61, totally eyeballed that)
The goal is to see if this circles are still relevant on the other half !
Let's wait couple of years and see how it evolves.

Fibb lessonHere is all i have learned about the fibonacci retracement tool...
Analysis into his chart:
Price retraces to 50 fibs level
This indicates a strong uptrend.
Thus a bounce on 0.5 fibs could
give high probability to target - 0.272
As a take profit
