From A to D:How to Use the ABCD Pattern to Forecast Market MovesAre you familiar with the ABCD trading pattern?
In this article, I will provide a comprehensive explanation of the ABCD trading pattern, including its characteristics, how to identify it, and how to use it in trading. So, sit back, relax, and enjoy the information provided in this article.
The ABCD ( AB=CD ) pattern , It's a harmonic pattern that is easily recognizable on a price chart and is composed of four points. This pattern follows a specific sequence of market movements that traders can use to predict potential price swings in the future. The ABCD pattern can be applied in various market conditions, including both bullish and bearish markets, and can be used to speculate on the movement of different forex pairs by simultaneously selling one currency and buying another. However, it's important to keep in mind that the ABCD pattern should not be the sole basis for making trading decisions. It should be used as a tool to inform your decisions.
The first step in opening a position using the ABCD pattern is to identify the pattern on a price chart. Multiday charts can provide insight into the behavior of forex markets over an extended period. You can use daily, hourly, or minute-by-minute charts to spot the pattern, but it's crucial to choose a time horizon that aligns with your goals. For instance, traders looking to hold positions for days or weeks may prefer daily charts instead of minute charts.
Once you have selected the appropriate chart type, you can search for the ABCD pattern to identify bullish or bearish signals.
Let's now take a closer look at how the AB=CD pattern forms and how to spot it:
When identifying the ABCD pattern, traders focus on the legs or moves between points. The moves in the direction of the overall trend are denoted as AB and CD, while BC represents the retracement.
Once you think you have identified an ABCD pattern on a price chart, the next step is to use Fibonacci ratios to validate it. This process can also help you pinpoint where the pattern may complete and where to consider opening your position.
The "classic" ABCD pattern follows a specific sequence of market movements, with the following rules:
In a "classic" ABCD pattern, the BC line should ideally be 61.8% or 78.6% of AB. To determine this, traders often use the Fibonacci retracement tool on the initial move from point A to point B. The BC line should end at either the 61.8% or 78.6% Fibonacci retracement level of AB. This helps confirm the validity of the ABCD pattern and gives an idea of where to potentially open a position.
Once the BC leg of the pattern is complete, traders would typically look for the CD leg to reach the 127.2% or 161.8% extension of the BC leg. At this point, traders might consider entering a sell position if the pattern is bearish or a buy position if the pattern is bullish.
The ABCD pattern extension occurs when the CD leg extends beyond the typical 127.2% and reaches 161.8%. This indicates that the price trend may continue in the same direction for a longer period, providing a potentially profitable trading opportunity for traders who have correctly identified the pattern. It's important to note that this extension is not always reliable and should be used in conjunction with other technical analysis tools to confirm the validity of the trade.
Note: In strongly trending markets, the retracement (BC) may not reach the usual 61.8% or 78.6% of AB, but only 38.2% or 50%. It's important to adapt to market conditions and adjust your analysis accordingly.
Moreover:
During the move from A to B, the market should not exceed either A or B.
During the move from B to C, the market should not exceed either B or C.
During the move from C to D, the market should not exceed either C or D.
For a bullish ABCD, point C must be lower than A, and D must be lower than B.
For a bearish ABCD, point C must be higher than A, and D must be higher than B.
To identify an ABCD pattern on your TradingView trading chart, follow these six steps:
1 ) Log in to your TradingView trading account and open a market chart.
2 ) Locate the AB line. Remember that this move should be completely contained within points A and B.
3 ) Locate the BC retracement. This should reach either the 61.8% or 78.6% level of the move from A to B.
4 ) Draw the CD line. Using the AB and BC lines, you should be able to predict where point D will fall. CD will generally be equivalent to AB and either 127.8% or 161.8% of BC in both price and time.
5 ) Keep an eye out for price gaps and wide-ranging bars in the CD leg. These can indicate that an extension is forming, implying that CD may be longer than AB.
6 ) Trade the possible retracement at point D. If you've identified a bearish ABCD pattern, consider opening a sell position. On the other hand, if you've found a bullish one, consider buying.
And here are a couple of examples:
I hope you found this guide on identifying the ABCD pattern useful. Let me know your thoughts in the comments section below, and don't forget to like and follow me if you found this guide helpful.
Fibonacci

How to Use Fibonacci RetracementsIf you’re wondering how to trade Fibonacci retracements, you’re in the right place. Today, we’ll be breaking down why traders use Fibonacci retracements and how you can apply them in your own trading, and we’ll list our top tips for making the most out of Fibonacci trading.
The Fibonacci Sequence for Trading
Fibonacci retracements make use of the Fibonacci sequence and the resulting Golden Ratio. Simply put, the Fibonacci sequence is a mathematical concept that starts at 0, then 1, with each following number being the sum of the previous two. It goes 0, 1, 1, 2, 3, 5, 8, 13, 21, 34, and so on.
What we’re interested in is the relationship between the numbers. For example, one number in the sequence divided by the next, like 13/21, will always roughly equal 0.618 (the Golden Ratio). In the case of 13/21, it’s 0.619. As the sequence progresses, the ratio moves closer to 0.618. There are other calculations that we won’t discuss here, but they also give us complimentary ratios of 0.236, 0.382, and 0.786.
Notably, traders typically pay the most attention to the 0.382 and 0.618 ratios. 0.5 is also commonly used, despite not being a true Fibonacci ratio. When using Fibonacci patterns while trading, these ratios are typically expressed as percentages, such as 38.2%, 50%, and 61.8%.
Applying the Fibonacci Numbers to Trading
While these ratios are most often applied to Fibonacci retracements, there are actually quite a few ways to use them. Fibonacci extensions, fans, spirals, channels, and arcs are all advanced techniques commonly used by professional traders.
The Fibonacci ratios are also fundamental to harmonic pattern trading. The ABCD , Gartley , and Bat patterns, amongst others, all use Fibonacci retracements and extensions. Once you get the hang of Fibonacci retracements, learning these patterns could be an excellent next step in developing your Fibonacci skills.
What Are Fibonacci Retracements?
Fibonacci retracements (also termed “fibs”) allow traders to quickly identify key support and resistance levels using the defined ratios. Thankfully, with the advent of charting software like TickTrader , traders no longer need to calculate these key price points manually. Instead, they can apply the visual Fibonacci retracement tool in just a few clicks.
Fibonacci retracements typically work best in trending markets. For example, the tool can be applied to significant swing highs and lows to find areas of support during an uptrend. Once the price cools off, it’ll often retrace to the 38.2%, 50%, or 61.8% levels before continuing the bullish trend.
Like regular support and resistance levels, you can think of the Fibonacci levels as areas of interest rather than a place where the price will reverse with pip-perfect precision. That’s why candlestick and chart patterns are commonly used in conjunction with Fibonacci retracements. Hammers, shooting stars, triangles, and wedges can all provide you with extra confidence that these levels are likely to hold.
How Can Fibonacci Retracements Be Used?
Fibonacci retracements help traders to predict the levels the price might respect in the future. Given their predictive nature, they can help you determine optimal entry points, stop losses, and price targets when trading in the forex market . Fibonacci retracements can be used across all timeframes, from 1-second to monthly charts, thanks to the fractal, or self-repeating, nature of the Fibonacci sequence.
Using Fibonacci Retracements for Trading
Getting to grips with the Fibonacci retracement tool is easy. There are just two key rules to remember:
If you’re looking for support levels, set the first point at a significant swing low and the second at a significant swing high.
If you’re looking for resistance levels, set the first point at a significant swing high and the second at a significant swing low.
Let’s take a look at a few examples. If you’d like to try your hand at using Fibonacci retracements, you can use the TickTrader platform offered by FXOpen . You can gain access to live charts and use the built-in Fibonacci retracement tool to get started in minutes.
AUD/USD
We can see AUD/USD on the weekly chart following the 2008 financial crisis. After recovering and putting in months of bullish structure, our swing high and low points have formed. Notice that, upon touching the 38.2% area, the price attempted to close below but was rejected three times, giving us three long wicks. This rejection was an opportunity for traders to identify that further bullishness was inbound, which could’ve influenced their lower timeframe decision-making.
XBR/USD
In this example, Brent Crude Oil has shown signs of bearishness on the 15-minute chart, breaking support and making a lower low. By taking the high and low of this bearish move, we can see that the 61.8% area posed significant resistance, offering two bearish candles that indicated that the price wanted to move lower. Additionally, this area also lines up with a level of support-turned-resistance at 61.8%, giving traders extra confirmation that the area could hold.
GBP/USD
In the chart above, GBP/USD struggled to maintain any bullishness on the daily chart, continually making lower highs and lower lows. By using the most extreme swing low, we can see that a retracement to the 50% area gave traders a chance to get in shortly before a further breakdown. Interestingly, note that the 23.6% level acted as a support before the swing low had even formed. Subsequently, it also offered traders an opportunity to get in on the retest on that level before the price moved lower.
Tips for Using Fibonacci Retracements in Your Trading System
Despite their simplicity, there are a few nuances to learn that can help you when trading Fibonacci retracements.
They’re Not a Silver Bullet
As with any trading tool, using Fib retracements won’t suddenly make every trade you take a winner. It’s merely a predictive tool that can help guide your trades, and it should be used alongside other forms of technical analysis to increase your chances of success.
Wait for Closes to Determine Whether an Area is Suitable to Trade
To ascertain whether an area is holding or not, traders will typically look at the strength of the reaction from the zone. If the price closes through the level cleanly without producing long wicks, then it’s less likely that it’ll reverse. In contrast, if the price is continually rejected and seems to be struggling, then it’s more likely to reverse.
Stick to Your Chosen Timeframe
Related to the last point, use the same timeframe on which you set the Fibonacci retracement to determine whether the area is likely to reverse. If you set it on the 1-hour chart, then look at how it closes on the same timeframe. While tempting, if you switch to the 15-minute or 5-minute charts to see how the price is reacting, it’s likely to provide contradictory signals that will only complicate your analysis.
Be Aware of Higher Timeframe Trends
As with many aspects of trading, it’s always best practice to be cognisant of the higher timeframe trend and trade in harmony with it. For example, if the trend on the daily chart is bullish, looking for bearish retracements to go long on the 4-hour and 1-hour charts will likely yield better results than trying to trade a counter-trend.
Your Next Steps for Creating a Fibonacci Retracements Strategy
If you’re wondering how to create a Fibonacci trading system, you can:
1. Spend some time experimenting with the Fibonacci retracement tool on historical price charts.
2. Apply Fibonacci retracements to live charts and revisit them to discover how the price reacted at the key levels.
3. Once you feel you have a decent understanding of how to use Fibonacci retracements, you can open an FXOpen account and use a free demo account to test them in live markets.
4. Take notes of what works and what doesn’t, and begin to formulate a trading strategy.
5. Experiment further with indicators you’re familiar with to see if they can provide extra confirmation for your trades.
6. Continually practise and refine your strategy until you’re ready to use it for real. Don’t forget risk management.
7. Learn more about Fibonacci trading and keep refining your strategy until you’re happy with it.
This article represents the opinion of the Companies operating under the FXOpen brand only. It is not to be construed as an offer, solicitation, or recommendation with respect to products and services provided by the Companies operating under the FXOpen brand, nor is it to be considered financial advice.

TrueLevel Bands: One of the Most Useful IndicatorsThe TrueLevel Bands Indicator: Why It's One of the Most Useful Indicators Out There
The TrueLevel Bands indicator is a powerful technical analysis tool that helps traders identify trends and potential reversal points in the markets. It is a versatile and customizable indicator that can be used on any financial instrument, including stocks, commodities, forex, and cryptocurrencies.
In this article, we'll explore the TrueLevel Bands indicator in detail, and explain why it's one of the most useful indicators for traders.
What Are TrueLevel Bands?
TrueLevel Bands are a type of envelope indicator that helps traders identify the upper and lower boundaries of a trading range. They are similar to Bollinger Bands, but instead of using a fixed number of standard deviations from the moving average, TrueLevel Bands use a multiple of the standard deviation that is determined by the length of the moving average.
The TrueLevel Bands indicator consists of two lines: an upper band and a lower band. The upper band is calculated by adding a multiple of the standard deviation to the moving average, while the lower band is calculated by subtracting the same multiple of the standard deviation from the moving average.
How to Use TrueLevel Bands
TrueLevel Bands can be used in a variety of ways, but their primary purpose is to help traders identify trends and potential reversal points in the markets. Here are a few ways that traders can use TrueLevel Bands:
1. Trend identification
One of the most significant advantages of TrueLevel Bands is the cloud created by the transparency of the fill color between the upper and lower bands. This cloud makes it easy to visualize the trend at a glance, without having to rely on complex technical analysis tools or methods. The cloud effect also provides a clear indication of the strength of the trend. The wider the cloud, the stronger the trend, while a narrow cloud indicates a weaker trend or consolidation. This feature is particularly useful for traders who prefer to use visual cues to make trading decisions.
TrueLevel Bands make it easy to identify the direction of the trend. When the price is above the cloud, it is considered to be in an uptrend. Conversely, when the price is below the cloud, it is considered to be in a downtrend.
2. Reversal points
TrueLevel Bands can also be used to identify potential reversal points in the markets. When the price reaches the upper band, it is considered to be overbought, and a reversal to the downside may occur. Similarly, when the price reaches the lower band, it is considered to be oversold, and a reversal to the upside may occur.
3. Support and resistance levels
TrueLevel Bands can also be used to identify support and resistance levels. When the price is trading within the bands, the upper band serves as a resistance level, while the lower band serves as a support level. Traders can use these levels to identify potential entry and exit points for their trades.
4. Volatility
TrueLevel Bands can also be used to measure volatility. When the bands are narrow, it indicates that the market is experiencing low volatility. Conversely, when the bands are wide, it indicates that the market is experiencing high volatility.
5. Fibonacci-based length options
In addition to the standard length options (250, 500, 750, 1250, 2000, and 3250), TrueLevel Bands also offer Fibonacci-based length options. These lengths are spaced out in a way that allows traders to capture different time frames and market movements, from short-term fluctuations to longer-term trends.
The Fibonacci-based length options were chosen by multiplying 125 (which represents 6 months of daily data) by a sequence of Fibonacci numbers, starting with 2. The resulting lengths are: 250 (125 x 2), 375 (125 x 3), 500 (125 x 4), 325 (125 x 5), 750 (125 x 6), 1000 (125 x 8), 1250 (125 x 10), 1625 (125 x 13), 2000 (125 x 16), 2625 (125 x 21), 3250 (125 x 26), 3750 (125 x 30), and 4250 (125 x 34).
By using these Fibonacci-based length options, traders can take advantage of the natural patterns and rhythms that exist in the markets. These lengths are spaced out in a way that allows traders to capture different time frames and market movements, from short-term fluctuations to longer-term trends.
Why TrueLevel Bands Are More Accurate Than Moving Averages
Moving averages are a popular technical analysis tool that help traders identify trends and potential reversal points in the markets. However, they have a few drawbacks that make them less accurate than TrueLevel Bands.
1. moving averages are based on past prices, which means they lag behind the current market conditions. This can lead to false signals and missed trading opportunities.
2. moving averages use a fixed number of periods, which may not be suitable for all market conditions. For example, a 50-period moving average may work well in a trending market, but it may be less effective in a choppy or range-bound market.
TrueLevel Bands, on the other hand, use a multiple of the standard deviation that is determined by the length of the moving average. This means that the bands are more responsive to changes in market conditions, and they can adapt to different market environments.
Conclusion
The TrueLevel Bands indicator is a powerful and versatile tool that can help traders identify trends, potential reversal points, support and resistance levels, and measure volatility. It offers a range of length options, including Fibonacci-based options, that allow traders to capture different time frames and market movements.
Compared to moving averages, TrueLevel Bands are more accurate and adaptable to changing market conditions. They can help traders make better-informed trading decisions and improve their overall trading results.
If you're looking for a reliable and versatile technical analysis tool, give the TrueLevel Bands indicator a try. It might just be the missing piece in your trading toolbox.

How to Use Fibonacci ExtensionsHave you ever noticed that market movements often seem to occur in repeatable patterns? Well, that’s where Fibonacci extensions come into play. Join us in this article as we dive into the world of Fibonacci extensions and discover how they can be a strong addition to your trading arsenal.
A Primer on Fibonacci Ratios
Fibonacci ratios are derived from the Fibonacci sequence, where each number is the sum of the two preceding numbers. The sequence begins with 0, 1, 1, 2, 3, 5, 8, 13, 21, 34, 55, and so on.
The primary Fibonacci ratio of 1.618, sometimes called the Golden Ratio, is found by dividing one number by the previous. 34 divided by 21, for example, roughly equals 1.619. As the sequence progresses, the ratio becomes more precise and closer to 1.618. Dividing a number by the next, such as if we divide 13 by 21, will give us a ratio of 0.618 (0.619 in the case of 13/21), also commonly used in Fibonacci retracements.
Further calculations produce the Fibonacci extension levels we’re interested in: 1, 1.382, 2, 2.618, and 4.236. In trading, they’re typically expressed as percentages, like 100%, 138.2%, 200%, 261.8%, and 423.6%.
What are Fibonacci Extensions?
Fibonacci extensions (also known as Fibonacci expansions or Fib extensions) are a technical analysis tool that allows traders to determine potential levels of support and resistance for an asset’s price. Like regular support and resistance levels, they should be considered as areas of interest rather than where price will turn with pinpoint precision. They’re most frequently used to set profit targets, although they can also be used to find entries.
Fibonacci extensions can be applied to any market, including forex, commodities, stocks, cryptocurrencies*, and more, and work across all timeframes. While not foolproof, using the Fibonacci extension tool combined with other forms of technical analysis can be an effective way to spot potential reversal points in financial markets.
Fibonacci Retracements vs Extensions
Both Fibonacci retracements and extensions are based on the Fibonacci sequence and the Golden Ratio, but they are used to measure different things in the market. Fibonacci retracements show support and resistance levels during a pullback from a larger move. On the other hand, Fibonacci extensions measure the potential levels of support and resistance for an asset's price after a pullback has occurred.
As shown in the chart above, the Fibonacci retracement tool can be applied to identify where price may pull back to – 50% in this scenario. Then, the Fibonacci extension tool is used to plot where price could end up beyond this pullback. The 100% and 161.8% levels posed significant resistance, causing the price to reverse.
It’s easy to see how both tools can be used in conjunction to build an effective strategy. Generally speaking, traders tend to enter on a pullback to one of the key retracement levels, then take profits at the extension levels. However, either tool can be used to find areas suitable for entries and exits.
Fib Extensions: How to Use
If you’re wondering how to use Fib extensions in your own trading, here are the steps you need to follow.
1. Click to set the first point at a major swing low if expecting bullishness or swing high if expecting bearishness. Using the Magnet mode on TickTrader may help you set it with precision.
2. Place the second point at a swing in the opposite direction.
3. Put the third point at the low of the pullback if a bullish move is expected or the high if a bearish move is expected.
That’s it! You now have an idea of where price may reverse as the trend progresses, allowing you to set profit targets or plan entries. You can also double-click the tool to adjust it to your preferences, like removing certain levels and changing colours.
Bullish Example
In this example, we have a swing low (1) followed by a swing high (2) that makes a retracement (3). These three points are all we need to plot a Fibonacci extension. Notice that the 138.2% level didn’t hold, showing that price isn’t always guaranteed to reverse in these areas. However, the wicks and sustained moves lower at the 100% and 161.8% areas gave traders confirmation that a reversal might be inbound.
Bearish Example
Here, we can see that each of the three areas prompted a pullback. Some traders might not consider the 138.2% area valid to trade since it never fully hit the level. However, the easiest way to get around this is to look for confirmation with a break of the trend, as denoted by the first dotted line. Once price gets beyond that swing high (intermittently breaking the downtrend), traders have confirmation that what they’re looking at is likely the start of a reversal.
Some traders subscribe to the belief that if price closes beyond a level, it’ll continue progressing to the next area. While this can sometimes be the case, it can just as easily reverse. Here, price briefly closed below the 161.8% level before continuing much higher.
Making the Most of Fibonacci Extensions
By now, you may have a decent understanding of what Fib extensions are and how to use them. But how do you make the most out of Fibonacci extensions? Here are two tips to maximise your chances of success.
1. Look for confirmation: Instead of blindly setting orders at extension levels, you can look for price action confirmation that price is starting to reverse at the area before taking profits or entering a position. You could do this by looking for breaks in the trend, as discussed in the example above.
2. Find confluence: Similarly, you can use other technical analysis tools like trendlines, indicators like moving averages, or even multiple Fibonacci extensions, to give you a better idea of how price will likely react at a level.
Your Next Steps
Now, it’s time to put your understanding to the test. Spend some time practising how to use Fibonacci extensions and try backtesting a few setups to see how you could’ve gotten involved in a trade. Once you feel you have a solid strategy, you can open an FXOpen account to start using your skills in the live market. In the meantime, why not try exploring other Fibonacci-related concepts, like Fibonacci retracements and harmonic patterns ?
*At FXOpen UK and FXOpen AU, Cryptocurrency CFDs are only available for trading by those clients categorised as Professional clients under FCA Rules and Professional clients under ASIC Rules, respectively. They are not available for trading by Retail clients.
This article represents FXOpen Companies’ opinion only, it should not be construed as an offer, solicitation, or recommendation with respect to FXOpen Companies’ products and services or as financial advice.

HOW TO USE FIBONACCI LIKE A PRO #part1Hi there! Bolu here
The Fibonacci tool is one of the most popular tools on trading view and many traders use Fibonacci on their charts.
FIBS are a major part of my trading system as you can see on this chart, i use it all the time, as I have to know what structure is saying on major and minor structure to aid my analysis and entry/exit confirmations.
I will be sharing how I use my FIBONACCI tool in this post and you can take some notes and add to your trading plan if you want.
BASICS OF FIBONACCI
In mathematics, the Fibonacci sequence is a sequence in which each number is the sum of the two preceding ones. Numbers that are part of the Fibonacci sequence are known as Fibonacci numbers, commonly denoted Fn . The sequence commonly starts from 0 and 1, although some authors start the sequence from 1 and 1 or sometimes (as did Fibonacci) from 1 and 2. Starting from 0 and 1, the first few values in the sequence are:
0, 1, 1, 2, 3, 5, 8, 13, 21, 34, 55, 89, 144.
The history of Fibonacci is all over the internet. My Job here is to show you how it can be used to your trading advantage.
I majorly use the FIB retracement & FIB extension tool. Trading-view provides a whole lot of other types of FIBs, but they are not a part of my trading system, so i only focus on what is relevant to my Trading plan by keeping it simple.
HOW TO USE THE FIBS
It is imperative to understand that Fibonacci retracement is a tool used to measure the retrace of a counter trend based on the current trend.e.g, After a downtrend formation, how far the correction would go would be measured with the FIBs.
while the Fibonacci extension tool is used to measure the 'length' of the continuation of that trend and is mostly used as Take profit levels
IT CAN ONLY BE USED IN A TRENDING MARKET. You need a valid Uptrend point or Downtrend point to draw out your FIBd]
Drawing out FIBs on the chart is a 3step process
STEPS TO DRAW FIBS
STEP 1 : SPOT A VALID BOS.
STEP 2 : IDENTIFY POINT A – POINT B OF THE IMPULSE MOVE .
STEP 3: DRAG FIB FROM THE HIGH TO THE LOW / LOW TO THE HIGH .
I changed the default settings that the FIBS came with on Trading-view and replace the numbers and colors.
Each FIB Percentage level means something unique on the charts and that helps with understanding what the trend is doing.
The retracement levels are used to see how strong the pullback phase is. Understanding the strength of the pullback is one of the most important things to know in the trend . I will probably make another post on 'Trend strength Analysis'..., You can put it in the comments if you would like to study it with me. Now, back to our FIBs.
Every FIB level is uniquely important and useful. The FIB Level that aligns with a key level of structure is High Probability.
In the Part 2 of this post, i would share the 'secret sauce' of the FIB retracement levels and how they can be used in both Major and Minor Structure.

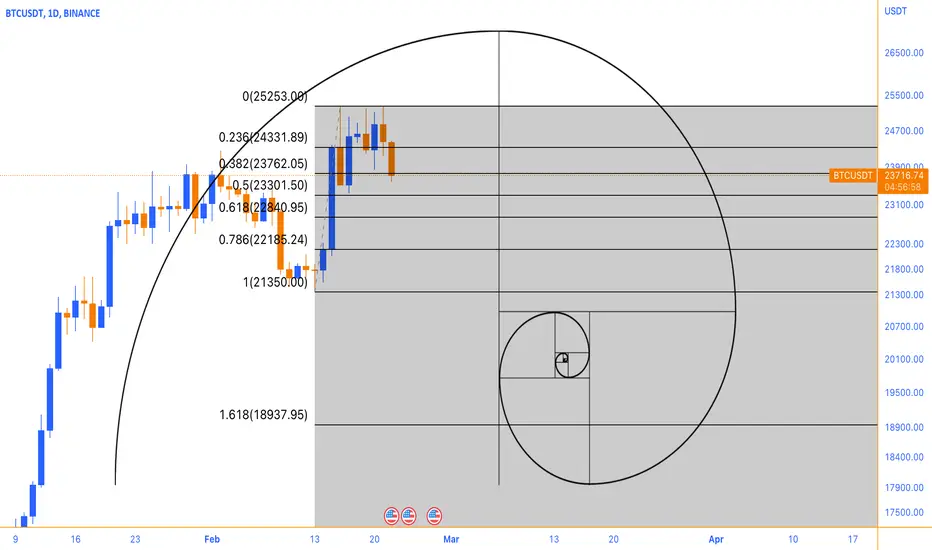
Bitcoin Fractal Dimensions II% 🕘 Fibonacci Reversal Zones give awareness about interconnectedness of historic patterns all the way to current candle. Projecting how one wave can be relative to the other using various Golden Ratios derived from waves of notable cycles.
Application of chaos theory behind the nature of the market in Fractal Geometry.
Long-term alertness for Violet Area:
Why? Because Bitstamp doesn't show candles before 2012. those crucial fluctuations when price was encountering levels.
BLX shows data before 2012 and covered with violet fib area from 1 to 1.618
Fractal Spit Up (Timing):
General Fibonacci Channel responsible for LT Reversals (Price+Time related fib line)
Vertical axis of Critical points of the Wavelength = Price related line
Since market has its own way despite of our perception on price formation, this way we keep neutrality for Long-term strategic aspect.
FREMA Levels:
Curve mimicking lows of price expansion against time scale. Mind 2024 bitcoin halving period.
If it really falls after reaching those hot short-term angled levels, that would be pre "assumed bullrun" period fueled by 2024 halving narrative. That's why relevant to our case fib levels are shown short length. Just like in quantum world particles arrear and disappear or be both, here the levels have their own limited time for the price to be reaching them. The sooner the price reaches them the more crucial reason for presence they have. Since wave frequency right there is high, it applies also to corrective waves. And Since corrective waves would have relatively same momentum measured as angles forming quantum world of possibilities - multi-universe fractal's critical points scaled in unfolding the market. Pretty much all opinions people do classical TA are summarized in terms of the market itself without without actually caring about the news background. Market has its own way and we know that external variable such as news, reports have positive or negative fundamentals already priced in as unfolding pattern to current candles. Odd chaotic movements of the market can be explained through this system of Fibonacci Channels. That's why subjective opinion is way too overrated since market as fractal system of unfolding patterns is more objective than opinions backed by classic TA at specific point of time. After all we care about reversal targets which can be justified by golden ratio rule governing the limits of waves and cycles.
Angles are important because they have time cycle properties within it because market is nothing but a curvature in PriceTime blocks covering variable rates of change of fluctuations.

Fibonacci Levels and How They Can Be Used in TradingGreetings, @TradingView community! This is @Vestinda, bringing you a helpful article on the topic of Fibonacci Retracements and how to effectively utilize them in your trading strategies.
Fibonacci retracement levels are helpful for traders and investors in financial markets. They're horizontal lines on price charts that can show where price may reverse direction.
These levels are based on the Fibonacci sequence, which is a series of numbers that occur in math and finance.
Use case:
The first thing to understand about the Fibonacci tool is that it is most effective when the market is trending.
In an upward trending market, traders commonly use the Fibonacci retracement tool to identify potential buying opportunities on retracements to key support levels. Conversely, in a downward trending market, traders may look for opportunities to short sell when the price retraces to a Fibonacci resistance level.
Fibonacci retracement levels are regarded as a predictive technical indicator because they attempt to forecast where the price will be in the future.
Based on the theory, when trend direction is established, the price tends to partially return or retrace to a previous price level before continuing to move in the direction of the trend.
How to Find Fibonacci Retracement Levels:
Fibonacci retracement levels can be found by identifying the key Swing High and Swing Low points of an asset's price movement. Once these points are established, you can use the Fibonacci retracement tool, which calculates the potential levels of support and resistance based on the ratios between the key points.
To apply the Fibonacci retracement tool, click and drag from the Swing Low to the Swing High in a downtrend, or from the Swing High to the Swing Low in an uptrend. This generates a set of horizontal lines at predetermined Fibonacci ratios, including 23.6%, 38.2%, 50%, 61.8%, and 78.6%.
Are you keeping up with me? ;)
Now, let's explore some examples of how Fibonacci retracement levels can be applied in cryptocurrency trading
The Uptrend:
In this instance, the Fibonacci retracement levels were plotted by selecting the Swing Low and Swing High points, which were observed on January 8th, 2021 at a price of $41,904.
The Fibonacci retracement levels were $33,521 (23.6%), $29,197 (38.2%), $26,114 (50.0%*), $23,356 (61.8%), and $19,925 (76.4%), as shown in the chart.
Traders anticipating that if BTC/USD retraces from its recent high and it will likely find support at a Fibonacci retracement level. This is due to the tendency of traders to place buy orders at these levels as the price drops, creating a potential influx of buying pressure that can drive up prices.
While the 50.0% ratio is not officially recognized as a Fibonacci ratio, it has nonetheless become widely used and has persisted over time.
Now, let’s look at what happened after the Swing High occurred.
Price bounced through the 23.6% level and continued to fall over the next few weeks.
Two times tested 38.2% but was unable to fall below it.
Subsequently, around January 28th, 2021, the market continued its upward trend and surpassed the previous swing high.
Entering a long position at the 38.2% Fibonacci level would have likely resulted in a profitable trade over the long run.
The Downtrend
Next, we will explore the application of the Fibonacci retracement tool in a downtrend scenario. Here is a 4-hour chart depicting the price action of ETH/USD.
As you can see, we found our Swing High at $289 on 14 February 2020 and our Swing Low at $209 later on 27 February 2020
The retracement levels are $225 (23.6%), $236 (38.2%), $245 (50.0%), $255 (61.8%) and $269 (76.4%).
In a downtrend, a retracement from a low could face resistance at a Fibonacci level due to selling pressure from traders who want to sell at better prices. Technical traders often use Fibonacci levels to identify areas of potential price resistance and adjust their trading strategies accordingly.
Let’s take a look at what happened next.
The market did make an attempt to rise, but it briefly halted below the 38.2% level before reaching the 50.0% barrier.
The placement of orders at the 38.2% or 50.0% levels would have resulted in a profitable trade outcome.
In these two instances, we can observe that price positioned itself at a Fibonacci retracement level to find some temporary support or resistance.
These levels develop into self-fulfilling support and resistance levels as a result of all the people who utilize the Fibonacci tool.
All those pending orders could affect the market price if enough market participants anticipate a retracement to take place close to a Fibonacci retracement level and are prepared to enter a position when the price hits that level.
In conclusion:
It's important to note that pricing doesn't always follow an upward trajectory from Fibonacci retracement levels. Instead, these levels should be approached as potential areas for further research and analysis.
If trading were as simple as placing orders at Fibonacci retracement levels, markets wouldn't be so volatile.
However, as we all know, trading is a complex and dynamic process that requires a combination of knowledge, skill, and experience to succeed.
We are truly grateful for your attention and time in reading this post. If you found it insightful and beneficial, we would be thrilled if you could show your support by clicking the <> button and subscribing to our page.
We are excited to share that our upcoming post will showcase what occurs when Fibonacci retracement levels do not perform as expected. Stay tuned for an informative and professional read.

Fibonacci Trick for measuring Risk to Reward RatioIf you don't use your fibb tool much, (save your settings as a template first if you do) or for just a quick check to see if there is enough reward for the risk in the trade, you can set up your Fibonacci in increments of 1 (2.5 is 1:1.5)
Do this as far as you like. You can extend lines left or right to check if the R Ratio you are looking for will fit this market structure, or if you should wait for a better set up.
I happen to see this in a YouTube video, and thought it was very interesting and more than useful...
The settings are as follows :
0 - loss/stop loss price
1 - 1 unit of risk (100 percent)
2 - 1 unit of risk plus 1 unit of reward (1:1)
2.5 - 1 unit of risk, 1.5 unit reward (1:1.5)
3 - 1 unit of risk, 2 unit reward (1:2)
..... and so on.
Then just save it as a template for quick set up later
-- Example of use 6 (600 percent) is 1:5. Just subtract 1 for the risk and the remaining is the reward ratio. Each 100 percent mark is a single unit of risk (-1)
In MT4 its much better to see it directly, as you can label the levels how you wish (using the same formula)

Navigating the Uncertainties of Fibonacci Retracements in CryptoHello, @TradingView community! I'm @Vestinda, and I'm thrilled to share an informative article with you today about Fibonacci Retracements.
While they can be useful tools for traders and investors in financial markets, it's important to note that they are not infallible and may not always produce the desired outcomes.
As discussed in our previous post, Fibonacci support and resistance levels are not infallible and may occasionally break. It is essential to remain vigilant and use these levels in conjunction with other technical indicators and market analysis to make informed trading decisions.
While Fibonacci retracements can be a useful tool in technical analysis, it is crucial to exercise caution and not solely rely on them as the sole basis for trading decisions.
Unfortunately, Fibonacci retracements are not infallible and may not always work as expected.
Let us examine a scenario where the Fibonacci retracement tool proves to be ineffective in technical analysis.
To make a prudent trading decision amidst the ongoing downtrend of the pair, you make a strategic choice to leverage the Fibonacci retracement tool. With meticulous attention to detail, you designate the swing low at 3,882 and the swing high at 10,482 for precise determination of a Fibonacci retracement entry point.
The BTC/USD Daily chart is shown below.
Upon careful analysis, it is evident that the pair has rebounded from the 50.0% Fibonacci retracement level for multiple candles. As an astute trader, you recognize this crucial pattern and conclude that it is a viable opportunity to enter a short position.
You thoughtfully consider, "This particular Fibonacci retracement level is showing remarkable resilience. It is undoubtedly a lucrative moment to short it."
You may have been tempted to take a short position in anticipation of profiting from the downtrend of the pair, while simultaneously daydreaming of cruising down Rodeo Drive in a Maserati.
However, if you had placed an order at that level without proper risk management, your hopes of profit would have quickly dissipated as your account balance plummeted.
Observing the price action of BTC, let's examine what occurred next.
Indeed, the price action of BTC demonstrates that the market is constantly evolving, and traders must be prepared to adapt to these changes.
As shown in this specific case, the price not only climbed close to the Swing High level, but the Swing Low marked the bottom of the previous downtrend. This serves as a prime example of the significance of flexibility in the dynamic realm of cryptocurrency trading.
What can we learn from this?
In the world of cryptocurrency trading, Fibonacci retracement levels can be a useful tool to increase your chances of success. However, it's important to understand that they are not foolproof and may not always work as intended. It's possible that the price may reach levels of 50.0% or 61.8% before reversing, or that the market may surge past all Fibonacci levels.
Additionally, the choice of Swing Low and Swing High to use can also be a source of confusion for traders, as everyone has their own biases, chart preferences, and timeframes.
In uncertain market conditions, there is no one correct course of action, and utilizing the Fibonacci retracement tool can sometimes feel like a guessing game. To improve your chances of success, it's crucial to develop your skills and use Fibonacci retracements in conjunction with other tools in your trading toolkit.
Thank you for taking the time to read our post.
We sincerely appreciate your attention and hope that you found it informative and helpful. If you did, we kindly request that you show your support by clicking the "Boost" button and subscribing to our page. Your support helps us create more valuable content for our community.

How to use Fibonacci Retracements for Trading and InvestingIntroduction
The Fibonacci sequence is a series of numbers that starts with 0 and 1, and each subsequent number is the sum of the two preceding numbers. The sequence goes like this: 0, 1, 1, 2, 3, 5, 8, 13, 21, 34, 55, 89, 144, 233, 377, and so on.
The sequence is named after Leonardo of Pisa, an Italian mathematician from the Middle Ages who was also known as Fibonacci. He introduced the sequence to the Western world in his book Liber Abaci, which he wrote in 1202.
However, the sequence had already been discovered by Indian mathematicians several centuries earlier. It was used in ancient Indian mathematics to solve problems related to the breeding of rabbits, which is why the sequence is sometimes called the "rabbit sequence".
The Fibonacci sequence has since become a widely studied and applied concept in mathematics, science, and finance. It is used to model a wide range of natural phenomena, including the growth patterns of plants, the breeding habits of animals, and the structure of galaxies.
In trading and investing, Fibonacci retracements are used to identify potential levels of support and resistance in a market or investment. These levels are based on the percentage of a previous price movement that has been retraced. For example, if a stock price has risen from $50 to $100, and then retraces 50% of that move, the 50% retracement level is considered a potential level of support.
Understanding Fibonacci retracements
To create Fibonacci retracement levels, traders use the high and low points of a previous price movement. For example, if a stock has recently traded from $50 to $100, the high point is $100 and the low point is $50. Traders then draw horizontal lines at various levels between the high and low points, based on the Fibonacci sequence. The most common retracement levels are 38.2%, 50%, and 61.8%, although some traders also use 23.6% and 78.6%.
Calculating Fibonacci retracements is relatively simple. To calculate the 38.2% retracement level, for example, you take the difference between the high and low points and multiply it by 0.382. You then subtract this number from the high point to get the retracement level. For the 50% retracement level, you multiply the difference by 0.5, and for the 61.8% retracement level, you multiply by 0.618.
Using Fibonacci retracements for trading
Fibonacci retracements can be used to identify potential levels of support and resistance in a market. For example, if a stock price is in an uptrend and begins to pull back, traders may look for potential support levels based on Fibonacci retracements. If the price retraces to the 38.2% level, for example, this may be seen as a potential level of support. If the price continues to fall and reaches the 50% or 61.8% level, these levels may also be seen as potential support levels.
Similarly, in a downtrend, traders may use Fibonacci retracements to identify potential resistance levels. If the price is in a downtrend and begins to rally, the 38.2%, 50%, and 61.8% retracement levels may be seen as potential levels of resistance.
Fibonacci retracements can also be used in range-bound markets. If a stock price is moving sideways between a support and resistance level, traders may use Fibonacci retracements to identify potential levels within the range where the price may bounce.
Another way to use Fibonacci retracements for trading is in range-bound markets. In this type of market, prices may move up and down within a specific range, with no clear trend. In these cases, Fibonacci retracements can be used to identify potential areas of support and resistance within the range. Traders can use Fibonacci retracements to identify buy and sell signals at these levels.
It's important to note that Fibonacci retracements should not be used in isolation, as they can produce false signals. To confirm signals generated by Fibonacci retracements, traders often use other technical indicators, such as moving averages, momentum oscillators, or volume indicators. For example, if a trader sees a retracement to a Fibonacci level and the price is also above the 50-day moving average, this could confirm a bullish signal and increase the likelihood of a successful trade.
Using Fibonacci retracements for longer-term investments
In addition to trading, Fibonacci retracements can also be used for investing. Long-term investors can use Fibonacci retracements to identify potential entry and exit points for their investments. For example, if a stock has experienced a significant upward trend, and then pulls back to a Fibonacci level, this could indicate a potential buying opportunity. Conversely, if a stock has reached a resistance level at a Fibonacci retracement level, this could be a signal to sell.
Conclusion
ibonacci retracements are a popular technical analysis tool used by traders and investors to identify potential support and resistance levels. By understanding the Fibonacci sequence and how to calculate and plot retracement levels on a chart, traders and investors can use these levels to make more informed trading and investment decisions. However, it's important to remember that Fibonacci retracements should not be used in isolation and should be used in conjunction with other technical indicators and fundamental analysis. With a thorough understanding of how to use Fibonacci retracements, traders and investors can incorporate this tool into their overall strategy to increase the likelihood of successful trades and investments.

This trading strategy WILL make you TONS of MONEY!Hello, guys!
Today I share a strategy I discovered in 2017 when doing comprehensive Fibonacci research!
Everything in this world starts from 0, so we also use that rule in markets!
Hope you find this educational and stay sharp!!

HOW TO TRADE FIBONACCI RETRACEMENTS: THE SHORT GUIDEHey there, traders. One of the common tools we use for technical analysis are Fib retracements and a lot of you been asking on how to use them properly. Well, today is your lucky day :)
Fibonacci Retracement is a technical analysis tool that is widely used by traders to identify potential levels of support and resistance in financial markets, including forex markets. The tool is based on the mathematical sequence known as the Fibonacci sequence, which is a series of numbers in which each number is the sum of the two preceding ones. The Fibonacci Retracement levels of 0.5 and 0.618 are two of the most important levels used in this tool. In this article, we will discuss how to use these levels for trading forex markets.
Understanding Fibonacci Retracement Levels
Before we dive into the specifics of using the 0.5 and 0.618 levels, let's briefly review the concept of Fibonacci Retracement. The tool is based on the idea that markets tend to retrace a predictable portion of a move, after which they may continue in the same direction or reverse. The retracement levels are calculated using the Fibonacci sequence, and they represent potential levels of support or resistance. The key levels are 0.236, 0.382, 0.5, 0.618, and 0.786.
Using 0.5 and 0.618 Levels for Trading Forex Markets
The 0.5 and 0.618 levels are particularly important because they are close to the midpoint of a move, and they are based on the golden ratio, which is a key number in mathematics and nature. The 0.5 level represents a 50% retracement of a move, while the 0.618 level represents a 61.8% retracement.
To use these levels for trading forex markets, you can follow these steps:
Step 1: Identify a Trend
The first step is to identify a trend in the market. You can do this by analyzing the price action on a chart and looking for a series of higher highs and higher lows in an uptrend, or lower highs and lower lows in a downtrend.
Step 2: Draw Fibonacci Retracement Levels
Once you have identified a trend, you can draw the Fibonacci Retracement levels using a tool provided by your trading platform. You will need to identify the high and low points of the trend, and then draw the retracement levels from the high to the low in an uptrend, or from the low to the high in a downtrend.
Step 3: Watch for Reversals at 0.5 and 0.618 Levels
The 0.5 and 0.618 levels are potential levels of support or resistance, and they can act as turning points in a trend. If the price retraces to one of these levels, you should watch for signs of a reversal, such as a bullish or bearish candlestick pattern, or a divergence in an oscillator indicator or any other personal confirmation for potential entry.
Step 4: Confirm with Other Indicators
To increase the probability of a successful trade, you should confirm the potential reversal with other technical indicators, such as a moving average, a trendline, or a momentum indicator, check with the fundamentals and most importantly confirm that it aligns with your original bias regarding the pair. This will help you to avoid false signals and improve your trading accuracy.
Step 5: Enter the Trade and Set Stop Loss and Take Profit Levels
Since the entry was at the "Golden zone", the exit would be around the 0% Fib level. Yes, you just missed half of the trend, but it's a consistent tool that can help you get that edge over the market that you need.
We hope you found this useful and please let us know on what you would want us to cover next!

📊 Fibonacci Trading: Extension LevelsThe Fibonacci retracement tool plots percentage retracement lines based upon the mathematical relationship within the Fibonacci sequence. These retracement levels provide support and resistance levels that can be used to target price objectives.
Fibonacci Retracements are displayed by first drawing a trend line between two extreme points. A series of six horizontal lines are drawn intersecting the trend line at the Fibonacci levels of 0.0%, 23.6%, 38.2%, 50%, 61.8%, and 100%.
📍 How this indicator works
The percentage retracements identify possible support or resistance areas, 23.6%, 38.2%, 50%, 61.8%, 100%. Applying these percentages to the difference between the high and low price for the period selected creates a set of price objectives.
Depending on the direction of the market, up or down, prices will often retrace a significant portion of the previous trend before resuming the move in the original direction.
These countertrend moves tend to fall into certain parameters, which are often the Fibonacci Retracement levels.
📍 Calculation
Fibonacci numbers are a sequence of numbers in which each successive number is the sum of the two previous numbers:
1, 1, 2, 3, 5, 8, 13, 21, 34, 55, 89, 144, 233, and so on.
📍 What Are Fibonacci Extensions?
Fibonacci extensions are a tool that traders can use to establish profit targets or estimate how far a price may travel after a pullback is finished. Extension levels are also possible areas where the price may reverse.
Drawn as connections to points on a chart, these levels are based on Fibonacci ratios (as percentages). Common Fibonacci extension levels are 61.8%, 100%, 161.8%, 200%, and 261.8%.
🔹 Because Fibonacci ratios are common in everyday life, some traders believe these common ratios may also have significance in the financial markets.
🔹 Fibonacci extensions don't have a formula. Rather, they are drawn at three points on a chart, marking price levels of possible importance.
🔹 The Fibonacci extensions show how far the next price wave could move following a pullback.
🔹 Based on Fibonacci ratios, common Fibonacci extension levels are 61.8%, 100%, 161.8%, 200%, and 261.8%.
🔹 Extension levels signal possible areas of importance, but should not be relied on exclusively.
👤 @AlgoBuddy
📅 Daily Ideas about market update, psychology & indicators
❤️ If you appreciate our work, please like, comment and follow ❤️

How to trade Smart Money Concepts:Smart Money Concepts is a more sophisticated way of trading price action, while taking advantage of where institutions are likely to place their orders. This makes Smart Money Concepts a usable tool whenever you are dealing with hedge funds. What you are about to read is an elaborate tutorial explaining a lot about this trading strategy, including some trading strategies (NOTE: there are many SMC indicators and the one I’ll be using is the one by LuxAlgo since I believe is the most “complete” out of all). Let's start.
1) Order Blocks:
Order Blocks are, in my opinion, the most important feature in SMC trading, as it shows where these institutions are likely to place their orders. In order for an order block to form, look at where the market is consolidating, creating an area of volume price is likely to be attracted to (some order blocks are formed due to imbalances in the market). In this image, you can see how order blocks are formed right after a ranging market has been broken. Because of this unique feature, order blocks are not the same as support/resistance zones.
In order for us to trade using order blocks, look for where an order block has been formed recently, as the longer an order block survives, the weaker it becomes. Buy when the candle that hit the order block closes and set your stop loss under that order block. In this example it worked since the volume wasn’t too high and the order block had formed a few candles before the retest. You can do this for shorts as well (NOTE: the more retests the order block gets, the weaker it becomes)
2) BOS & CHoCH:
Supports and resistances usually apply on Price Action, but they can be applied in Smart Money Concepts as well. The difference is that in Smart Money Concepts, you these supports and resistances when the price breaks through them. However, in many occasions these signals can be false and it’s only a retest of the support/resistance. In order to understand what BOS/CHoCH means, we need to look at the graph:
This is an example I made.
From the graph, a BOS or a Break of Structure is whenever the price breaks the most recent support/resistance in the direction of the trend direction(bullish/bearish). A CHoCH or a Change of Character is whenever the price breaks the most recent support/resistance in the direction opposite of the trend direction. What I mean by this is that in the example I have shown, the trend was bullish until it was not. Normally a bullish trend breaks the resistances instead of the supports, and vice-versa. This is why the name Break of Structure since the price continues going the direction it wants while solving any “issue” in its path. If this “issue” is big enough to break the support/resistance maintaining the trend intact, then it’s known as a Change of Character , since it changes the character of the trend. When this happens, there is a chance for a trend reversal to happen, which is the case for the example I’ve shown. Now I’ll show how to trade BOS/CHoCH in a real graph.
As you can see from the chart, there are a lot of Breakthroughs of Structure and Changes of Character, but this indicator actually shows which of these BOS/CHoCH are major. The trick is that if the indicator shows a BOS/CHoCH marked by a straight line instead of a bunch of lines, this means that it is more accurate. In this example, we ignore the smaller BOS/CHoCH and just look at the 2 important ones. We know they are important because they are marked by a straight line. You buy after the CHoCH/BOS label appears and when the candle that retested the broken resistance/new support closes and the volume doesn’t increase before that (unless the market is ranging after it broke). Same thing with shorts. You short after the BOS/CHoCH label appears when the candle that retested the broken support/new resistance and the volume doesn’t increase from the candle before that.
3) EQH/EQL:
In Price Action , there are chart patterns. One of the most known ones are the double top and the double bottom . Smart Money Concepts refers to these double tops/bottoms as Equal Highs and Equal Lows (EQH/EQL for short). Here’s an example:
As you can see, there is a double top (EQH) which came after an uptrend, meaning that there is a chance that the price will break the necklace (the support line made in the middle of the double tops), causing a change of character, which it did. Due to the nature of double tops and bottoms, this rarely happens. You should use this tool in confluence with other SMC tools like Order Blocks and BOS/CHoCH. Personally, I don’t use them much. I just use them to identify strong supports and resistances, as well as double tops and bottoms. They could also be used to identify trend reversals on major areas of support and resistance.
4) Premium and Discount zones:
Premium and Discount zones are ranges that form in the market when a recent major support and resistance has been established. In this example, you can see when did the premium and discount zones form. The price made a major support and resistance. The equilibrium zone is the 50% line in the Fibonacci Retracement tool if you pay close attention.
This means that price can react off of the Equilibrium zone, and if you pay close attention, you can see it was ranging for a while.
For a trading strategy, wait for the price to reach the Premium or Discount zones, and, if the market's volume decreases, enter a trade and set your take profit at the equilibrium zone. The reason why you should set your take profit at the equilibrium zone is because there is a chance the price rejects off of the equilibrium zone.
5) Fair Value Gaps:
Fair Value Gaps are imbalances that form in the market and can be good support/resistance areas. They usually form when the market is volatile and when a breakout or retest just happened.
In order to identify what a fair value gap is, look for a huge candle body like the one shown in the picture, then, draw a rectangle with its base being at the highest point of the previous candle's upper wick and with its top being the lowest point of the following candle's lower wick. Now, extend the rectangle to the right and now you have a fair value gap.
For a trading strategy, look for the line in the middle which is shown in the fair value gap. This line acts as a support, and the price can bounce off of it. For an entry point, wait for the price to react to the fair value gap, and, if the volume decreases while the reaction is happening, enter.
6) Liquidity Grabs:
Even if you think your trading strategy is amazing, you will always have to deal with scams. No matter how good your trading strategy is, all trading strategies fail to deal with hedge funds and whales. They sometimes act when the price is very close to a support or resistance, and when the people expect a bounce, they place their stop losses under the area of confluence. These hedge funds then act, and end up manipulating the market, forcing the people to panic buy or panic sell, depending on the area of confluence. One major example of market manipulation is in the Crypto Exchange. Trading Crypto is almost like gambling. Liquidity grabs perfectly reference the scam. You can spot them if, on a ranging market, there is a sudden increase or decrease in price. Always pay attention to traps like the ones in these examples shown below:
For a trading strategy, wait for the scam pump or dump to stagnate and then enter your trade in the opposite direction that the candle was going to.
In conclusion, Smart Money Concepts is a fascinating trading strategy for me, and it could be for you too. There are many aspects of it, and it is another way of trading Price Action, which itself is already fantastic.
This tutorial took me 3 hours to make, so please make sure to heart and comment your opinion on this. Thank you for reading through all of this.

FLSY - Anatomy of a "Good" tradeHi All,
This is just to share on how I would approach a trade (as a trader).
1. Look for signs that the stock is forming a bottom (rounded bottom, inverted Head and Shoulders, Adam and Eve),
rising above 200 day MA, Golden Cross etc.
2. Check out its longer term charts (ie weekly and monthly) as you will likely see a clearer picture of it's direction.
3. Wait for some triggers (eg breaking above neckline especially on strong volume).
FLSY is a good example and had presented several good opportunities for several short term trades recently (could be held for longer term if one had entered earlier around 12.36 (1st Entry in chart) and didn't get stopped out.
1) On 2nd Feb (Initial Breakup), it gapped and broke up above this neckline (as well as it's 200 day MA), everything looks good except volume was just above average.
Well, this initial break up failed! Yes, it happens more often than we cared for, especially during the earlier phases of the trend, hence a conservative trader would prefer to wait for a pullback and long if the neckline proved to be a support.
2) on 13 Feb (1st Entry), FSLY once again gapped above the neckline and 200 day MA, but this time the volume was HUGE. However, this was prior to earnings announcements (2 days later, AMC). There is a possibility that earnings beat had been leaked, so if one decide to enter this trade, then it would probably be wise trade small.
3) on 16 Feb (2nd Entry), the day after earnings, which beat expectations (surprise surprise...LOL), many traders will FOMO into the stock especially as it rose above the previous candle's high around 14.20. This turned out to be a very profitabe trade (intraday).
Next day however, it formed a "Harami" candlestick (aka "inside bar"), showing indecision at this point. I would raise the stop to 15.30, slightly just under this "Harami" candlestick (which is already a 11% SL from its high @ 17.18). Those with a larger risk appetite could raise the stop to entry price (ie 14.20), allowing for larger volatility which could stop one out prematurely but be prepared to give back all profits if wrong.
4) FSLY had a steep pullback after all (due to poor market sentiment during the whole month of Feb) and found support only at 61.8% of it's large AB up swing. This was also within a prior "Resistance" but turned "Support" zone. It began to form small sideway candles (a signal to long if it starts to break above this "consolidation" range)
5) We had a Long trigger again last Friday (3rd Entry) as the stock started to rise decisvely above the consolidation high @ 14.20.
It turned out to be a large candle day, hence I would place initial stop loss just below this large candle (ie 13.55, a 5% initial SL).
There is a good chance this stop will not get hit (although nothing is guaranteed LOL).
Uptrend is underway for FSLY (above 200 day MA, with the shorter MAs (20 and 50) both rising. However, it could still experience large swings along the way and one has to manage the trade and raise the stops from time to time to protect profits. Just because one is stopped out does not mean the stock is spent. Sometimes it could be just periods of consolidation (short or long periods). Keep it on your watchlist as long as the stock has not shown signs of bearishness on a higher timeframe, set alerts for the next trigger.
Disclaimer: Just my 2 cents and not a trade advice. Kindly do your own due diligence and trade according to your own risk tolerance and don't forget that money management is important! Take care and Good Luck!

S&P 500 ETF Multi-FractalTheory of multi-universe rhymes with idea that entangled market can go either way and we're not quite sure which. Since nobody can predict market in the future, we'd ignore news and stick with markets distinctive reaction to reports and news. Positive and Negative fundamentals pushes market to their causing path anyway, we just need to know which extent the targets - endpoints of me. So It's about points of reversals that really matter and are self-evident and very distinctive for any observer .
The term " observer " has second meaning which is also backbone of my own perception of %/TIME based collective consciousness observing the market causing this "matrix glitch" and proves that market has it's own path.
Read role of the term observer
Market's reaction on fundamentals already has been captured in history, so instead of using Elliott Waves why not use the interconnected market patterns itself DESPITE OF different scales.
Black fractal path feels more natural for my subjective perception.
White fractal might play out UNLESS price crosses pattern's violet uptrend line, which will cause at least parts of black pattern to play out, simply because it can cross earlier.
Fractal Scales:
Decade:
/2:
CloseUp FROM DECLINE:
Grateful to @jdehorty for this calendar which I've just used to align events into my fractals such way.
Events can cause HL points of fractal iside future bigger cycled fractal.
Along side with indicators it's always good to look back into making sense out of consequent patterns and their collective relationship with zeroed in and zoomed out" versions of the entity itself.
IF the slope of the fall would be steeper:

Fibonacci RetracementFibonacci retracement is a technical analysis tool to identify potential support and resistance levels in financial markets. The tool is based on the Fibonacci series, a mathematical sequence of numbers where each is the sum of the previous two numbers. The origin of the
Fibonacci sequence goes back to ancient India and the study of Sanskrit prosody. However, the series is named after Italian mathematician Leonardo Fibonacci, who introduced the sequence to the West in his book Liber Abaci, published in 1202. In contrast, the
Fibonacci retracement was first used in financial markets in the 1930s. . Ralph Nelson Elliott, the famous trader, developed the Elliott wave theory. Elliott believed that market movements can be divided into waves, each with a characteristic pattern.
Elliott noticed that certain retracement levels based on the Fibonacci sequence tended to act as support or resistance levels in the market. In particular, he called the levels 38.2%, 50%, and 61.8% the most important.
Since then, the Fibonacci retracement has become widely used in technical analysis and is included in many trading platforms and charting programs. Traders use it to identify potential support and resistance levels and determine trades' entry and exit points.
Fibonacci retracement is a popular tool among technical analysts and traders and has many uses in financial markets. Here are some common uses of Fibonacci retracement:
Identifying potential support and resistance levels: The 38.2%, 50%, and 61.8% levels are often used as potential support and resistance levels in the market.
When a price trend occurs, traders often consider these levels potential turning points.
Identifying Entry and Exit Points: Traders often use Fibonacci retracement levels to identify potential entry and exit points for trades. For example, a trader can enter a long position on a stock when the price returns to the 50% level after a previous uptrend and then place a stop loss just below the 61.8% level.
Trend Direction Confirmation: By analyzing Fibonacci retracement levels, traders can confirm the price trend direction. If the tracking levels align with the trend's direction, this can be a sign that the trend is likely to continue.
Giving Price Targets: Fibonacci retracement can also be used to identify potential price targets for a trend. Traders often look for the 161.8% and 261.8% levels as possible targets for the trend when the price crosses the 100% retracement level.
Summary with other technical analysis tools: Traders often use Fibonacci retracement levels in conjunction with other technical analysis tools, such as moving averages or trend lines, to strengthen trading signals and increase the probability of a successful trade.
Fibonacci retracement is a widely used tool with advantages and disadvantages in technical analysis. Here are some of the main advantages and disadvantages of using Fibonacci retracement:
Advantages:
1. Identifies potential support and resistance levels: Fibonacci retracement can be used to identify potential support and resistance levels, which is important for traders to identify a potential reversal. . . points in the price trend.
2. Ease of use: Fibonacci retracement is easy to use and can be applied to many financial instruments. It is readily available in most mapping software and trading platforms. It can be customized to meet the needs of individual traders.
3. Widely used: Fibonacci retracement is widely used in technical analysis and is well-known among traders and analysts. This facilitates interpretation and application in different market conditions.
Cons:
1. Not always accurate: Fibonacci retracement is imperfect, and its accuracy may vary depending on the market area and period analyzed. Traders should use it with other technical analysis tools to confirm signals and reduce the risk of false signals.
2. Subjective: Like many technical analysis tools, Fibonacci retracement is quite subjective, and traders can interpret levels differently. This can lead to different business decisions and results.
3. Can be overused: Some traders may rely too much on the Fibonacci retracement method and use it as the basis for their trading decisions. This can be risky because only some tools can provide all the information needed for successful trading. Investors should use the Fibonacci retracement as part of a broader trading strategy that includes multiple indicators and factors.
There are several important factors to consider when using Fibonacci retracement:
1. Choosing the appropriate pivot points: To use the Fibonacci retracement, traders must identify the appropriate swing points to calculate the level. These swing points should be significant highs and lows in the price trend and should be selected based on the analyzed time frame.
2. Understanding Levels: Traders should understand Fibonacci-rich levels and what they represent. The 38.2%, 50%, and 61.8% levels are the most commonly used and considered potential support and resistance levels.
3. Using Fibonacci retracement with other indicators: Investors should use Fibonacci retracement with other technical analysis tools, such as moving averages or trend lines, to strengthen signals and increase the probability of a successful trade.
4. Adaptation to market conditions: The accuracy of Fibonacci retracement levels can vary according to the specific market area and the period under analysis. Traders must be prepared to adjust levels based on changing market conditions and adjust their trading strategy accordingly.
5. Risk Management: As with any trading strategy, traders should properly manage their risks using the Fibonacci retracement. This may include setting stop orders at appropriate levels or limiting position sizes to minimize the impact of potential losses.
Fibonacci retracements are widely used in technical analysis. Still, there are also some alternative tools that traders can use to analyze the market.
Moving Averages: Moving averages are commonly used technical analysis tools that help traders identify trends and potential entry and exit points.
Bollinger Bands: Bollinger Bands is a technical indicator that helps traders identify potential support and resistance levels.
Ichimoku Cloud: The Ichimoku Cloud is a technical indicator that helps traders identify trends, momentum, and potential support and resistance levels.
Elliott Wave Theory: Elliott Wave Theory is a technical analysis tool that helps traders identify trends and potential entry and exit points.
It is based on the idea that the market moves in a series of waves and can be used on different timeframes.
Thanks for reading this.
What do you think the pros and cons are?
Do you think I missed something?
Let us know your ideas.
Good luck.
How to Spot the Confluence Zone | Pro Fibonacci Technique
If you are struggling with the identification of accurate trading entries,
you definitely should try confluence zones.
Note: there are hundreds of variations of confluence elements.
In this example, we will discuss trend lines and fibonnachi.
❗️To identify a confluence zone, the price must follow a trend line
(it should match higher lows if the market is bullish ;
it should match lower highs if the market is bearish ).
Once the trend line is confirmed by at least two touches and consequent reactions,
you can look for a confluence zone.
1️⃣Project a trend line and identify the next POTENTIAL touchpoint of the market with a trend line .
2️⃣Take the last impulse in the direction of the trend.
Draw a fib retracement based on it
(swing low to swing high in case if the market is bullish ,
swing high to swing low in case if the market is bearish ).
3️⃣Take the previous impulse (it must be in the same direction as the initial one).
Draw a fib retracement based on it.
4️⃣Look for a match of retracement levels of the last two impulses and a projected trend line .
In case if two retracement fib.levels & trend line match, you found a confluence point.
5️⃣ Apply it as a safe entry point.
You will get a perfect trend following opportunity.
Let me know, traders, what do you want to learn in the next educational post?

TECHNICAL ANALYSIS is the new KING ok here me out.
i'll go straight to point
this message is for the newbies (oldies gonna hate)
what is pure Minimalist Technical Analysis Trader ( MTAT : i just made this up)
-it is when u leave out all so-called indicators and focus on the chart
-some of these indis are: MACD, RSI, ATR, STOCHT....
-it's when u leave out the FUNDAMENTAL analysis and focus on the chart pattern
- i'm talking here about financial news and garbage flash news
- didn't u sometimes realize that a news come out, but the dollar act contrary to the news it-self?
HOW TO APPLY this MTAT ?
let's be practical, but first u need to watch so many charts until ur eyes pops out (it's a prerequisite).
1- always pick a 4h-time frame chart
2- always brush ur teeth before bed time
3- always look for a bullish pair to trade (this is essential for the plan to succeed)
4- after identifying the bullish pair, start looking for SUpport & Resistance...but never make the chart too complicated, u really need like 2-4 lines drawn only
5- after u draw the S&R lines, look for retracements (the pair is going down slightly)
6- use the FIBONACCI drawing tool and draw from the lowest to highest point (before the retracement)
7- it's best to focus on the 61.8% line
8- look for a confirmation candle:
a- a red Bar, which the low point of it touched (crossed) the 61.8% Fib line
b- followed by a green bar which closed ABOVE THE fib 61.8% line
c- place ur buy trade when the green candle closes
9- how to set your target:
a- use the (-61.8% or -100%) FIb levels
or
b- use the Resistance line u drawn previously
now the question is, do u really need MACD or RSI or STOCH?
of course NO, if you google it, u'll know that these reflects previous price actions? so why use it for FUTURE price actions?
what to do when big news are coming out?
IT WILL ACT ACCORDINGLY THE PREVIOUSLY SET CHART PATTERN...this will never fail you
DO YOU PLACE STOP ORDERS?
NEVER, never put pre-set stop orders,
you should be active on ur screen and wait for the price to fall to the price u set as a stoploss, AND CLOSE TRADE MANUALLY
WHY?, because when we have big news, we have volatility the pair will go up and down so hard to close all stoploss orders
then it will continue to obey the technical chart pattern as a fukn slave!
let's practice:
use the FIB Ret tool:
identify the red and green candle:
place your buy order:
et voila....
#STOP_BEING_POOR

Fibonacci Retracement Levels In Forex TradingBoth novice and seasoned traders use Fibonacci levels as one of the most common and universal strategies when trading forex and other markets. It is a well-known fact that market prices incline toward levels where the bulk of market orders are gathered. Such levels can be found and predicted using a variety of ways.
Systems for trading are built on a variety of levels. Since traders first realized that the price fluctuations of some assets frequently followed the Fibonacci number sequence, the Fibonacci levels have been employed in trading. The standard Tradingview trading platform, which is currently the most well-known and in demand, includes the tool because of how useful it is.
Leonardo Fibonacci, who was born in ancient Italy, discovered a straightforward numerical sequence that is utilized globally and is consistent with a wide range of natural occurrences.
The order is as follows: 0 followed by 1, then 1 (0+1), then 2 (1+1), then 3 (1+2), followed by 5, then 8 (3+5), etc. It appears that the Fibonacci sequence is the sum of the two numbers before it.
An intriguing ratio may be calculated using these numbers: 0.618 is the result of dividing the first by the second (regardless of which of the numbers in the sequence are taken). And you get 0.382 when you split the numbers by one. The "golden ratio" is this set of fractions, and it appears frequently in nature, a striking example is a spiral like the seeds in a sunflower.
The following are the trading-related Fibonacci correction levels: 0.236, 0.382, 0.500, 0.618, and 0.764.
Levels of expansion are 0; 0.382; 0.618; 1.000; 1.382; and 1.618. It makes no sense for traders to manually calculate any of these figures, which are all calculated from the sequence. The key is to comprehend how they operate, what they are used for, what data they offer, and how to make effective use of them when trading.
Special indicators that automatically draw lines on the chart or symbols in the trading platform are used while trading with Fibonacci levels. Retracement levels can be utilized for a number of purposes, such as support and resistance, to start trades, and to set stop orders. The usage of extension levels by traders for take-profit placement. Based on swings, or candles with at least two upper highs or upper lows on the left and right, Fibonacci levels can be applied to a chart. Additionally, bear in mind that Fibonacci levels for forex are a trending technique and are not applied during periods of consolidation. When the trend is upward, the price tends to retreat from Fibonacci-based resistance levels; the opposite is true for downtrends and support.
Fibonacci Levels in Forex: How to Use Them
Almost all charting applications contain Fibonacci retracement levels. Fibonacci lines are regarded as the most flexible and understandable option, however others also use fan lines, arcs, and time periods as typical tools.
What do you need to know about Fibonacci numbers in order to trade?
Values are calculated as 23.6, 38.2, 50.0, 61.8, and 76.4% on a scale of 0 to 100. The primary signal for foreseeing likely future price fluctuations is these ratios (prices often bounce back from levels). The indicator shows levels on the price chart and allows forecasting of future price changes.If you want to manually trade using the price chart or the software, you can select to display correction levels. To do this, drag the cursor from the bottom point of the trend to the top point. There will be five horizontal lines that display 0, 38.2, 50, 61.8, and 100% (an additional line showing 23.6% can be added).
Depending on whether Fibonacci is trading above or below the lines, the lines can be utilized as support or resistance levels. The levels activate more frequently as the time span becomes longer. Finding a downward trend, appropriately stretching the Fibonacci lines, waiting for confirmation, and placing an order are the essential duties of a trader. Numerous strategies for using numerical series in trading exist.
How Fibonacci Levels Work And How To Use Them In Trading
Trading professionals can examine the changes in asset values by using Fibonacci numbers that are displayed as lines on the chart. As a result, resistance/support levels are established, and the degree of a trend movement's already-started corrective is examined.
The price typically follows the guidelines of key levels on the Fibonacci lines. Therefore, there is a strong likelihood of a price reversal at the level, for instance, if the price crosses the line. Fibonacci retracement levels are particularly helpful for discovering pullback levels, for establishing the conclusion of a pullback, and for the continuation of price movement along with the trend because pullbacks are a natural part of every trend.
The key correction levels are created by the interrelations between a trend and a correction shown by Fibonacci levels, which have recovery probabilities of 38%, 50%, and 62%. It only takes placing a grid over critical spots to see that pivotal price levels frequently cross Fibonacci percentage lines. Fibonacci levels and graphical patterns can be used to coincidentally determine market entrance and exit points. Opening profitable trading positions after a collapse or rebound from a level is beneficial.
Trading professionals frequently employ Fibonacci lines to place Stop-Loss and Take-Profit orders. To avoid being caught by an unintentional pullback, it is preferable to position the Stop-Loss order above the levels (for the recovery from which the trader is counting). Take-Profit levels are based on Fibonacci extension.Remember that on a price chart, the support/resistance areas that coincide with the Fibonacci net levels are viewed as further support for the lines' significance.
This instrument is the foundation of many trading techniques. Beginners should be aware that there is no definitive interpretation of the Fibonacci technique; it is merely a point of reference. Trading systems frequently incorporate Fibonacci levels with other technical analysis tools because this technique can occasionally fail to corroborate the signals.
Importance Of Different Fibonacci Levels
Expert traders claim that not every Fibonacci level behaves the same way on a price chart. Before using the instrument for trading, some regularities should be studied.
Fibonacci levels and their importance in trading:
23.6 - weak, a clear confirmation is required to use it in trading.
38.2 - an important level, the price of the asset bounces from it for further consolidation.
50 is intermediate in importance between the two previous levels and gives a high probability of trigger.
61.8 - strong, like 38.2.
76.4 - 80.9 is a strong level as well.
The likelihood of a profitable trade is quite high if we consider the strength of the levels, trade in line with the trend, weed out erroneous signals using a straightforward extra indicator, and avoid using low time frames. Additionally, it's critical to remember risk management and trading psychology's fundamental principles.
Advice for using 38%, 50%, and 62% levels effectively
Stretched between the trend's minimum and maximum, a grid is drawn on the graph. On the charts, three to four separate time frames with longer value movements can be displayed in various colors. Numerous Fibonacci levels will be displayed on the graph, allowing for analysis. Usually several of them exactly coincide on various time scales, therefore they are regarded as significant support/resistance levels.
These three can be utilized to enter positions and exit open ones because fibonacci numbers have potentially important levels. These price retreat levels by themselves are not what drives price movement; if this line doesn't have the appropriate support, it will simply go to the next. More accurate signals are produced by combining Fibonacci with other tools (such as Moving Averages, trading channels, reversal patterns, etc.).
A significant resistance/support level is 62%. When it is attained, the price frequently starts to vary erratically. When the price surges past the 62% level and moves on to the 70–75% retracement level (before returning to the 62% level), you can place an order. When two to three further crossover signals are received, trades can be initiated from deep retracement levels. It is preferable to avoid entering if there are no cross confirmations. It's also a good idea to keep in mind that once the correctional movement reaches the 62% pullback level, it may go on to reach 100% in the chosen time frame and stop the trend.
Fibonacci Levels: How to Use Them in Forex Trading
Fibonacci levels can be used relatively easily. The most crucial levels in forex trading are 23.6% and 38.2%, 61.8% and 76.4%. They are used to identify price pullbacks; when one appears on the chart, one should wait for a favorable price before joining the impulse (enter the movement at the moment of a pullback).
When there is a significant market movement, the asset's price can drop by up to 23.6%, 38.2%, or even 50%. These ranges are regarded as ideal. Price increases of 61.8% or more may signal the beginning of a trend reversal.
The Fibonacci levels should be drawn correctly:
-Finding the price impulse.
-Plotting the grid on the chart.
-The expectation of a pullback to 23.6% or 38.2% or 50% to enter the market.
-When there is no pullback, the price keeps moving, updating the lows/maximums, it is worth pulling over the grid based on new local extrema.
-In this case, it is important not so much to determine the levels as to understand whether the current price movement is a correction concerning the previous one or the beginning of a new trend.
When Fibonacci Correction Levels Do Not Work
Fibonacci levels are not 100% reliable signals; they are more like rough guidelines that give information about the movement that is likely to occur. Fibonacci levels can also be broken occasionally, just like support/resistance levels can. There are many exceptions to the rules, therefore it is advisable to check the signals with additional tools and to take the maximum precautions when opening any position.
The levels need to be carefully worked, refined, and filtered on a regular basis. Sometimes levels might be crossed, and the bounce occurs at 61.8 instead of 50%; other times, the price skips levels and views essential ones as weak and unimportant ones as important. Because of all these features, it is important to be able to combine different tools in a strategy and constantly gain experience trading with the selected tools.
Conclusion
The suggested strategy broadens the potential uses for trading with Fibonacci levels. You can use it to your advantage so that practically any corrective movement—not just ones that conclude at 38.2% or 61.8%—will be beneficial. You must be able to accept what the market offers you since it doesn't always move that well.

How to double your small ($250) trading account trading Bitcoin How to Double your Small ($250) Trading Account Trading Bitcoin
I started a degen account with $250 and almost doubled it in 4 days making about 6 trades. This strategy is not Financial advice and I'm only illustrating what I have learnt trading this way. This is the first video in the series and I'll be continuing the series , updating you on progress, winners, losses, my trading journal and some live trading, so make sure to Sub, like comment and share.
I show you how I entered my current trade, where I am looking to take profits and show you my pnl on Bybit.
Not Financial Advice. DYOR. Papertrade before trading with real money.
Hope you have a profitable trading day!
Shawn

Are Retracements Stair-Stepping Toward a Breakout?The S&P 500 has frustrated traders for months as a tightening range punishes both bulls and bears.
Picking levels in a market like this can be a huge challenge because prices keep revisiting the same spots as they narrow. It’s a bit like trench warfare, with armies battling futilely for weeks over a few yards of territory.
But one basic technique has provided some clarity to help navigate the back-and-forth: Fibonacci retracements.
Notice how SPX surged from below 3500 on October 13 toward 4100 by early December. The rally stalled around the 200-day simple moving average (SMA). Sellers quickly returned, and for a while it looked the bears were in control again.
But then the index held 3800: a low from May 2022 and a “nice round number.” The level had other relevance because it represented almost exactly a 50 percent retracement of the preceding rally. (See the yellow markings.)
SPX sat for the next two weeks before returning to the 200-day SMA. The bears tried another attack, but couldn’t get prices to close under 3890.
This matched the December 21 high, but it was yet another 50 percent retracement. (Marked in white.)
Here are two potential lessons for traders:
First, retracements of current moves can be a simple way to find levels and manage risk. This is especially true when many price points and indicators compete for your attention.
Second, this kind of Fibonacci analysis may suggest the bulls are taking charge. After all, if prices rallied, retraced and continued higher two times in a row, it could be trying to tell us that a new uptrend is taking shape. Are we stair-stepping toward a breakout?
TradeStation has, for decades, advanced the trading industry, providing access to stocks, options, futures and cryptocurrencies. See our Overview for more.
Important Information
TradeStation Securities, Inc., TradeStation Crypto, Inc., and TradeStation Technologies, Inc. are each wholly owned subsidiaries of TradeStation Group, Inc., all operating, and providing products and services, under the TradeStation brand and trademark. TradeStation Crypto, Inc. offers to self-directed investors and traders cryptocurrency brokerage services. It is neither licensed with the SEC or the CFTC nor is it a Member of NFA. When applying for, or purchasing, accounts, subscriptions, products, and services, it is important that you know which company you will be dealing with. Please click here for further important information explaining what this means.
This content is for informational and educational purposes only. This is not a recommendation regarding any investment or investment strategy. Any opinions expressed herein are those of the author and do not represent the views or opinions of TradeStation or any of its affiliates.
Investing involves risks. Past performance, whether actual or indicated by historical tests of strategies, is no guarantee of future performance or success. There is a possibility that you may sustain a loss equal to or greater than your entire investment regardless of which asset class you trade (equities, options, futures, or digital assets); therefore, you should not invest or risk money that you cannot afford to lose. Before trading any asset class, first read the relevant risk disclosure statements on the Important Documents page, found here: www.tradestation.com .

✅ 4 Methods to Confirm EntriesYou should make sure that your reward is bigger than your risk.
It is up to you what your optimal risk to reward should be – ideally you should have a risk to reward of 1:2 or 1:3.
✔️Trendline Reversal & Break
The trader should constantly monitor both the support and resistance trendlines and redraw them as the old ones break and new ones form.
When an intersection of the projections happens, one of the trendlines must be broken and the other will most likely continue to hold the price.
We trade in the direction of the trendline that remained unbroken with potential entries at the trendline breaks.
✔️Support & Resistance
Look at the price chart and observe the support and resistance levels that you have drawn on the charts.
You will look to place sell orders at the resistance levels and buy orders at the support levels.
Stop loss below the support level or above the resistance level depending the call you’re on.
✔️Fibonacci Retracement
Fibonacci retracement levels connect any two points that the trader views as relevant, typically a high point and a low point.
The percentage levels provided are areas where the price could stall or reverse. These levels should not be relied on exclusively,
so it is dangerous to assume that the price will reverse after hitting a specific Fibonacci level.
✔️Consolidations
A price consolidation is a period when the price is moving sideways without any significant advancement in the upward or downward direction. A price consolidation can take any form.
It could be a rectangular pattern (often called a range), any of the different types of triangle patterns, a rising or falling wedge, a pennant, or a flag.
Depending the pattern that takes place, you’re gonna look for entries and stop loss bellow pattern’s invalidation.
👤 @AlgoBuddy
📅 Daily Ideas about market update, psychology & indicators
❤️ If you appreciate our work, please like, comment and follow ❤️
