Long Bullish WaveRetested 161% fibo extension
So, we can wait for Sell
wait for closing the current Candle
Fibonacci

ARE YOU LOSING IN THE MARKET? THEN READ BELOW Losing is inevitable. To be a successful trader you must truly truly understand this. Look back at my analysis. I have both winners and losers and I absolutely love them both.
Why do i love my losses? Because I don’t see them as losses, I see them as lessons. Every set up that doesn’t go as I anticipated is crucial information that I must study and this is truly what has made me good technically speaking. I learn from my mistakes and I don’t repeat them.
Second most important fact is Risk Management which ALLOWS me to learn from my losses. If my trade goes bad and I lose 1% or 2% on a trade, I don’t feel bad , I simply move on to the next trade and take the information the market has given me and STUDY it. The moment I risk more than 2% and the trades goes bad is the moment my mental being shifts, the emotions start rolling in. I want to close but the trade is valid, I get scared, question why I didn’t risk less etc and I’m sure you can all relate to this. Once this happens, it’s very hard to study the losing trade because you now associate it with pain and you avoid looking back at it at all costs.
KEY TAKEAWAYS:
1. To succeed you must fail, to succeed after failure, you must gain experience from your failures.
2. In order to gain experience form your failures, you must manage your risk, by managing your risk, you are controlling your emotions, by controlling your emotions you are allowing yourself to think analytically.
3. Trading is game of probabilities not guarantees. Every trade only has a 50% chance of winning.

EOS : Death cross and phase 2 of break out strategyHello fellas, Let's discuss this beautiful EOS. Let's get to the point.
I use bitfinex exchange to analyze current moves. From the chart that I've shared, there is a white support trend line that has already held the price since December 7th, 2019 and then it has broken out since August 14th, 2019. And since this break out, the price has never retest again the white trend line as confirmed resistance. I believe the last 11 days rally is a part of phase 2 break out strategy which will end up at the white trend line as confirmed resistance. In other side of fibonacci view, we can see the golden pocket zone is moving align with this previous support trend line. and when the price touch this golden pocket zone, I will be very interested to enter short position for EOS. My targeted area for take profit will be on previous swing low which is around $ 3.2 will produce a good rr. The risk to reward is pretty affordable with sacrificing 2% loss to catch the significant 23% profit.
Thank you

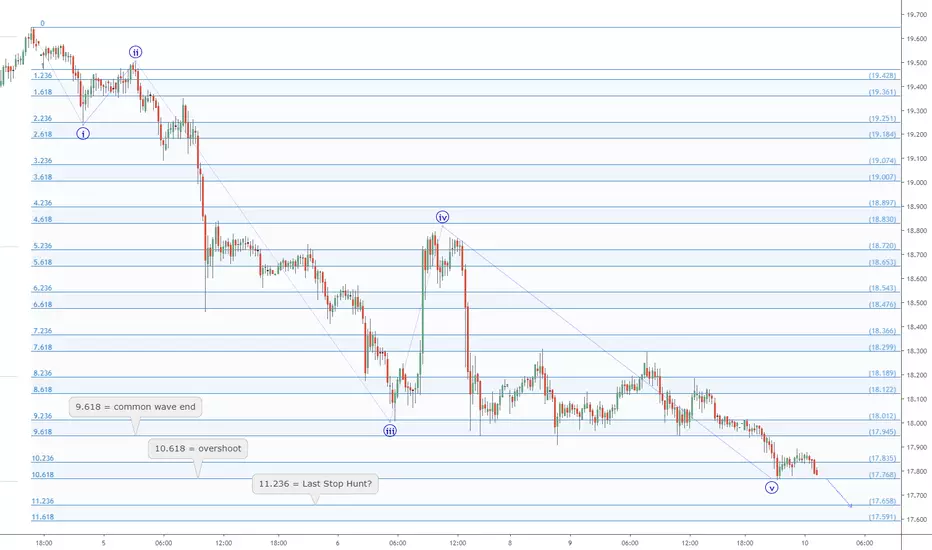
The "Pulse" of an asset times Fibonacci: Silver Retrace RhythmSilver shone bright after Gold.
Now it is retracing just as Bold.
The Rhythm is clear,
Wave End may be near.
Ordered Chaos
every Wave is born from Impulse, like a Pebble into Water.
every Pebble bears its own Ripples, gilded of Ratio Golden.
every Ripple behaves as its forerunner, setting the Pulse.
each line Gains its Gravity.
each line Tried and Tested.
each line Poised to Reflect.
every Asset Class behaves this way.
every Time Frame displays its ripples.
every Brain Chord rings these rhythms.
He who Understands will be Humble.
He who Grasps will observe the Order.
He who Ignores will behold only Chaos.
Ordered Chaos
.
.
want to Learn a little More?
can you Spend a few Moments?
click the Links under Related.
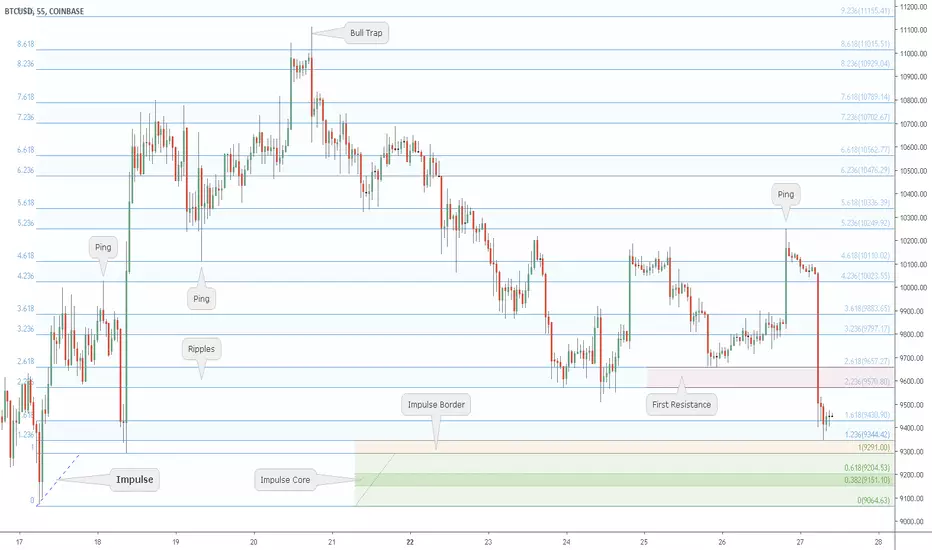
The "Pulse" of an asset times Fibonacci: BTC missed Checkpoint ?Part of my ongoing collection of Impulse examples.
This sequence has "Pinged" each line except the 2.618.
The sharp drop from Band 4 is likely to see on more leg
.
Ordered Chaos
every Wave is born from Impulse, like a Pebble into Water.
every Pebble bears its own Ripples, gilded of Ratio Golden.
every Ripple behaves as its forerunner, setting the Pulse.
each line Gains its Gravity.
each line Tried and Tested.
each line Poised to Reflect.
every Asset Class behaves this way.
every Time Frame displays its ripples.
every Brain Chord rings these rhythms.
He who Understands will be Humble.
He who Grasps will observe the Order.
He who Ignores will behold only Chaos.
Ordered Chaos
.
.
.
want to Learn a little More?
can you Spend a few Moments?
click the Links under Related.
4 hours chart : trend line, MA and the histogram on MACDLooking at the 4 hours chart, which is moving align with my yesterday's analysis about bitcoin.
Current condition shows that the price is showing a rejection toward the previous support that is now become resistance as well. Beside that, I've seen the rejection when the price was trying to surpassed the MA 200 on 4 hours chart.
The RSI on 4 hours chart is trending at under the 50 level which indicates the price is entering the bearish zone right now . The MACD histogram was once again ticking down to pass the previous wave low.
So far, current price is moving align with my yesterday's bias and I will give you more details update when the weekly candle close.
Thank you

The Precision, 5th truncated wave and Next possible stopHello all, It has been a very volatile day in the market, A huge moves has occured in today's market and I saw a lot of drama occur. But, once again our yesterday's scenario is going really well with 5th truncated wave at the upper line of the triangle.
Back to the 4 hours chart which is becoming the best benchmark for swing traders. in this specific period, you can see the yellow trend line which become the broken resistance previously and until now, I haven't seen any proper retest toward this resistance again that is now become support. Usually, after a major trend occur to the upside, we will try to find a support for possible place to catch the reversal. I use the fibonacci levels to find supports and in this case, I really don't think that the golden pocket on fibonacci retracement can hold the price considering the fact that bitcoin is moving inside a huge descending triangle.
In my opinion, The price should touch again the major support on around $9400-$9000 region where this horizontal support will find an alignment with the yellow line which now become a support trend line. and if this breaks, you will see a very very nasty drop from bitcoin.
Right now, I want to stay idle and watch the wild volatility that occurs in the market.

Elliot wave count, 5th wave could be truncated : short term biasHello fellas, once again I provide you my analysis about bitcoin. without further chit chat, let's get to the point.
Here it is my detailed elliot wave count on bitcoin. Right after the call of bearish rising wedge or we can call it a leading first wave diagonal, we've seen a really huge up trend push form the bulls. I will label this moves as the 3rd wave going up on bitcoin on my short term view which has just finished, This means that current price is at the 4th wave phase which is the correction wave for wave 3. Based on elliot waves rules and guideline, we can easily deduce that the 4th wave could end up on fibonacci levels whether it is on 23.6 , 38.2 , 0.5 or the golden pocket as long as the price doesn't drop more than a wick of the 1st wave territory. The wave 4 trade is usually the most tricky wave that occur between the others wave so we have to be cautious.
yes, there is a possible moves of one more waves up which will be labeled as the wave 5. But, I want you all to remember that even the wave 5 can be truncated which can make a lower high comparing to the wave 3 and considering the current price is trending just below the upper line of the huge channel (green dotted line) this truncated wave 5 could occur too.
As of now, I am still on my long position and I use the white support trend line on smaller timeframe as the guideline. If the price breaks this support trend line, I will switch my long position into short and try to catch the wave 4. But, If this trend line can hold, I do believe that the price will touch at least the previous high.

Elliot wave perspective on BTCGood afternoon all of my fellas, How are you doing? did you catch the last awesome bulls? I hope you are doing so. Let's get to the point of today's bitcoin analysis!
In this podcast, I will cover the daily movement, intra day and scalp opportunity on bitcoin. Based on this chart, I show you 2 support and upper line movement the green dotted one and the green line. The different between this 2 line is based on how I connect the price. the green line I use the wick to wick connecting method which doesn't exclude the bear trap and bull trap region. the green dotted line, I use the body to body connecting method which exclude the bull trap and bear trap region. Based on those 2 line, It is clear that bitcoin still has the room to grow to the upside of the upper line. And based on my opinion, it can be at the golden pocket region around $11100 region which in fact has a confluence with the upper line of the triangle.
And for smaller time frame view, I will give you an explanation on update section.

Room to grow, support and resistance for bitcoinFor all of you who has opened a long position since my last signal should be in an amazing profit by now. That's why congratulation for all of you my baby. here we come with another view on bitcoin based on daily chart.
First, the last volatility is just amazing and if you have seen my previous analysis about bitcoin, you should have opened long position since $9500 region. Right now, the price is trending inside the huge descending triangle and I clearly see the potential of the price to fill the empty room toward the upper line of the triangle. but, looking at the size of current daily chart, it has a huge possibility for bitcoin to have a spike toward the golden pocket zone or even at the 78.6% fib retracement region before another drop to the downside.
Looking at the MACD indicator right now, the histogram has a significant ticking up to the upside and to the positive side. if this condition can hold until the daily candle close, I firmly believe that the price will fill the empty room toward the upper line of the triangle.
Currently the price has already claimed back the dynamic support on daily chart and this is a pretty good sign for me.
Thank you I will keep on updating about bitcoin's current moves.

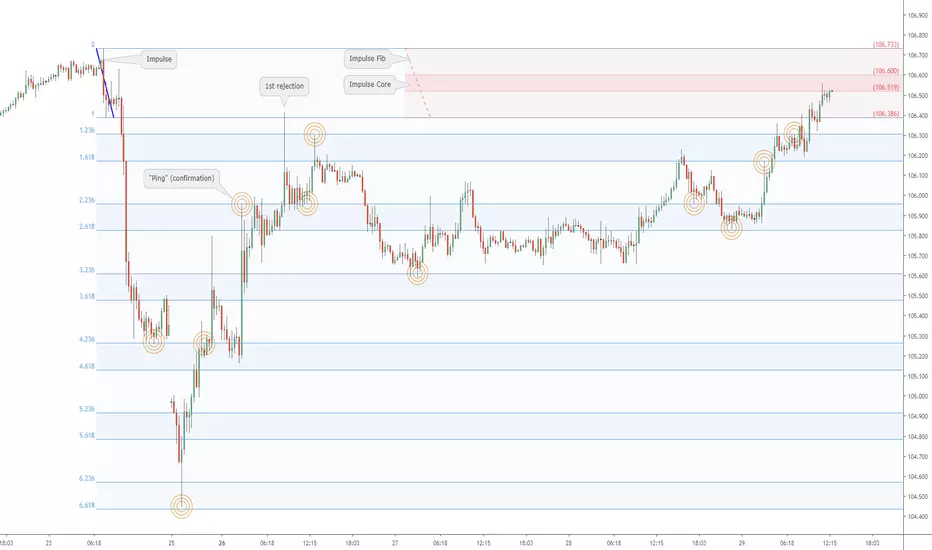
The "Pulse" of an asset times Fibonacci: USDJPY at Impulse ReduxUJ as we know is a read on risk sentiment.
Currently swayed by US-China trade war talk.
Now at an important zone to watch for clues.
"Impulse" is a surge that creates "Ripples", like a pebble into water.
"Impulse Redux" is returning of wave to the original source of energy.
"Impulse Core" is the zone of maximum energy, in the Golden Pocket.
Are the sellers still there? Enough to absorb the buying power?
Reaction at Impulse is worth observing closely to gauge energy.
Rejection is expected on at least first approach if not several.
This is part my ongoing series to collect examples of my Methodology.
.
.
Ordered Chaos
every Wave is born from Impulse, like a Pebble into Water.
every Pebble bears its own Ripples, gilded of Ratio Golden.
every Ripple behaves as its forerunner, setting the Pulse.
each line Gains its Gravity .
each line Tried and Tested.
each line Poised to Reflect.
every Asset Class behaves this way.
every Time Frame displays its ripples.
every Brain Chord rings these rhythms.
He who Understands will be Humble.
He who Grasps will observe the Order.
He who Ignores will behold only Chaos.
Ordered Chaos
.
.
.
want to Learn a little More?
can you Spend a few Moments?
click the Links under Related.
[Quick Guide] PRISM Signals & PDF indicators.
The PRISM Signals appears to work well especially at lower time-frames (even down to 5 min candles).
The key is to maximizing true-positives is to carefully optimize the input parameters and scoring weights and detection thresholds for a specific given chart and timeframe.
See also the 5 mins chart:
Also shown here is the PDF script, which provides: dynamic Fib levels, pSAR indicator, as well as 2 levels standard deviation bands (disabled here).
The thickest green/red limes are the local-top/bottom lines. Adjust the Fib Input Range accordingly to ensure that the local highs/lows are accurately captured.
The 61.8% levels are the thicker blue lines, and the purple lines are additional levels derived base on the mathematical conjugation between Fib levels.
Again, it is highly recommended to carefully check/optimize the input parameters for a given chart/timeframe against historical trends before proceeding to use it.
This script also provides consecutive higher/lower-highs/lows detection, which is disabled here.
Various features of these scripts can be manually Enabled/Disabled by the users to keep the chart neat.
Even though these scripts are constructed from a set of indicators, it is still highly advised to be used in conjunction with other analysis such as: trendlines, volume, and other indicators, etc., as well as analyzing and comparing with higher/lower timeframes, to help filter out or identify possible risk of false-positives to maximize your success rate.
==========================================================
Indicators used:
PRISM Signals (Color and Stdev bands disabled here) -- Algorithm to generate scoring-based bullish/bearish signals derived from the PRISM oscillators set.
PDF {pSAR /w HiLo Trends + Fib Retrace/Extension Levels} -- Parabolic SAR /w HighLow Trends Indicator/Bar-color-marking + Dynamic Fib Retrace and Extension Level.
Ichimoku Cloud {Cybernetwork} -- Ichimoku Cloud with modified parameters.
Related Indicator:
PRISM Oscillator -- pSAR based oscillator, with RSI/StochRSI as well as Momentum/Acceleration/Jerk indicators
==========================================================
~ * ~ * ~ * ~ * ~ * ~ * ~ * ~ * ~ * ~ * ~ * ~ * ~ * ~ * ~ * ~ * ~ * ~ * ~ * ~ * ~
Note:
In no way is this intended as a financial/investment/trading advice. You are responsible for your own investment decisions and trades.
Please exercise your own judgement for your own trades base on your own risk-aversion level and goals as an investor or a trader. The use of OTHER indicators and analysis in conjunction (tailored to your own style of investing/trading) will help improve confidence of your analysis, for you to determine your own trade decisions.
~ * ~ * ~ * ~ * ~ * ~ * ~ * ~ * ~ * ~ * ~ * ~ * ~ * ~ * ~ * ~ * ~ * ~ * ~ * ~ * ~
Please check out my other indicators sets and series, e.g.
LIVIDITIUM (dynamic levels),
AEONDRIFT (multi-levels standard deviation bands),
FUSIONGAPS (MA based oscillators),
MAJESTIC (Momentum/Acceleration/Jerk Oscillators),
and more to come.
Constructive feedback and suggestions are welcome.
If you like any of my set of indicators, and it has benefited you in some ways, please consider tipping a little to my HRT fund. =D
cybernetwork @ EOS
37DzRVwodp5UZBYjCKvVoZ5bDdDqhr7798 @ BTC
MPr8Zhmpsx2uh3F5R4WD98MRJJpwuLBhA3 @ LTC
1Je6c1vvSCW7V2vA6RYDt6CEvqGYgT44F4 @ BCH
AS259bXGthuj4VZ1QPzD39W3ut4fQV5giC @ NEO
rDonew8fRDkZFv7dZYe5w3L1vJSE51zFAx @ Ripple XRP
0xc0161d27201914FC0bAe5e350a193c8658fc4742 @ ETH
GAX6UDAJ52OGZW4FVVG3WLGIOJLGG2C7CTO5ZDUK2P6M6QMYBJMSJTDL @ Stellar XLM
xrb_16s8cj8eoangfa96shsnkir3wctdzy76ajui4zexek6xmqssweu85rdjxrt4 @ Nano
~ JuniAiko
(=^~^=)v~

USD/ZAR Never Presume on the Market Study (Part 2)As a follow up to my previous post (see below), we see that what we have seen in the way of sell activity was a deep pullback to the trendline. When we are not sure what the market is doing, it's best to wait than to presume. Let us also look left, we see retesting of key zone (wick). Will price continue up to 15.5 and above? Continue to study price action and see where it takes us!

USD/ZAR Never Presume on the Market - TutorialUSD/ZAR is by far my favorite pair to trade. This is simply a tutorial to remind us to always keep an open mind when we perform analysis. We can never presume which way the market will go. We must study zone to zone, swing by swing, price action, all along the way. Some may say we will see a drop , some may say we will see a rise, but what does the market say? What we want to study is market structure and patterns within the market structure, as well as price action along the way.
Before we study the charts the first thing we should do is forget everything we think we know about where we think price will go. We need to approach the market with an open mind and ask ourselves: What is the market saying to me?
Now for what we do see. Starting on a higher timeframe, technically speaking we could have a bullish flag forming. Afterwhich we could expect another push to the upside. Depending on price action in the markets in the near future, we could see price break the trendline as noted for further movement down; Even still In either sense we may see price reverse. We can't assume that price will reach a certain high or low, but what does the market say? The analysis can change from one day to another based on what price action is doing. I also remind us all to not trade the news, but to keep the news in mind. We should always be aware of what's going on fundamentally. However, the market structure of the chart over time incorporates news events and such over time. Technicals tell the whole story.
Lets discuss! What do you see? Follow me on Facebook or Instagram (links below). Be sure to comment and like as well. Students of the market we must always remain! To join my team of forex traders and learn how to trade the markets, inbox me for more information or click my link in my bio.

Next waves must be around $1600 Hello all, looking at the analysis for XAU that is very interesting. I bet the $1600 as the next target for XAU and if we look at the blue line which has crossed up the white dynamic line, this is clearly a good sign for trend continuation, I hope to see the price retrace first to complete the 4th wave before challenging the golden pocket zone.
Thank you

Great tool for predicting bubble/hype tops!What is the difference between bubble and hype?
Hypes are usually local tops inside the greater bubble.
As we said before there is a 90% chance we already started the next bubble.
For now, we had a hype that most probably finished at the 5th Elliot wave.
As you can see previous tops and dips can greatly predict where the next tops will be!
1.618 Fibonacci level is the key and when combined with Fibonacci levels from other extensions you get to know where the strong resistance is.
First, we get to extend to 3.618 and then to one level lower (2.618) from the previous price movement. Both are aligned with previous 1.618 Fibonacci extensions.
Hope with this will mean less FOMO and FUD when trading.
THIS IS NOT FINANCIAL ADVICE.
Remember to trade safely!
If you want to thank us you can hit like and leave a comment. Thank you for your support.

ELLIOTT WAVES - characteristics Waves for BITCOINWave characteristics
1. "Market psyche" is almost completely bearish The news is still negative
2. The market is drifting away from recent, hard - work, profitable positions.
The price can roll back almost 100% of Wave 1, but not lower that is beginning .
Usually it is about 50-60 % of Wave 1, and it develops against the background of the dominant predominance of investors who prefer to fix profit.
3. There is a sharp growth of optimism among investors.
This is most powerful and longest wave of growth
(it can't be the shortest), at which prices accelerate and volumes increase. Classical 3
Wave exceeds Wave 1 at least in 1.618 times and may be even bigger.
4. Wave is often difficult to identify. Usually it rolls back no more then 38% of Wave 3.
It's depth and duration, as a mile, is not big.
Wave 4 should not fall below the level of Wave 2.
5. Wave 5 is usually much less dynamic, than the 3 Wave.
During the 5 Wave, many confirming technical indicators begin to fall behind the price movement.
Also at this time, some oscillators start to show negative divergence, warning that the
market is moving to the top.

GBPNZD 50% Fibonacci Retracement of Pin BarEntry 50% Fibonacci Retracement of Pin Bar (Price Level 1.86555)
Exit at Key Horizontal Support Resistance Level 1.84292
Another idea is to enter at 38.2% Fibonacci Level and Horizontal Key Level (1.86323) for confluence.

GBPUSD Fibonacci Trade Entry Level and Stop Loss LevelEnter between 0.618 and 0.786 of the Pin Bar for Fibonacci Level Trade Idea. Stop Loss at the 1.618 Level.

GBPSGD Fibonacci Trade Entry Level and Stop Loss LevelGBPSGD | Enter between 0.618 and 0.786 of the Pin Bar for Fibonacci Level Trade Idea. Stop Loss at the 1.618 Level.

The "Pulse" of an asset times Fibonacci: BTC dire Impulse ReduxBitcoin has returned to its last Impulse pushing up.
This is a crucial test of the overall trend structure.
This battle will determine the mid-term outlook.
"Impulse" is a surge that creates "Ripples", like a pebble into water.
"Impulse Redux" is returning of wave to the original source of energy.
"Impulse Core" is the zone of maximum energy, in the Golden Pocket.
Are the buyers still there? Enough to absorb the selling power?
Reaction at Impulse is worth observing closely to gauge energy.
Rejection is expected on at least first approach if not several.
This is part my ongoing series to collect examples of my Methodology.
.
.
Ordered Chaos
every Wave is born from Impulse, like a Pebble into Water.
every Pebble bears its own Ripples, gilded of Ratio Golden.
every Ripple behaves as its forerunner, setting the Pulse.
each line Gains its Gravity .
each line Tried and Tested.
each line Poised to Reflect.
every Asset Class behaves this way.
every Time Frame displays its ripples.
every Brain Chord rings these rhythms.
He who Understands will be Humble.
He who Grasps will observe the Order.
He who Ignores will behold only Chaos.
Ordered Chaos
.
.
.
want to Learn a little More?
can you Spend a few Moments?
click the Links under Related.

Intro To Gold Reversal TemplateHello, guys!
For those who still follow and read my setups! I want to give you something that can help you in trading!
This is a very beautiful template if you combine it with other tools you have in your arsenal.
Especially with Trend Lines and structure.
Please click on the share button under this idea, and then click on MAKE IT MINE, it will open up in a chart for you and go to 1 minute to monitor this template.
I will update rules below this idea.
