Fibonacci

Bitcoin Dominance update (based on previous EWT)First of all, before you read this analysis, please read the previous analysis about bitcoin dominance on the related idea to help you understand more about it
Hello fellas, welcome back to the bitcoin dominance update. we have seen some manipulation has occured in the past few days, especially when we saw the price surged from $6500 region to roughly $7500 region. This $1000 movement occured only in 10 hours. Some analysts might think that the bearish market structure has ended and the bottom's already in. But, I really think that the the price is even far from the bottom for now.
Just look at the chart, I've modified the levels on the chart and the fibonacci retracement method that I'm using comparing my last analysis. I use the body to body connecting method on weekly chart to measure the fibonacci retracement levels because I think this condition can give me more confluence reasons and of course excluding the trap region which are the wick on the higher time frame can give us more conservative view on this chart.
Based on the elliot wave prespective, the dominance level has spiked up exactly after I gave my last analysis. it's currently at 70% levels and this region is however becoming a strong resistance for bitcoin dominance. This 70% level is the area of broken support that is now become resistance. Beside this, this is a golden pocket zone.
We've seen the first rejection of current resistance level and there is a potential of ABC pattern too. So, it may be the top of bitcoin dominance right now. And if I wrong about this, I see the 71% as the maximum region for the dominance to top.

Pulse of an asset in Fibonacci: OXT is born with "Golden Growth"This type of growth has been called "Exponential" or "Parabolic" by many analysts.
This occurrence is actually NOT very common in markets at a scale we can see.
This DOES occur at microscopic levels but is difficult to capture at those levels.
Most moves are "Linear" growth such as 2.618, 3.618, 4.618, as most of my plots.
But once a while we will see this " Golden Growth ", 2.619, 4.618, 6.853, etc.
This can occur early in life, or later during a "ReBirth" like BTC in early 2019 .
But this growth pattern is the ONLY manner in which things grow in Nature.
It applies from the length of your finger bones, to the arms of a spiral Galaxy.
It makes sense, 1+1=2, 1+2=3, 2+3=5, 5+3=8, etc. A natural means of growth.
This particular specimen is OXT (Orchid) recently launched on CoinBase.
It has since grown by leaps and bounds (literally) with over 300% gains.
Each expansion and each retrace have been in sync with this Fib.
So will it now crash and burn? or will it reach for the Next Golden Fib?
Of note, it was not able to reach the blue 13.706 ratio before pulling back.
If it comes back to a fib and bounces with a " Ping ", that is when to buy.
This is part my ongoing series to collect examples of my Methodology.
.
.
Ordered Chaos
every Wave is born from Impulse, like a Pebble into Water.
every Pebble bears its own Ripples, gilded of Ratio Golden.
every Ripple behaves as its forerunner, setting the Pulse.
each line Gains its Gravity .
each line Tried and Tested.
each line Poised to Reflect.
every Asset Class behaves this way.
every Time Frame displays its ripples.
every Brain Chord rings these rhythms.
He who Understands will be Humble.
He who Grasps will observe the Order.
He who Ignores will behold only Chaos.
Ordered Chaos
.
.
.
want to Learn a little More?
can you Spend a few Moments?
click the Links under Related.

"Pulse" of an asset via Fibonacci: BTC at DIRE Impulse Redux"Impulse" is a surge that creates "Ripples", like a pebble into water.
"Impulse Redux" is returning of wave to the original source of energy.
"Impulse Core" is the zone of maximum energy, in the Golden Pocket.
Are the buyers still there? Enough to absorb the selling power?
Reaction at Impulse is worth observing closely to gauge energy.
Rejection is expected on at least first approach if not several.
This is part my ongoing series to collect examples of my Methodology.
.
.
Ordered Chaos
every Wave is born from Impulse, like a Pebble into Water.
every Pebble bears its own Ripples, gilded of Ratio Golden.
every Ripple behaves as its forerunner, setting the Pulse.
each line Gains its Gravity .
each line Tried and Tested.
each line Poised to Reflect.
every Asset Class behaves this way.
every Time Frame displays its ripples.
every Brain Chord rings these rhythms.
He who Understands will be Humble.
He who Grasps will observe the Order.
He who Ignores will behold only Chaos.
Ordered Chaos
.
.
.
want to Learn a little More?
can you Spend a few Moments?
click the Links under Related.
Pulse of an asset in Fibonacci: Chapter 6: Give me a ping VasiliChapter 6: "Give me a ping Vasili, one Ping only please"
"Impulse" is a surge that creates "Ripples", like a pebble into water.
Each of the Ripples has precise bounds defined by the "Golden Ratio".
Until a new Impulse occurs, the Price oscillates within "Energy Bands".
Markets quite often ask "Give me a ping Vasili ... ONE Ping only please?"
Some Pings are so clean you can almost HEAR them resonate off the chart.
Such a Ping causes the Price Wave to STAGGER as if it received a concussion.
Not all Pings start a reversal, but most reversals start with a Ping.
Every Ping increases our confidence in the entire set of Ripples.
When the Pings stop, it is time to find the new Impulse at work.
.
This is "Chapter 6" of my ongoing "Book" detailing my methodology.
The first five chapters are linked below, best to start with #1 and #2.
I will use this publication to collect "Pings", and to study the after effects.
Previous Chapters:
Chapter 1: Introduction and numerous Examples.
Chapter 2: Detailed Samples and multiple Impulses.
Chapter 3: The Dreaded 9.618: Murderer of Moves.
Chapter 4: Impulse Redux: Return to the Birth Place.
Chapter 5: Golden Growth: Nature's Perfect Expansion.
Chapter 6: Give me a ping Vasili, one Ping only please.
.
.
Ordered Chaos
every Wave is born from Impulse, like a Pebble into Water.
every Pebble bears its own Ripples, gilded of Ratio Golden.
every Ripple behaves as its forerunner, setting the Pulse.
each line Gains its Gravity.
each line Tried and Tested.
each line Poised to Reflect.
every Asset Class behaves this way.
every Time Frame displays its ripples.
every Brain Chord rings these rhythms.
He who Understands will be Humble.
He who Grasps will observe the Order.
He who Ignores will behold only Chaos.
Ordered Chaos
.

GBPAUD H8 (Educational purpose Only)GBPAUD H8 (Educational purpose Only)
- Elliott Wave provides the highest probability of the price movement and Fibonacci levels is the math basis for the Elliott Wave Theory. Both waves impulsive and corrective, follow to specific Fibonacci proportions.
Regards, GoldfXcc Team

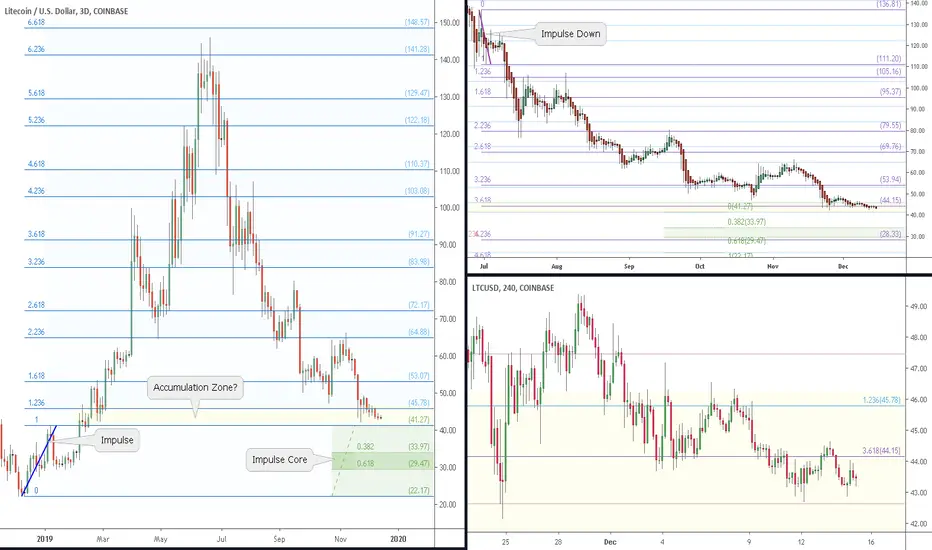
"Pulse" of an asset via Fibonacci: LTC Impulse Redux of 2019LiteCoin has made a round trip in 2019 (as have many others).
Price is approaching what SHOULD the "Maximum Demand" zone.
"Should" as in it remains to be seen if there is still demand here.
"Impulse" is a surge that creates "Ripples", like a pebble into water.
"Impulse Redux" is returning of wave to the original source of energy.
"Impulse Core" is the zone of maximum energy, in the Golden Pocket.
Are the buyers still there? Enough to absorb the selling power?
Reaction at Impulse is worth observing closely to gauge energy.
Rejection is expected on at least first approach if not several.
This is part my ongoing series to collect examples of my Methodology.
.
.
Ordered Chaos
every Wave is born from Impulse, like a Pebble into Water.
every Pebble bears its own Ripples, gilded of Ratio Golden.
every Ripple behaves as its forerunner, setting the Pulse.
each line Gains its Gravity .
each line Tried and Tested.
each line Poised to Reflect.
every Asset Class behaves this way.
every Time Frame displays its ripples.
every Brain Chord rings these rhythms.
He who Understands will be Humble.
He who Grasps will observe the Order.
He who Ignores will behold only Chaos.
Ordered Chaos
.
.
.
want to Learn a little More?
can you Spend a few Moments?
click the Links under Related.
"Pulse" of an asset via Fibonacci: Raven's GENESIS Impulse ReduxMost assets have many Impulses in a Lifetime, each with a Core.
But all assets have only ONE "Genesis" Impulse, at birth or rebirth.
Raven has returned to its Genesis Core, and now it is life or death.
Is Raven's core DNA still there? enough to breath new life?
Will it be reborn like a Phoenix and fly back into the wild?
Or will it sink into Fetal position and never be heard again?
"Impulse" is a surge that creates "Ripples", like a pebble into water.
"Impulse Redux" is returning of wave to the original source of energy.
"Impulse Core" is the zone of maximum energy, in the Golden Pocket.
This is part my ongoing series to collect examples of my Methodology.
.
Ordered Chaos
every Wave is born from Impulse, like a Pebble into Water.
every Pebble bears its own Ripples, gilded of Ratio Golden.
every Ripple behaves as its forerunner, setting the Pulse.
each line Gains its Gravity .
each line Tried and Tested.
each line Poised to Reflect.
every Asset Class behaves this way.
every Time Frame displays its ripples.
every Brain Chord rings these rhythms.
He who Understands will be Humble.
He who Grasps will observe the Order.
He who Ignores will behold only Chaos.
Ordered Chaos
.
.
.
want to Learn a little More?
can you Spend a few Moments?
click the Links under Related.

Bullish move in Fibonacci ChannelIt looks like MATIC is again climbing in a channel. LONG Opportunity
On the way up there might be a resistance from SMA50 sending it back to the channel bottom (276 Satoshi)
However, eventually, I expect it to climb up to the channel top (344 Satoshi) (SHORT Opportunity)
And then back to the bottom of the channel (approx 276 Satoshi) (LONG Opportunity)
This is the same climbing channel I mentioned in A Peek to the Past:
Just a possibility... Curiously watching if the Fibo channel is at work again

A peek into the pastMATICBTC neatly moved in a Fibonacci Channel and fell down to 100% bottom of that channel.
Two detectors predicted the top
Golden Ratio Top Detector (UO_GRFM)
Mayer Multiple
Golden Ratio Top Detector also showed the potential bottom correctly.
Future? As long as it coasts above SMA350/6h, I will consider it a bullish opportunity and keep collecting.
Also note that is about to jump to an upper Fibonacci channel(78.60%) from 100% channel-- very bullish if this happens

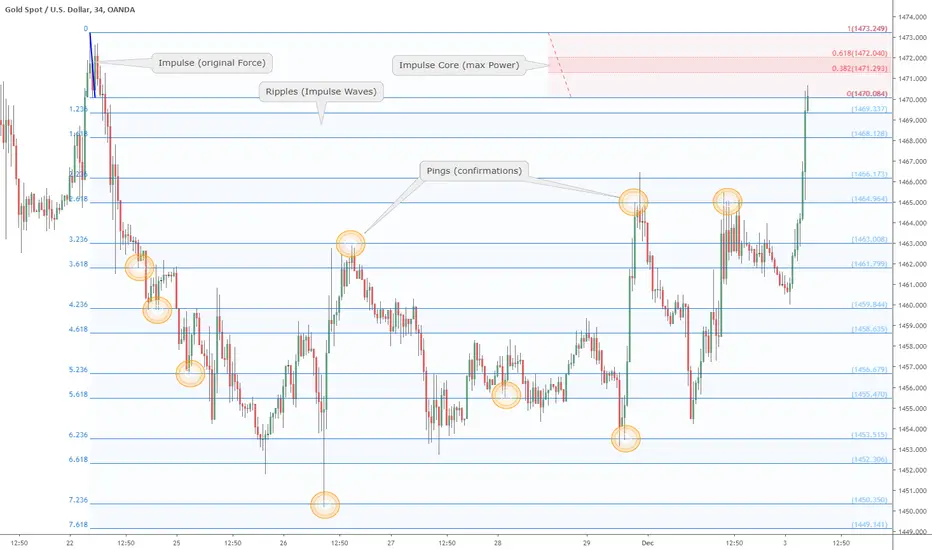
"Pulse" of an Asset ala Fibonacci: Gold's Round Trip to ImpulseGold erased most of the last leg up, but only "most" of it.
Why not "all"? Is this a "Dead Cat"? Will it "Crash" further?
With the correct "impulse" identified, we can gather clues.
Now that it is back to the Impulse, next move is crucial.
If it lingers in "Accumulation" zone, expect another push up.
If it reaches the "Impulse Core", observe closely for strength.
" Impulse " is a surge that creates "Ripples", like a pebble into water.
" Impulse Redux " is returning of wave to the original source of energy.
"I mpulse Core " is the zone of maximum energy, in the Golden Pocket.
Are the Buyers still there? Enough to absorb the selling power?
Reaction at Impulse is worth observing closely to gauge energy.
Rejection is expected on at least first approach if not several.
This is part my ongoing series to collect examples of my Methodology.
.
.
Ordered Chaos
every Wave is born from Impulse, like a Pebble into Water.
every Pebble bears its own Ripples, gilded of Ratio Golden.
every Ripple behaves as its forerunner, setting the Pulse.
each line Gains its Gravity .
each line Tried and Tested.
each line Poised to Reflect.
every Asset Class behaves this way.
every Time Frame displays its ripples.
every Brain Chord rings these rhythms.
He who Understands will be Humble.
He who Grasps will observe the Order.
He who Ignores will behold only Chaos.
Ordered Chaos
.
.
.
want to Learn a little More?
can you Spend a few Moments?
click the Links under Related.

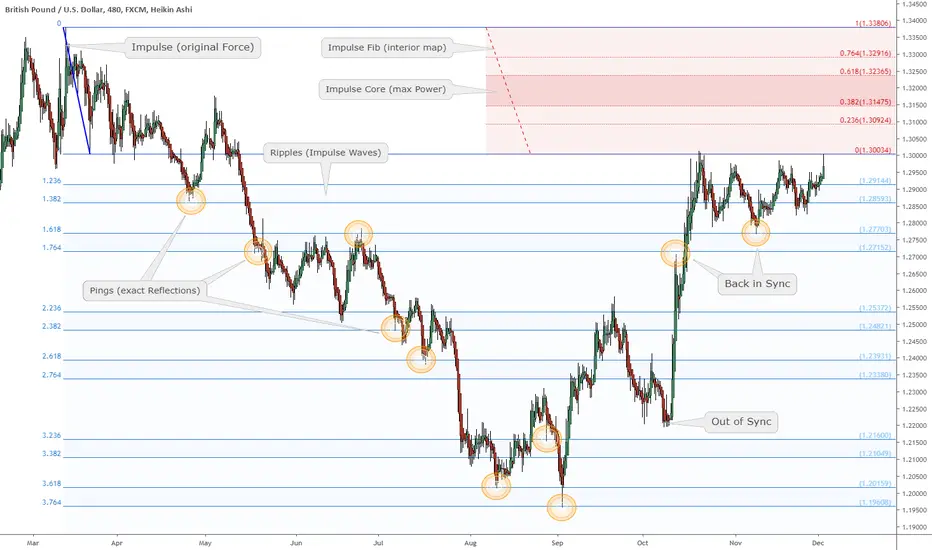
"Pulse" of an asset times Fibonacci: GU at MAJOR Impulse ReduxThe Pound has been climbing rapidly due to Brexit developments.
Now faces not only round number 1.3000 but also a major Impulse.
This zone could determine the future trend for many years to come.
"Impulse" is a surge that creates "Ripples", like a pebble into water.
"Impulse Redux" is returning of wave to the original source of energy.
"Impulse Core" is the zone of maximum energy, in the Golden Pocket.
Are the sellers still there? Enough to absorb the buying power?
Reaction at Impulse is worth observing closely to gauge energy.
Rejection is expected on at least first approach if not several.
This is part my ongoing series to collect examples of my Methodology.
.
.
Ordered Chaos
every Wave is born from Impulse, like a Pebble into Water.
every Pebble bears its own Ripples, gilded of Ratio Golden.
every Ripple behaves as its forerunner, setting the Pulse.
each line Gains its Gravity .
each line Tried and Tested.
each line Poised to Reflect.
every Asset Class behaves this way.
every Time Frame displays its ripples.
every Brain Chord rings these rhythms.
He who Understands will be Humble.
He who Grasps will observe the Order.
He who Ignores will behold only Chaos.
Ordered Chaos
.
.
.
want to Learn a little More?
can you Spend a few Moments?
click the Links under Related.
Bitcoin buy and sell Fibonacci ChannelsBitcoin is dropping in a very clear Fibonacci Channel. I have labeled the Buy/Sell Channels in the chart. Until it goes out of the channel, this is the trend...
Personally, I would sell in the sell channel and put a stop loss to buy it if goes out of the channel. This is not financial advice. Make your own analysis. Just pointing out the use of Fibonacci Channel

"Pulse" of an asset times Fibonacci: NU at minor Impulse ReduxAs you know, Kiwi has been quite strong lately, across the Board.
It has made a return trip after a 6 month exploration of the Deep.
Now we will see the true strength of its conviction at the Core.
"Impulse" is a surge that creates "Ripples", like a pebble into water.
"Impulse Redux" is returning of wave to the original source of energy.
"Impulse Core" is the zone of maximum energy, in the Golden Pocket.
Are the sellers still there? Enough to absorb the buying power?
Reaction at Impulse is worth observing closely to gauge energy.
Rejection is expected on at least first approach if not several.
In this particular case it has already Pinged the 0.618.
As in most of all cases, it was rejected on first approach.
How it reacts here will offer insights into trend strength.
This is part my ongoing series to collect examples of my Methodology.
.
.
Ordered Chaos
every Wave is born from Impulse, like a Pebble into Water.
every Pebble bears its own Ripples, gilded of Ratio Golden.
every Ripple behaves as its forerunner, setting the Pulse.
each line Gains its Gravity .
each line Tried and Tested.
each line Poised to Reflect.
every Asset Class behaves this way.
every Time Frame displays its ripples.
every Brain Chord rings these rhythms.
He who Understands will be Humble.
He who Grasps will observe the Order.
He who Ignores will behold only Chaos.
Ordered Chaos
.
.
.
want to Learn a little More?
can you Spend a few Moments?
click the Links under Related.

BTC?USDTHi Guys, please like me now and follow me on tradingview.com/u/omidmokri/
I'm going to show you my Bitcoin trading plan in USDT and Break-even level of various Miners for BITCOIN.
Look at the latest analysis update The illustrations are illustrative.
As you remember English is not my native language (i'm KURD and VIVA ROJAVA), so please don't judge my English strictly, I will continue to improve my skills in this.
Guys, if you like the idea please like the button, this will be the best thanks.
If you have any suggestions on how I can improve my video ideas you can write them in the comments!
Thank you for your support, I appreciate it.

"Pulse" of an asset times Fibonacci: Gold at minor Impulse Redux"Impulse" is a surge that creates "Ripples", like a pebble into water.
"Impulse Redux" is returning of wave to the original source of energy.
"Impulse Core" is the zone of maximum energy, in the Golden Pocket.
Are the sellers still there? Enough to absorb the buying power?
Reaction at Impulse is worth observing closely to gauge energy.
Rejection is expected on at least first approach if not several.
This is part my ongoing series to collect examples of my Methodology.
.
.
Ordered Chaos
every Wave is born from Impulse, like a Pebble into Water.
every Pebble bears its own Ripples, gilded of Ratio Golden.
every Ripple behaves as its forerunner, setting the Pulse.
each line Gains its Gravity .
each line Tried and Tested.
each line Poised to Reflect.
every Asset Class behaves this way.
every Time Frame displays its ripples.
every Brain Chord rings these rhythms.
He who Understands will be Humble.
He who Grasps will observe the Order.
He who Ignores will behold only Chaos.
Ordered Chaos
.
.
.
want to Learn a little More?
can you Spend a few Moments?
click the Links under Related.
"Pulse" of an asset times Fibonacci: ChainLink Dance on Thin IceChainLink is still retreating from last surge.
It may be undergoing a "bottoming" process.
Delicate Dance on sub-Fibs shows some intent.
Part of my ongoing series to demonstrate my Methodology that I call "Ordered Chaos".
.
.
Ordered Chaos
every Wave is born from Impulse, like a Pebble into Water.
every Pebble bears its own Ripples, gilded of Ratio Golden.
every Ripple behaves as its forerunner, setting the Pulse.
each line Gains its Gravity.
each line Tried and Tested.
each line Poised to Reflect.
every Asset Class behaves this way.
every Time Frame displays its ripples.
every Brain Chord rings these rhythms.
He who Understands will be Humble.
He who Grasps will observe the Order.
He who Ignores will behold only Chaos.
Ordered Chaos
.
.
.
want to Learn a little More?
can you Spend a few Moments?
click the Links under Related.


GBPUSD Consolidation Gave Some Of The Best Trading OpportunitiesGBPUSD Consolidation Gave Some Of The Best Trading Opportunities
1. Most of impulse legs had 50 or 61.8 retracements
2. These led to 1.618 Fibonacci Extensions and confluences with 0.886 generating harmonic patterns
3. Usual targets for all these patterns have been at least 38.2 Fib levels.

Elliot wave perspective on bitcoin dominanceHello fellas, we've seen a huge moves on bitcoin in these past few days and in this specific post, I want to do a quick update analysis about the dominance of bitcoin. If you've seen my previous analysis about the correlation between bitcoin dominance and the bitcoin's price, you should know that lately bitcoin's price has a positive correlation with the bitcoin dominance.
Looking at the chart, I use the daily chart which is pretty consistent for the use of swing trader and has a great confirmation whatsoever. Based on EW perspective, I see that the period between September 5th, 2019 - November 12th, 2019 was the A corrective wave in bigger cycle. And with this fact, we can easily see that the A wave has formed a type of Falling wedges or usually known as a leading first wave diagonal. Usually, after this action, we will see the B wave that correct the action of A wave in this market cycle and the B wave could spike to the upside that moves align with the golden pocket zone.
But, other than that, we must consider the 70% level as a strong resistance for this dominance structure. with the price of bitcoin has a potential to touch again $8000 region, I do believe this dominance will have the similar spike as bitcoin has. The higher dominance level of bitcoin means the higher money inflow of the bitcoin and if more money inflow occur on bitcoin, we will see the demand spike comparing with the number of supply of bitcoin which will affect the increase of the price on bitcoin.

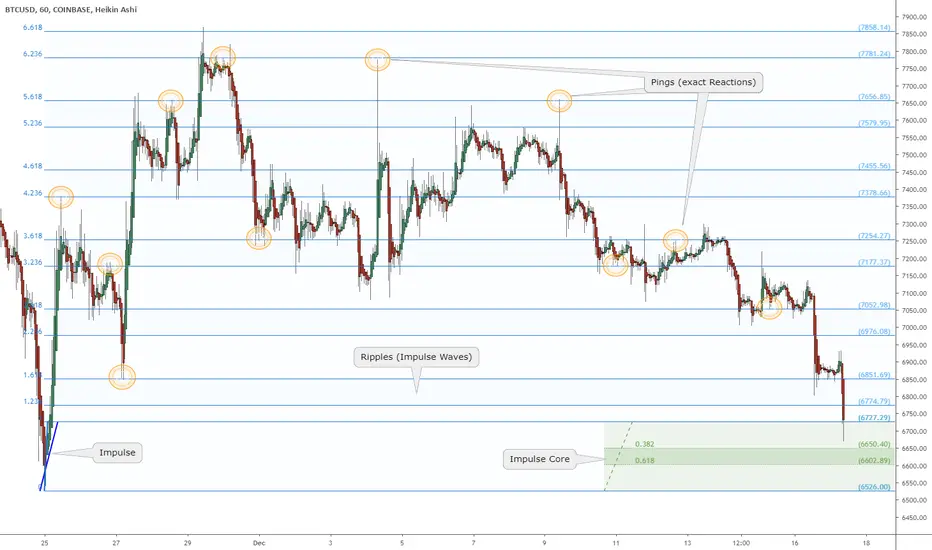
BTC pushing into crucial Impulse Redux: Bitcoin Battle of 2019 ?Every Bitcoin watcher has eyes on $7400-7500 right now.
Dissecting the waves produces an exact map of the terrain.
Bulls have many levels to climb, this one is most important.
There is talk of "Head n Shoulders" and "MA crosses", etc.
This method precisely defines the mathematical road map.
The "Impulse Core" has the maximum energy of this wave.
"Impulse" is a surge that creates "Ripples", like a pebble into water.
"Impulse Redux" is returning of wave to the original source of energy.
"Impulse Core" is the zone of maximum energy, in the Golden Pocket.
Are the sellers still there? Enough to absorb the buying power?
Reaction at Impulse is worth observing closely to gauge energy.
Rejection is expected on at least first approach if not several.
This is part my ongoing series to collect examples of my Methodology.
.
.
Ordered Chaos
every Wave is born from Impulse, like a Pebble into Water.
every Pebble bears its own Ripples, gilded of Ratio Golden.
every Ripple behaves as its forerunner, setting the Pulse.
each line Gains its Gravity .
each line Tried and Tested.
each line Poised to Reflect.
every Asset Class behaves this way.
every Time Frame displays its ripples.
every Brain Chord rings these rhythms.
He who Understands will be Humble.
He who Grasps will observe the Order.
He who Ignores will behold only Chaos.
Ordered Chaos
.
.
.
want to Learn a little More?
can you Spend a few Moments?
click the Links under Related.

XAUUSD Fibonacci Level and Support Resistance LevelConfluence with 1478.85 Horizontal Support Resistance Level and 50% Horizontal Fibonacci Level (1478.87)

Long BONDS? Bond futures strength could spell S&P 500 weaknessThe recent upside in the bond market has been in tandem with the upside in the S&P 500. The move higher in bonds is largely due to the lower rates in monetary policy. Which should not directly affect long-term bonds by much but they have had some effect. Over the past three months, Bonds have gone down while the S&P 500 has made a lot of gains.
The 30-year bonds should rebound at the previous broken high which should hold as support. Max, the move may go down to the 50% retrace level based on the Fib retracement before rebounding. Till the retrace opens up we could see more upside in the equity market. The long extended wicks near support suggest the bond buyers coming in a pop above the recent high into all-time highs could crush the S&P 500.
There is a chance that the bond market continues to drop through the support levels, the opening upside for the equity market. This is the tail end of bond investments that have grown exponentially over the last year.
Correlations in markets are pivotal to identifying the current economic cycle on a longer-term perspective.
