META: Next Long Term Buy Following a disappointing earnings report, Meta (META) dropped more than 10% in post-market trading, decisively breaking through several key support levels. My primary support zones are typically derived from anchored VWAPs (Volume-Weighted Average Prices), which help identify where institutional bu

The best trades require research, then commitment.
Get started for free$0 forever, no credit card needed

Scott "Kidd" PoteetThe unlikely astronaut

Where the world does markets
Join 100 million traders and investors taking the future into their own hands.

XAUUSD Long: Demand Zone Holding, Eyes on $4,080Hello traders! Gold (XAUUSD) is currently showing a corrective phase within its broader bullish trend. After a strong rally from the $3,850 Demand Zone, price climbed steadily along the ascending Trend Line, forming higher highs and higher lows until reaching the $4,150–$4,180 Resistance Area. This

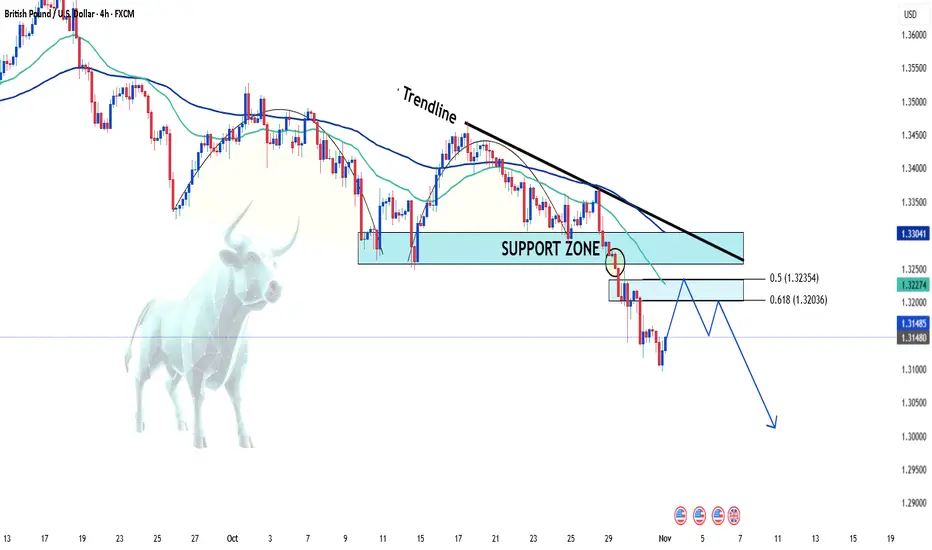
GBPUSD: Drops Sharply After Breaking Key Support👋Hello traders , what’s your view on FX:GBPUSD ?
The GBP/USD pair continues its bearish momentum in the first sessions of November, currently trading around the 1.314 zone after failing to hold the key 1.326 support — which has now turned into new resistance.
On the 4H technical chart, the desce
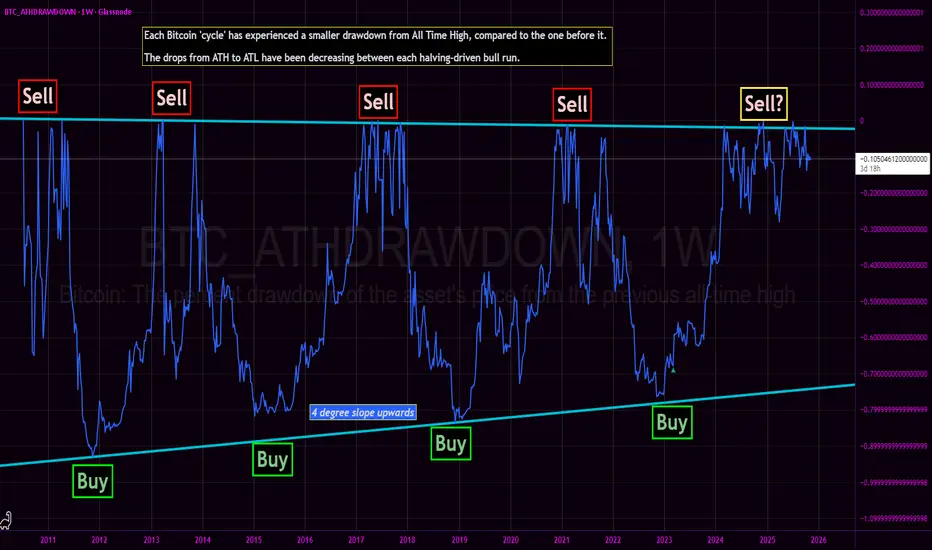
Bitcoin All Time High Drawdown - Bottom nowhere in sight?We revisit the Bitcoin All Time High Drawdown chart originally published in March 2023.
The core thesis of the BTC_ATHDRAWDOWN chart remains intact: each subsequent market cycle has exhibited a diminishing drawdown from its prior All-Time High, with generational cycle bottoms resting squarely on
Wall Street Weekly Outlook - Week 44 2025 [27.10.- 31.10.2025]Wall Street Weekly Outlook – Week 44, 2025 📊💥
Let’s dive into another exciting trading week! 🚀
Rate decisions, month-end flows, and fresh quarterly earnings are setting the stage for strong market moves.
Sit back, enjoy the overview, and dive into the world of banks, hedge funds, and institution

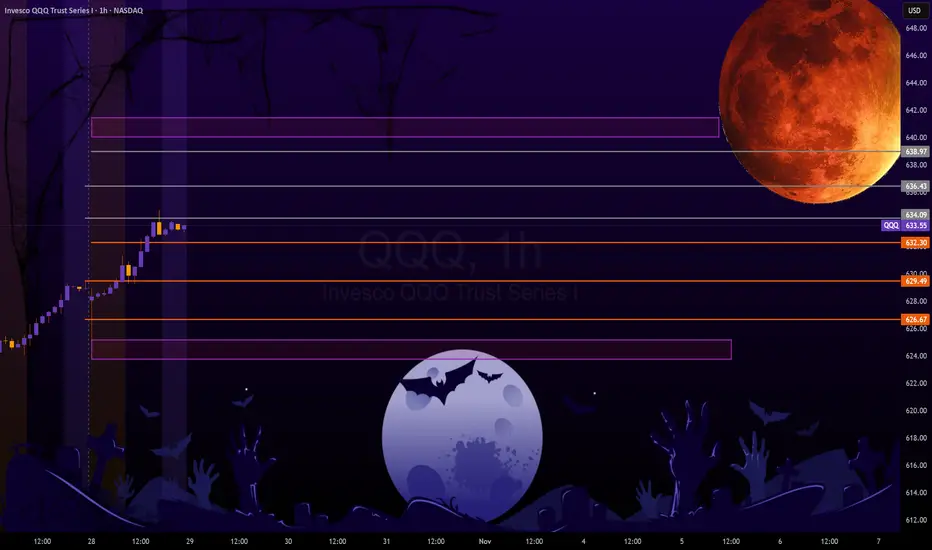
QQQ: Preparation for FOMC... and Halloween Okay, so here is my annual Halloween themed post! Have to stick to tradition I guess.
Here I am sharing intra-day predictions in anticipation for FOMC release tomorrow.
The FEDS are between a rock and a hard place. As the Federal reserve depends on the federal government to release statistics, i
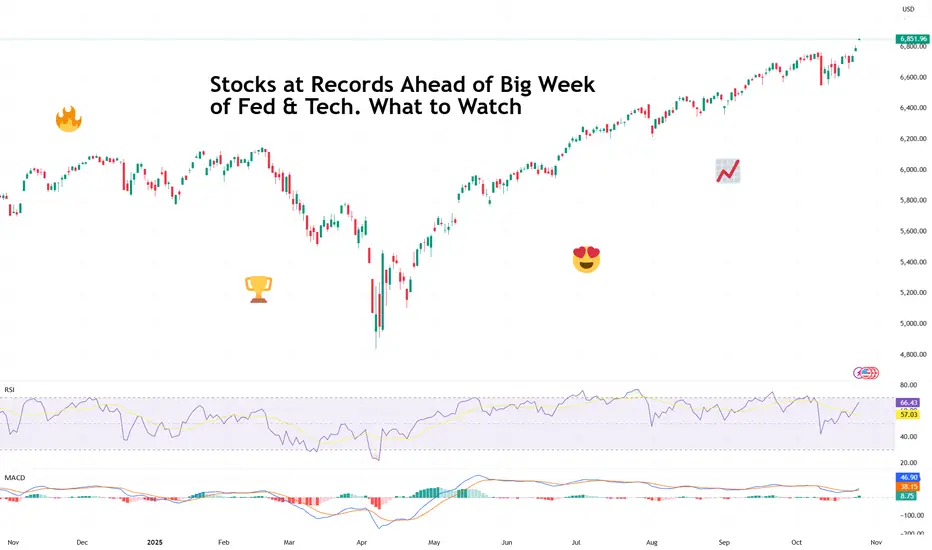
Stocks at Records Ahead of Big Week of Fed & Tech. What to WatchRecord highs, rate-cut optimism, five tech giants on deck — what a time to be a market participant!
It’s Monday, and Wall Street is back doing what it does best — setting new records and pretending not to worry about what comes next.
After a cooler-than-expected inflation print and some diplomat
BTCUSDT – When the Bullish Wave ReturnsBitcoin is showing a notable recovery phase after a series of previous corrections. On the daily timeframe, price continues to move within an ascending channel that has been forming since the beginning of Q3.
Currently, BTC is approaching the midline of the channel around 115,000–116,000 USD , w

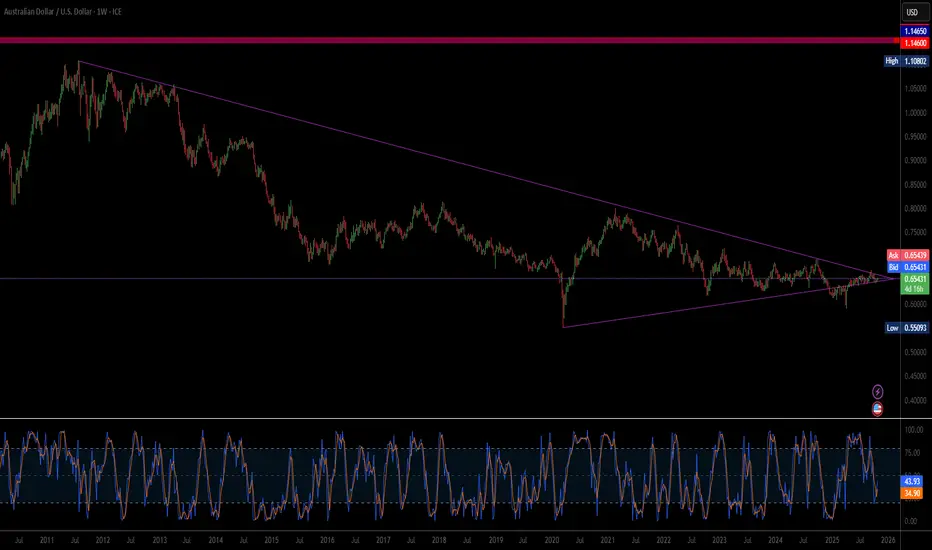
Is Geopolitical Re-Alignment the New AUD Catalyst?The Australian Dollar's (AUD) sharp surge against the US Dollar (USD) is driven by a powerful synergy of geopolitical de-escalation and structural economic realignment. Near-term momentum stems from optimism surrounding an imminent US-China trade deal. As a primary commodity exporter and a financial
Can WTI’s 8% Rally Hold After Trump-Putin Summit Collapse?WTI just staged its biggest two-day rally since June, as hopes for a Trump-Putin summit were dashed, leading to new US sanctions on Russian oil exports.
Here’s what’s fuelling the move and what traders should watch next:
- US sanctions on Russia’s top oil producers after failed Budapest summit tr

See all editors' picks ideas
LogNormalLibrary "LogNormal"
A collection of functions used to model skewed distributions as log-normal.
Prices are commonly modeled using log-normal distributions (ie. Black-Scholes) because they exhibit multiplicative changes with long tails; skewed exponential growth and high variance. This approach i

Range Oscillator (Zeiierman)█ Overview
Range Oscillator (Zeiierman) is a dynamic market oscillator designed to visualize how far the price is trading relative to its equilibrium range. Instead of relying on traditional overbought/oversold thresholds, it uses adaptive range detection and heatmap coloring to reveal where pri

Volume Surprise [LuxAlgo]The Volume Surprise tool displays the trading volume alongside the expected volume at that time, allowing users to spot unexpected trading activity on the chart easily.
The tool includes an extrapolation of the estimated volume for future periods, allowing forecasting future trading activity.
🔶 U

Smooth Theil-SenI wanted to build a Theil-Sen estimator that could run on more than one bar and produce smoother output than the standard implementation. Theil-Sen regression is a non-parametric method that calculates the median slope between all pairs of points in your dataset, which makes it extremely robust to o

Fair Value Gaps by DGTFair Value Gaps
A refined, multi-timeframe Fair Value Gap (FVG) detection tool that brings institutional imbalance zones to life directly on your chart.
Designed for precision, it visualizes how price delivers into inefficiencies across chart, higher, and lower (intrabar) timeframes — offering a fl

TASC 2025.11 The Points and Line Chart█ OVERVIEW
This script implements the Points and Line Chart described by Mohamed Ashraf Mahfouz and Mohamed Meregy in the November 2025 edition of the TASC Traders' Tips , "Efficient Display of Irregular Time Series”. This novel chart type interprets regular time series chart data to create an ir

Simplified Percentile ClusteringSimplified Percentile Clustering (SPC) is a clustering system for trend regime analysis.
Instead of relying on heavy iterative algorithms such as k-means, SPC takes a deterministic approach: it uses percentiles and running averages to form cluster centers directly from the data, producing smoo

Adaptive Volume Delta Map---
📊 Adaptive Volume Delta Map (AVDM)
What is Adaptive Volume Delta Map (AVDM)?
The Adaptive Volume Delta Map (AVDM) is a smart, multi-timeframe indicator that visualizes buy and sell volume imbalances directly on the chart.
It adapts automatically to the best available data resolution

Dynamic Equity Allocation Model"Cash is Trash"? Not Always. Here's Why Science Beats Guesswork.
Every retail trader knows the frustration: you draw support and resistance lines, you spot patterns, you follow market gurus on social media—and still, when the next bear market hits, your portfolio bleeds red. Meanwhile, institution

First Passage Time - Distribution AnalysisThe First Passage Time (FPT) Distribution Analysis indicator is a sophisticated probabilistic tool that answers one of the most critical questions in trading: "How long will it take for price to reach my target, and what are the odds of getting there first?"
Unlike traditional technical indicators

See all indicators and strategies
Community trends
GME: Bearish StructureAt $22.29, GME is not a dip. It’s a falling knife!
A close below $21.50 could trigger stop-loss cascades.
The combination of:
Bearish Patterns, broken trendline, low volume
Dilution overhang
Crypto beta risk (BTC proxy)
No growth narrative
Do your own research and trade at your own risk.

Meta long Meta dumped on earnings because of a one time tax event. I have long been following this company and have missed obvious setups multiple times. We are right at the .5 fib. This megaphone was drawn on the monthly chart but I zoomed in to show the swing trade setup I am looking at.
We note a basing O

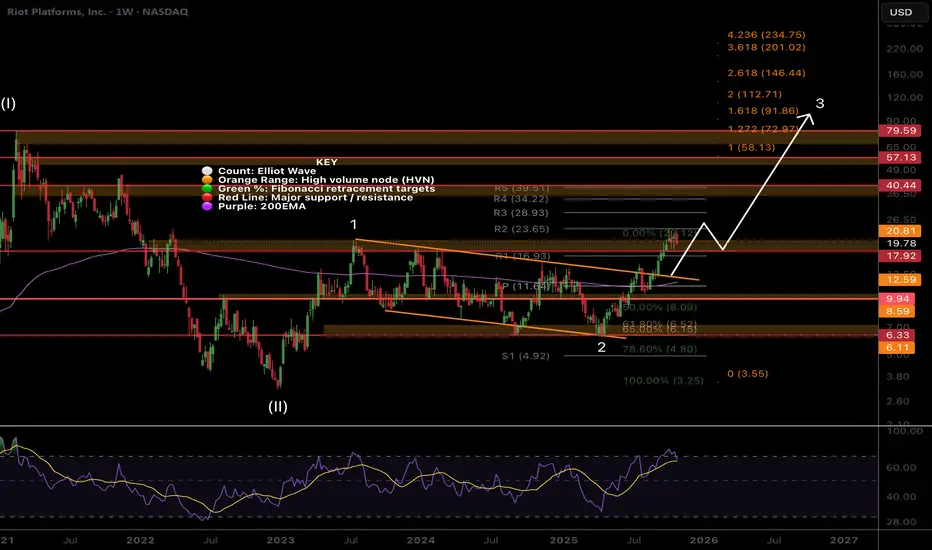
RIOT, nothing changed, Higher...Riot is another low cap volatile asset that keeps people afraid with its wild swings as I am seeing panic in my comments across platforms.
Price remains in momentum breaking out of the channel in a wave 3 with a minimum target of the 1.618 Fibonacci extension at $91, a 4x from here. Wave 2 complete
NVDA How to become successful in forex and stock trading:
1.Master fundamentals and technical analysis.
2.Build and follow a solid trading plan.
3.Apply strict risk management (4–6% rule).
4.Stay disciplined—control fear and greed.
5.Record and analyze every trade.
6.Focus on high-quality setups only.
7.

Nvidia Daily Outlook!NVDA is in an uptrend! Those who are already holding the stock can use $200 as a stop loss for short-term traders. Long-term traders can use $176 as a stop loss if the price falls below $176, it breaks below the short-term channel, which could push the price down first to the 200-day EMA(156.50$)

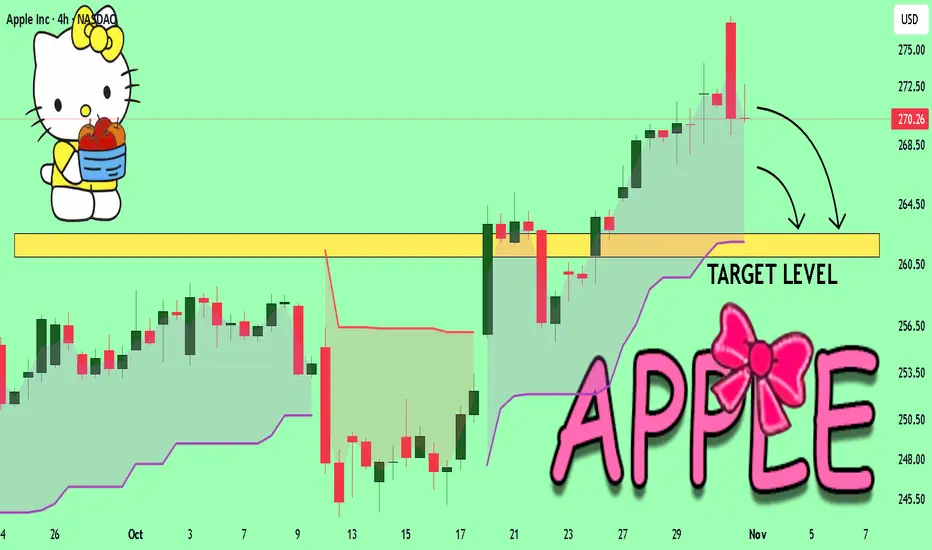
APPLE Set To Fall! SELL!
My dear subscribers,
APPLE looks like it will make a good move, and here are the details:
The market is trading on 270.26 pivot level.
Bias - Bearish
Technical Indicators: Both Super Trend & Pivot HL indicate a highly probable Bearish continuation.
Target - 262.56
About Used Indicators:
The
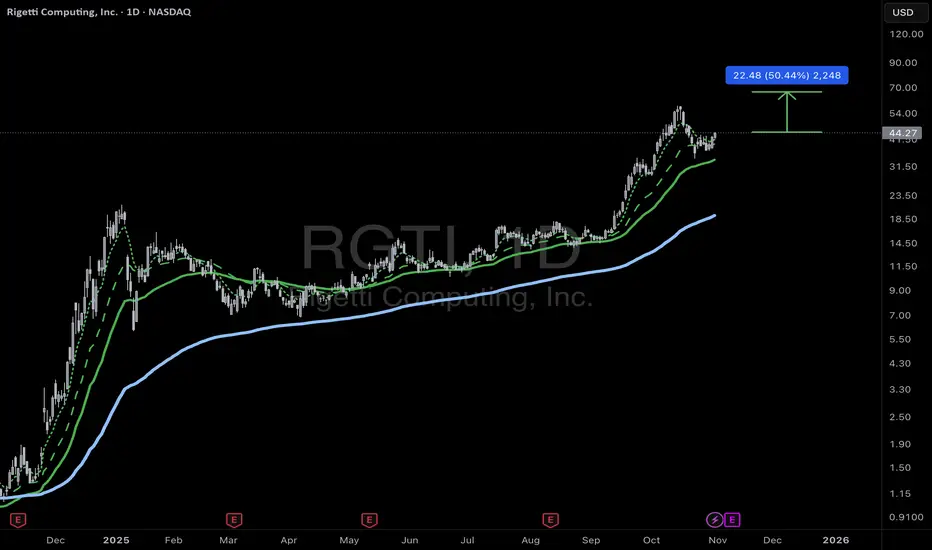
RGTI - quantum computing on the move?Rigetti RGTI beginning a 50% move? New technology requires more and more computing power. Quantum computing is the next frontier. Is the risk work the return?
PLTR: Earnings week!My thoughts on PLTR into earnings!
Hope you find it helpful, but as always not advice!
Safe trades everyone and enjoy your weekend!
S(t) = E f_t]
(new pretentious signature ;))

Buy when its still CHEAPClassic Cup-and-Handle Breakout NASDAQ:SOFI
The chart is showing a textbook cup-and-handle pattern, one of the strongest bullish continuation signals in technical analysis. SoFi pushed through years of long-term resistance with surging volume, then consolidated neatly at highs (the “handle”)—the

Amazon (AMZN): Ready for a New Breakout!Amazon isn’t just delivering packages — it’s delivering earnings surprises and a chart breakout too! 😎
After reporting strong Q3 earnings on 30 Oct 2025 , AMZN’s chart popped with a clean cup & handle breakout on 31 Oct 2025 — just in time for a bullish Halloween rally 🎃🐂
💰 Earnings Highligh

See all stocks ideas
Tomorrow
MDPediatrix Medical Group, Inc.
Actual
—
Estimate
0.47
USD
Tomorrow
LLoews Corporation
Actual
—
Estimate
—
Tomorrow
FRPTFreshpet, Inc.
Actual
—
Estimate
0.42
USD
Tomorrow
IDXXIDEXX Laboratories, Inc.
Actual
—
Estimate
3.14
USD
Tomorrow
LQDALiquidia Corporation
Actual
—
Estimate
−0.39
USD
Tomorrow
IIIInformation Services Group, Inc.
Actual
—
Estimate
0.04
USD
Tomorrow
KTBKontoor Brands, Inc.
Actual
—
Estimate
1.36
USD
Tomorrow
VGZVista Gold Corp
Actual
—
Estimate
—
See more events
Community trends
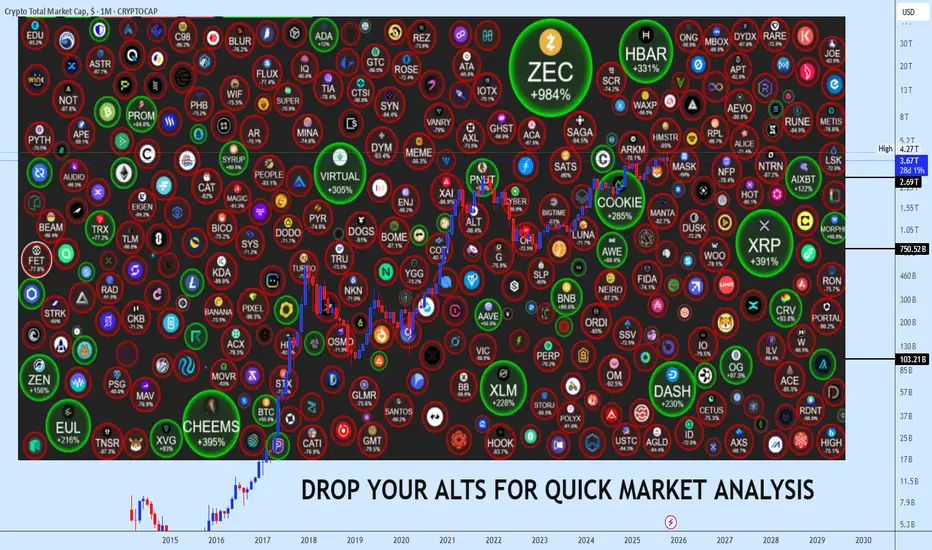
November Alts Request Window Now OpenFamily, November isn’t just another month, it’s decision time. We’re standing at the edge of the 4-year cycle’s final act, where altcoins will either explode into new expansions or vanish in liquidity drains. Every choice from here carries weight this selection window could decide the next cycle’s b
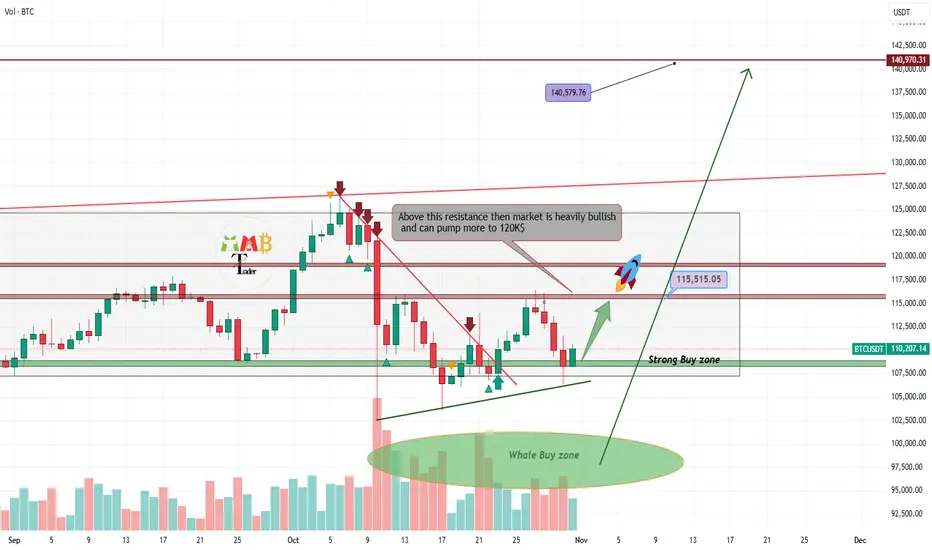
Bitcoin soon will hit 140K$ as new ATHAs the chart illustrates, Bitcoin continues to consolidate within a well-defined range, bounded by the key support at $100,000 and the significant resistance at $117,000. Periods of such compression are typically followed by a decisive directional move, which establishes a new trend path.
Our analy
Have we seen this before? Charting noob here. Perhaps someone with more experience can let me know if I'm just seeing things my mind wants me to see.
Over the past consolidation phases in this cycle, we've seen BTCUSD follow a very similar pattern before a breakout. It looks like we're in the same pattern again.
RSI also

Bitcoin’s Decentralization Is a Lie - Here’s the ProofYou’ve Been Fooled For Years
The narrative: Bitcoin is "decentralized money," free from banks, governments, and corporate control. A financial revolution for the people.
The reality: Bitcoin is one of the most centralized, surveilled, and manipulated financial systems in existence, and the publi

ZKUSDT - Don't waste this opportunity!Did you know that ZK dropped more than 98.5% from its peak in December 2024 until October 10, 2025?
If you can’t imagine what that means, let me explain:
Coins that experience such a massive drop usually get delisted and die off—they rarely recover.
But ZK surged over 1,300% from its October 10 bo

Head and shoulders triangle. Possible dump sub $100,000 in play.Our sell signals came in at top (126k) and last high for right shoulder. Looks like BTC will play within this pattern. Squeeze between max 113.5k and the 106k-104k bottom area (depending ion when it gets there) where it needs to make a decision: Either strong bounce and break to upside with possible

BTCUSDT: Buyers Aim for Recovery Toward $115K ResistanceHello everyone, here is my breakdown of the current Bitcoin setup.
Market Analysis
Bitcoin (BTCUSDT) is showing a constructive bullish setup after rebounding from the 106,600–107,000 Support Zone. This area has consistently acted as a strong demand region, confirming buyers’ interest each time pr

ETHUSDT: Short-Term Pullback Toward Trendline Before PotentialHi guys!
On the current 1h chart, Ethereum shows a clear structure of recovery following a liquidity sweep marked as “Hunting happened.” This move indicates that liquidity below the previous lows has already been collected, creating a potential base for a short-term bullish correction.
Price is cu

Bitcoin 2025-2029 CycleLikely bitcoin price movement for the rest of 2025 to the bear market bottom of 2026/27 and finally to the next bull peak of 2029
Check in early 2027 for accuracy

Dash on the Move — Bulls ApproveI expect DASH to rise toward 52, then 56, and later 68.
Two possible paths:
either it reaches 52, makes a pullback to current levels, and then moves up to 56,
or it goes straight to 56 without a pause.
In both cases, this move is part of a corrective triangle ABCDE,
with an upside breakout expected

See all crypto ideas
XAUUSDHello Traders! 👋
What are your thoughts on GOLD?
Gold has entered a sideways and choppy phase after reaching a new high and undergoing a correction.
The price is now consolidating within a narrow range between support and resistance, showing limited directional momentum in the short term.
In this

GOLD 1H CHART ROUTE MAP UPDATE & TRADING PLAN FOR THE WEEKHey Everyone,
Please see our updated 1h chart levels and targets for the coming week.
We are seeing price play between two weighted levels with a gap above at 4042 and a gap below at 3992. We will need to see ema5 cross and lock on either weighted level to determine the next range.
We will see le

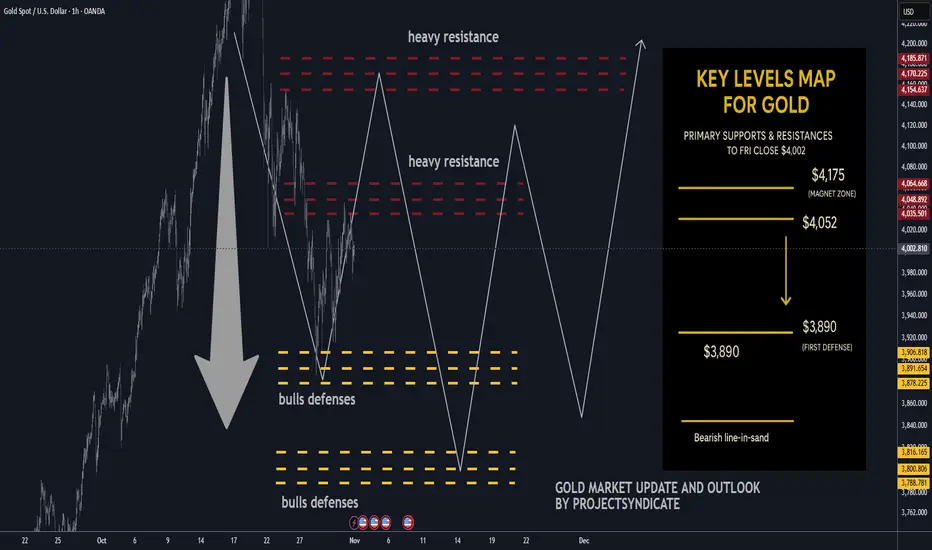
Gold next week: Key S/R Levels and Outlook for Traders🔥 GOLD WEEKLY SNAPSHOT — BY PROJECTSYNDICATE
🏆 High/Close: $4,108 → ~$4,002 — sellers defended overhead; weekly close soft within range.
📈 Trend: Neutral / correction mode still ON; not expecting new highs near term.
🛡 Supports: $3,890 → $3,800 — pivotal shelves for downside containment.
🚧 Resista
Gold Nears Resistance — Buyers Target $4,130 BreakoutHello traders, here’s my current outlook on Gold (XAUUSD). The market structure shows that Gold has recently shifted from a sharp bearish phase into a short-term recovery pattern, finding solid demand near the $3,940–$3,950 Buyer Zone. After the last strong drop from the $4,130 Resistance Level, pri

XAUUSD Long: Demand Zone Holding, Eyes on $4,080Hello traders! Gold (XAUUSD) is currently showing a corrective phase within its broader bullish trend. After a strong rally from the $3,850 Demand Zone, price climbed steadily along the ascending Trend Line, forming higher highs and higher lows until reaching the $4,150–$4,180 Resistance Area. This
Wall Street Weekly Outlook - Week 45 2025 [03.11.- 07.11.2025]Wall Street Weekly Outlook - Week 45 2025
📅 November 3 – November 7, 2025
Let’s kick off an exciting new trading week — and a brand-new trading month! 🚀
Seasonal factors often play a major role in November and December, and I’ll break them down for you in this week’s video. 🎥📈
Sit back, enjo

GOLD → Consolidation. The fundamental backdrop is changing...FX:XAUUSD stabilizes after a week-long decline, failing to consolidate above $4050. The market is taking a pause before new impulses. Focus on 4030 and 3980...
Investors are closing positions before the end of the week and month, the reason being the uncertainty surrounding the deal with China

US CRUDE OIL (WTI): Bullish Move from Key LevelI am quite pleased with how 📈USOIL reacted on a significant horizontal support level on a 4-hour time frame.
Following this test, the pair started to consolidate and form a horizontal range.
A breakout above the resistance of this range provided a strong bullish signal.
We are currently seeing a

Where Will Gold Go Next Week? Weekly Price Review
On Friday (October 31), international gold prices fell due to a stronger dollar and increased market uncertainty regarding whether the Federal Reserve would further cut interest rates. However, gold is still on track for its third consecutive monthly gain. As of this writing, spot gold was down 0.5

XAU/USD 1H – Bearish Liquidity Sweep Toward BPR Zonepotential shift from a bullish (upward) to a bearish (downward) trend, outlining a clear trade entry area and target:
Prior Trend: The price action leading up to the structural change shows an upward move, indicative of a bullish phase.
Bearish CHOCH (Change of Character): This is the critical sig

See all futures ideas
EURUSD: Bearish Channel Continuation SetupHi guys!
The EURUSD pair continues to trade within a well-defined descending channel. This confirms that the broader market structure remains bearish.
Important Levels
Resistance Zone: 1.1535 – 1.1550
Resistance Line: Aligns with the top of the highlighted resistance zone and channel structure

GBPAUD Textbook Bear FlagGBPAUD price had been falling sharply, sellers were in full control, driving the market lower with strong bearish momentum.
Then came a pause. Price started climbing slowly, forming a rising channel. That’s the bear flag. Buyers are trying to recover, but it is weak and hesitant, every push higher

AUDUSD Breakout and Potential Retrace!Hey Traders, in today's trading session we are monitoring AUDUSD for a selling opportunity around 0.65800 zone, AUDUSD was trading in an uptrend and currently is in a correction phase in which it is approaching the retrace area at 0.65800 support and resistance area.
Trade safe, Joe.

NZDJPY near one of the major buy zonesThe NZD/JPY is currently approaching the previously breached trendline resistance, which has now transitioned into a key support level. This retest of the former resistance-turned-support presents a favorable opportunity to consider long positions. We will initiate a long trade within this support z

EURUSD Short: Sellers Targeting Move Toward 1.1480 SupportHello traders! EURUSD continues to move within a clear bearish structure after facing strong rejection from the 1.1660 Supply Zone. The pair recently formed a Pivot Point at the top of the Ascending Channel, where a Fake Breakout signaled exhaustion among buyers and triggered renewed selling pressur

GBPUSD: Drops Sharply After Breaking Key Support👋Hello traders , what’s your view on FX:GBPUSD ?
The GBP/USD pair continues its bearish momentum in the first sessions of November, currently trading around the 1.314 zone after failing to hold the key 1.326 support — which has now turned into new resistance.
On the 4H technical chart, the desce
USDJPY 4H Long – Dollar Strength Holds Post FOMCPrice is consolidating near resistance after a strong bullish leg. USD sentiment shifted as the Fed dismissed potential rate-cut speculation, reinforcing dollar strength.
Liquidity sits below the 153.60 area, where prior resistance now acts as support. A sweep into this zone could trigger continuati

EURUSD Weekly Forecast
My outlook for next week is still bearish, until we hit the area that started the whole upward move.
October ended with a swing high forming and a bearish candle close, which means we might see a fourth continuation candle.
Since the weekly candle broke through the EQL, we're probably going to

GBPJPY | Dual Scenario Plan–Sell from Supply or Buy from DemandGBPJPY is currently trading within a corrective phase after a strong bearish impulse move. The market structure on higher timeframes still remains bearish, but the recent price action is showing signs of retracement and internal correction, giving us a possible setup for both sell and buy scenarios

EURO FUTURES (6E) – Weekly Structural OutlookBias: Short (Macro Caution)
Structural Context
Price is currently trading above the 75% Premium line, signaling overvaluation within the weekly dealing range.
To extend this framework, we can introduce the concept of “Extreme Premium”, symmetrical to the Deep Discount (75%), projected at 75% of t

See all forex ideas
| - | - | - | - | - | - | - | ||
| - | - | - | - | - | - | - | ||
| - | - | - | - | - | - | - | ||
| - | - | - | - | - | - | - | ||
| - | - | - | - | - | - | - | ||
| - | - | - | - | - | - | - | ||
| - | - | - | - | - | - | - | ||
| - | - | - | - | - | - | - |
Trade directly on the supercharts through our supported, fully-verified and user-reviewed brokers.


