Peak Tech Earnings Wrapped Up: Here Are the Winners and LosersWe're past that time when we all get glued to the dual-monitor setup and watch the titans of tech parade their financials.
Last week was the Super Bowl of earnings season, with Meta NASDAQ:META , Microsoft NASDAQ:MSFT , Alphabet NASDAQ:GOOGL , Apple NASDAQ:AAPL , and Amazon NASDAQ:AMZN all re

The best trades require research, then commitment.
Get started for free$0 forever, no credit card needed

Scott "Kidd" PoteetThe unlikely astronaut

Where the world does markets
Join 100 million traders and investors taking the future into their own hands.

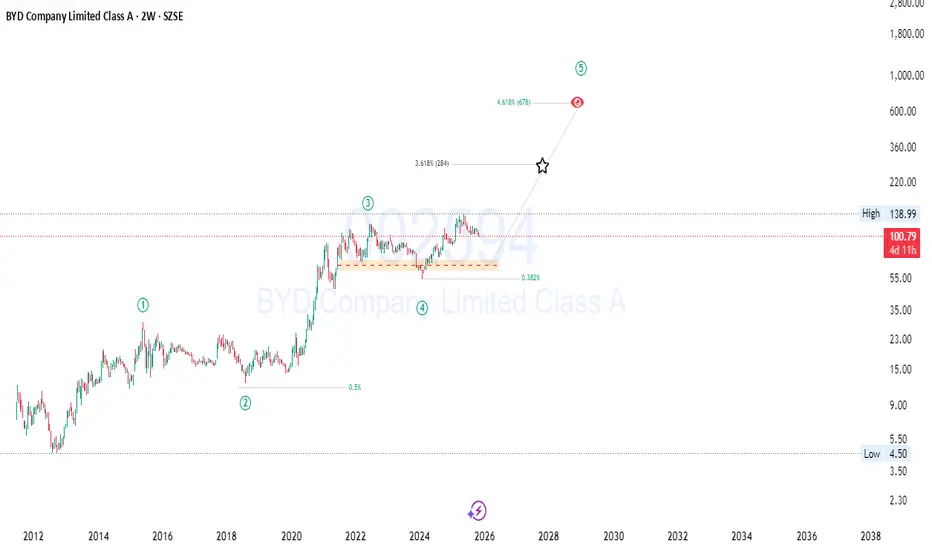
BYD : Smart Money Loading Before a Massive Wave 5 Breakout🚀 BYD Company Limited Class A (SZSE: 002594) — Wave 5 Expansion Setup
Big structure, clean levels, and solid fundamentals… Wave 5 might surprise a lot of people 👇
BYD has been quietly building strength, and the chart now suggests that the next major bullish wave could be setting up. After a
Busy trading week coming up!!The trading week of November 3–7 is considered a pivotal period for international financial markets. A series of high-level economic data including manufacturing and services PMIs, ADP non-farm payrolls, trade balances, and interest rate decisions from major central banks will create a mixed picture

EUR/AUD downside pressure intensifiesEUR/AUD finds itself just above a key zone consisting of horizontal support at 1.7600 and the key 200-day moving average, providing decent two-way trade setups depending on how the near-term price action evolves.
Should we see a break and close beneath both levels, it would allow for shorts to be e

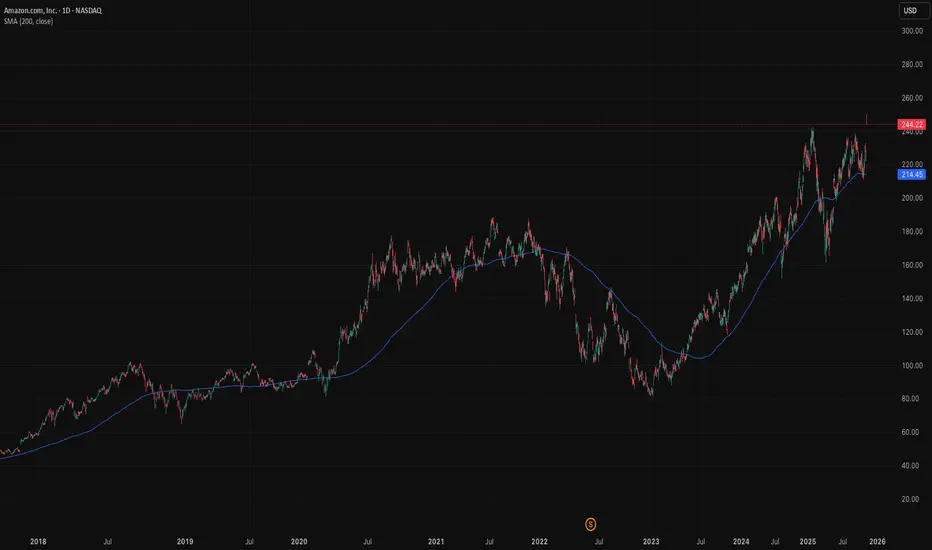
Bullish on Amazon as the tide turns backAmazon’s recent job cuts aren’t a sign of weakness, they’re a strategic recalibration. The company is shifting from broad expansion to focused execution. In the AI era, scale isn’t just about size, it’s about precision.
Amazon has trimmed roles across Alexa, devices, and some corporate functions. T
EUR/USD Under PressureEUR/USD Under Pressure
Today, the EUR/USD pair is trading around 1.1560, close to autumn lows. From this week’s high, the pair has fallen by roughly 0.85%, reflecting bearish pressure.
The main factors driving the decline are traders’ reactions to central bank signals:
→ Hawkish Fed rhetoric: On

NVIDIA – A New World First, Where Next?A mere 24 hours after Apple become the third company in history to reach a $4 trillion valuation, NVIDIA set a new benchmark by becoming the first company ever to register a market capitalisation of $5 trillion.
Despite concerns about over extended valuations, the news flow for NVIDIA was initiall

META: Next Long Term Buy Following a disappointing earnings report, Meta (META) dropped more than 10% in post-market trading, decisively breaking through several key support levels. My primary support zones are typically derived from anchored VWAPs (Volume-Weighted Average Prices), which help identify where institutional bu

XAUUSD Long: Demand Zone Holding, Eyes on $4,080Hello traders! Gold (XAUUSD) is currently showing a corrective phase within its broader bullish trend. After a strong rally from the $3,850 Demand Zone, price climbed steadily along the ascending Trend Line, forming higher highs and higher lows until reaching the $4,150–$4,180 Resistance Area. This

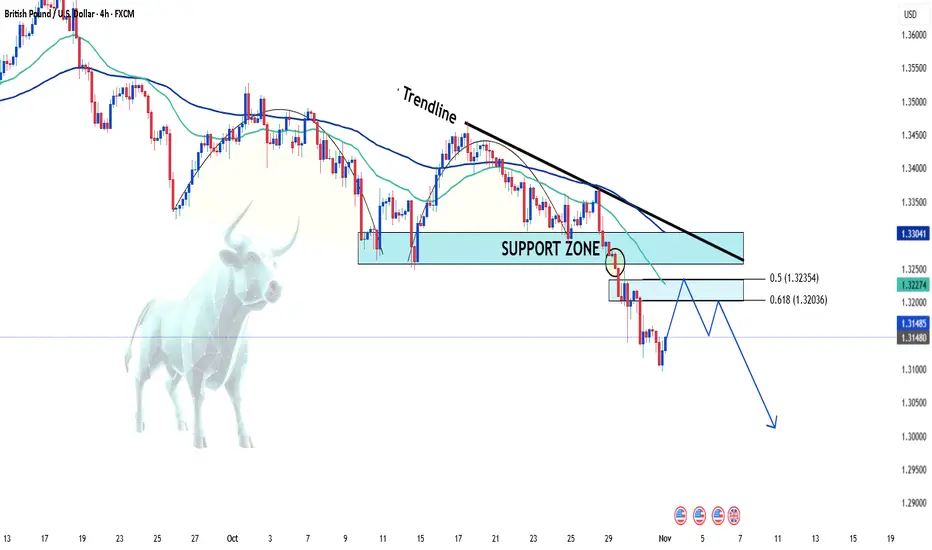
GBPUSD: Drops Sharply After Breaking Key Support👋Hello traders , what’s your view on FX:GBPUSD ?
The GBP/USD pair continues its bearish momentum in the first sessions of November, currently trading around the 1.314 zone after failing to hold the key 1.326 support — which has now turned into new resistance.
On the 4H technical chart, the desce
See all editors' picks ideas
LogNormalLibrary "LogNormal"
A collection of functions used to model skewed distributions as log-normal.
Prices are commonly modeled using log-normal distributions (ie. Black-Scholes) because they exhibit multiplicative changes with long tails; skewed exponential growth and high variance. This approach i

Range Oscillator (Zeiierman)█ Overview
Range Oscillator (Zeiierman) is a dynamic market oscillator designed to visualize how far the price is trading relative to its equilibrium range. Instead of relying on traditional overbought/oversold thresholds, it uses adaptive range detection and heatmap coloring to reveal where pri

Volume Surprise [LuxAlgo]The Volume Surprise tool displays the trading volume alongside the expected volume at that time, allowing users to spot unexpected trading activity on the chart easily.
The tool includes an extrapolation of the estimated volume for future periods, allowing forecasting future trading activity.
🔶 U

Smooth Theil-SenI wanted to build a Theil-Sen estimator that could run on more than one bar and produce smoother output than the standard implementation. Theil-Sen regression is a non-parametric method that calculates the median slope between all pairs of points in your dataset, which makes it extremely robust to o

Fair Value Gaps by DGTFair Value Gaps
A refined, multi-timeframe Fair Value Gap (FVG) detection tool that brings institutional imbalance zones to life directly on your chart.
Designed for precision, it visualizes how price delivers into inefficiencies across chart, higher, and lower (intrabar) timeframes — offering a fl

TASC 2025.11 The Points and Line Chart█ OVERVIEW
This script implements the Points and Line Chart described by Mohamed Ashraf Mahfouz and Mohamed Meregy in the November 2025 edition of the TASC Traders' Tips , "Efficient Display of Irregular Time Series”. This novel chart type interprets regular time series chart data to create an ir

Simplified Percentile ClusteringSimplified Percentile Clustering (SPC) is a clustering system for trend regime analysis.
Instead of relying on heavy iterative algorithms such as k-means, SPC takes a deterministic approach: it uses percentiles and running averages to form cluster centers directly from the data, producing smoo

Adaptive Volume Delta Map---
📊 Adaptive Volume Delta Map (AVDM)
What is Adaptive Volume Delta Map (AVDM)?
The Adaptive Volume Delta Map (AVDM) is a smart, multi-timeframe indicator that visualizes buy and sell volume imbalances directly on the chart.
It adapts automatically to the best available data resolution

Dynamic Equity Allocation Model"Cash is Trash"? Not Always. Here's Why Science Beats Guesswork.
Every retail trader knows the frustration: you draw support and resistance lines, you spot patterns, you follow market gurus on social media—and still, when the next bear market hits, your portfolio bleeds red. Meanwhile, institution

First Passage Time - Distribution AnalysisThe First Passage Time (FPT) Distribution Analysis indicator is a sophisticated probabilistic tool that answers one of the most critical questions in trading: "How long will it take for price to reach my target, and what are the odds of getting there first?"
Unlike traditional technical indicators

See all indicators and strategies
Community trends
Be patient to jump onto MetaMeta completed its grand cycle 3 on elliot wave structure and entering onto wave 4 now. Wave 4 typically retraces to 0.618 or 0.5 levels of wave 3 which is the zone marked in the box.
That zone is also a demand zone and 500 level is the long standing trend line level. If you are eyeing an entry, be

CoinbaseI am tracking two possible counts with three possible pathways. The two counts suggest we continue lower in minor C or move up for a minimal high in the $411 - $427 area. The move lower is what has two possible pathways it could take. The first is that it continues lower from here which suggests tha

NVDA How to become successful in forex and stock trading:
1.Master fundamentals and technical analysis.
2.Build and follow a solid trading plan.
3.Apply strict risk management (4–6% rule).
4.Stay disciplined—control fear and greed.
5.Record and analyze every trade.
6.Focus on high-quality setups only.
7.

Bullish on Amazon as the tide turns backAmazon’s recent job cuts aren’t a sign of weakness, they’re a strategic recalibration. The company is shifting from broad expansion to focused execution. In the AI era, scale isn’t just about size, it’s about precision.
Amazon has trimmed roles across Alexa, devices, and some corporate functions. T
PLTR: Earnings week!My thoughts on PLTR into earnings!
Hope you find it helpful, but as always not advice!
Safe trades everyone and enjoy your weekend!
S(t) = E f_t]
(new pretentious signature ;))

LightWhenever I prepare an idea to publish, well... I don't prepare.
As you may already have realized, my "blog" is not about trading / investment analysis. It is an attempt of mine to describe the indescribable. To smell the un-smellable (like a Greek song said).
My first ideas were an attempt of mine

Nvidia Daily Outlook!NVDA is in an uptrend! Those who are already holding the stock can use $200 as a stop loss for short-term traders. Long-term traders can use $176 as a stop loss if the price falls below $176, it breaks below the short-term channel, which could push the price down first to the 200-day EMA(156.50$)

GME: Bearish StructureAt $22.29, GME is not a dip. It’s a falling knife!
A close below $21.50 could trigger stop-loss cascades.
The combination of:
Bearish Patterns, broken trendline, low volume
Dilution overhang
Crypto beta risk (BTC proxy)
No growth narrative
Do your own research and trade at your own risk.

AMAZONAMAZON has done exactly what we expected, now we will wait for correction to finish in this week for further upside.
Disclosure: We are part of Trade Nation's Influencer program and receive a monthly fee for using their TradingView charts in our analysis.

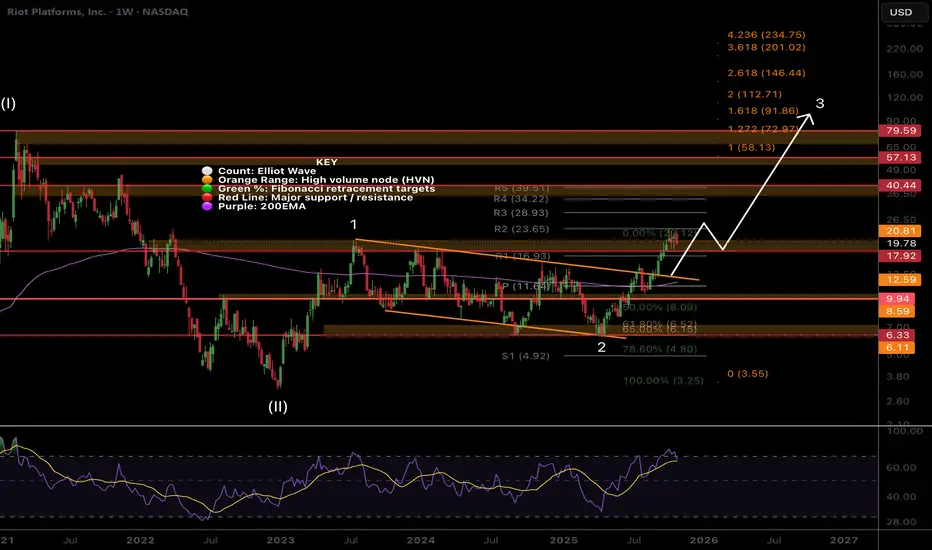
RIOT, nothing changed, Higher...Riot is another low cap volatile asset that keeps people afraid with its wild swings as I am seeing panic in my comments across platforms.
Price remains in momentum breaking out of the channel in a wave 3 with a minimum target of the 1.618 Fibonacci extension at $91, a 4x from here. Wave 2 complete
See all stocks ideas
Today
KOSKosmos Energy Ltd.
Actual
−0.15
USD
Estimate
−0.12
USD
Today
MDPediatrix Medical Group, Inc.
Actual
—
Estimate
0.47
USD
Today
LLoews Corporation
Actual
—
Estimate
—
Today
LQDALiquidia Corporation
Actual
—
Estimate
−0.39
USD
Today
IDXXIDEXX Laboratories, Inc.
Actual
—
Estimate
3.14
USD
Today
FRPTFreshpet, Inc.
Actual
—
Estimate
0.42
USD
Today
IIIInformation Services Group, Inc.
Actual
—
Estimate
0.04
USD
Today
KTBKontoor Brands, Inc.
Actual
—
Estimate
1.36
USD
See more events
Community trends
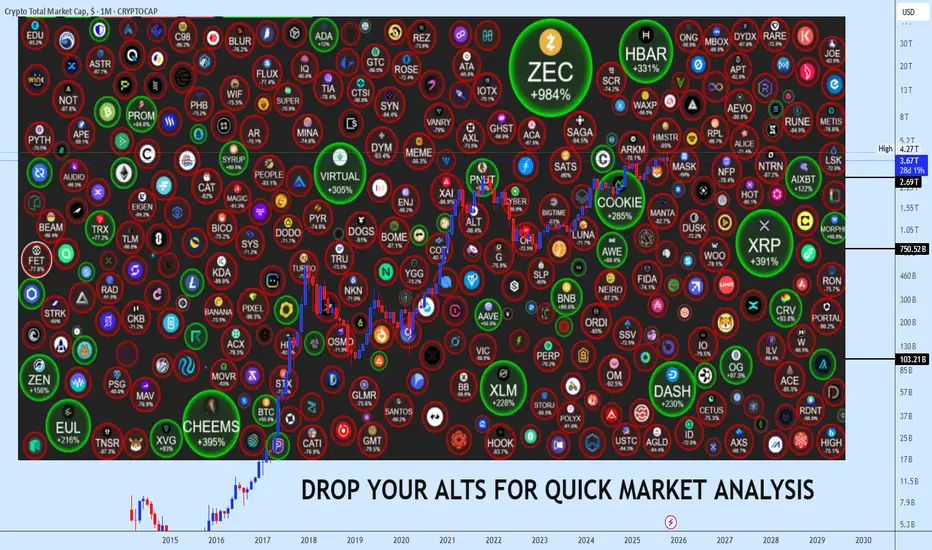
November Alts Request Window Now OpenFamily, November isn’t just another month, it’s decision time. We’re standing at the edge of the 4-year cycle’s final act, where altcoins will either explode into new expansions or vanish in liquidity drains. Every choice from here carries weight this selection window could decide the next cycle’s b
ETHUSDT: Short-Term Pullback Toward Trendline Before PotentialHi guys!
On the current 1h chart, Ethereum shows a clear structure of recovery following a liquidity sweep marked as “Hunting happened.” This move indicates that liquidity below the previous lows has already been collected, creating a potential base for a short-term bullish correction.
Price is cu

Bitcoin Bullish Breakout Toward 112,000 TargetBitcoin (BTC/USD) is showing bullish momentum, trading above the trend line support. The price is targeting the 112,000 level, with potential resistance zones ahead. A sustained move above 110,000 could confirm further upside continuation.

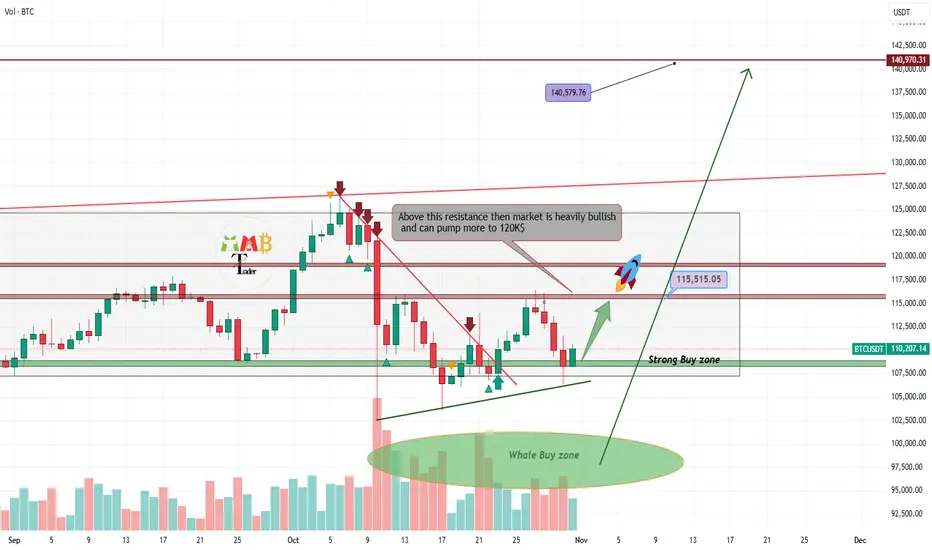
BTCUSDT: Buyers Aim for Recovery Toward $115K ResistanceHello everyone, here is my breakdown of the current Bitcoin setup.
Market Analysis
Bitcoin (BTCUSDT) is showing a constructive bullish setup after rebounding from the 106,600–107,000 Support Zone. This area has consistently acted as a strong demand region, confirming buyers’ interest each time pr

Woof Woof — Bulls on the Roof?I’m expecting Dogecoin to rise from the current levels toward 0.20400 🎯
❌The invalidation zone for this plan is set at 0.18375
Let’s see if the bulls can push it higher from here 🐶🚀

Bitcoin soon will hit 140K$ as new ATHAs the chart illustrates, Bitcoin continues to consolidate within a well-defined range, bounded by the key support at $100,000 and the significant resistance at $117,000. Periods of such compression are typically followed by a decisive directional move, which establishes a new trend path.
Our analy
ZKUSDT - Don't waste this opportunity!Did you know that ZK dropped more than 98.5% from its peak in December 2024 until October 10, 2025?
If you can’t imagine what that means, let me explain:
Coins that experience such a massive drop usually get delisted and die off—they rarely recover.
But ZK surged over 1,300% from its October 10 bo

ETHEREUM: $4,250 Target in Sight Amid Wide Consolidation 📈ETHEREUM is currently undergoing a consolidation phase.
The price is stuck within a wide horizontal channel on the 4-hour timeframe.
We see a strong positive bullish reaction at its support level, leading to a bounce and the formation of a minor resistance.
The violation of this minor resistance

Bitcoin’s Decentralization Is a Lie - Here’s the ProofYou’ve Been Fooled For Years
The narrative: Bitcoin is "decentralized money," free from banks, governments, and corporate control. A financial revolution for the people.
The reality: Bitcoin is one of the most centralized, surveilled, and manipulated financial systems in existence, and the publi

BTCUSD Buyers Take ControlBitcoin is entering a renewed bullish phase as market structure strengthens and buyer activity intensifies. After a prolonged consolidation period, price behavior reflects accumulation dynamics — a typical precursor to sustained upward expansion. The transition from neutral to bullish momentum sugge

See all crypto ideas
XAUUSDHello Traders! 👋
What are your thoughts on GOLD?
Gold has entered a sideways and choppy phase after reaching a new high and undergoing a correction.
The price is now consolidating within a narrow range between support and resistance, showing limited directional momentum in the short term.
In this

GOLD 1H CHART ROUTE MAP UPDATE & TRADING PLAN FOR THE WEEKHey Everyone,
Please see our updated 1h chart levels and targets for the coming week.
We are seeing price play between two weighted levels with a gap above at 4042 and a gap below at 3992. We will need to see ema5 cross and lock on either weighted level to determine the next range.
We will see le

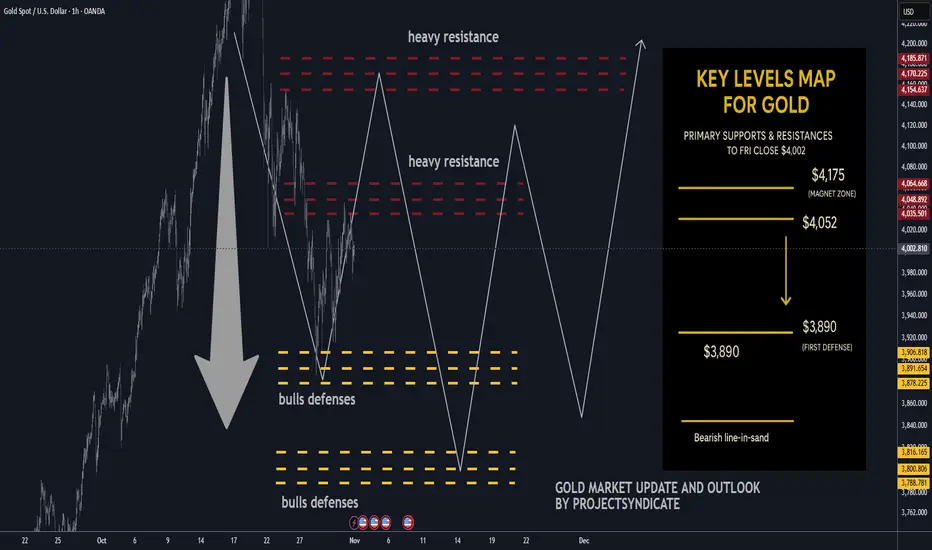
Gold next week: Key S/R Levels and Outlook for Traders🔥 GOLD WEEKLY SNAPSHOT — BY PROJECTSYNDICATE
🏆 High/Close: $4,108 → ~$4,002 — sellers defended overhead; weekly close soft within range.
📈 Trend: Neutral / correction mode still ON; not expecting new highs near term.
🛡 Supports: $3,890 → $3,800 — pivotal shelves for downside containment.
🚧 Resista
Gold Nears Resistance — Buyers Target $4,130 BreakoutHello traders, here’s my current outlook on Gold (XAUUSD). The market structure shows that Gold has recently shifted from a sharp bearish phase into a short-term recovery pattern, finding solid demand near the $3,940–$3,950 Buyer Zone. After the last strong drop from the $4,130 Resistance Level, pri

Lingrid | GOLD Weekly Market Outlook. Rally’s End or Reset?OANDA:XAUUSD explosive October rally — crowned by a historic monthly candle that shattered resistance and ignited euphoria — has now entered its reckoning phase. What looked like unstoppable momentum is now revealing signs of exhaustion. The sharp, volume-fueled drop toward $4,000 isn’t just a “hea

GOLD I Weekly CLS I Model 2 - Target 50% I Eventually ATH...Hi friends, new range created. As always we are looking for the manipulation in to the key level around the range. Don't forget confirmation switch from manipulation phase to the distribution phase to make the setup valid. Stay patient and enter only after change in order flow. If price reaches 50%

XAUUSD Long: Demand Zone Holding, Eyes on $4,080Hello traders! Gold (XAUUSD) is currently showing a corrective phase within its broader bullish trend. After a strong rally from the $3,850 Demand Zone, price climbed steadily along the ascending Trend Line, forming higher highs and higher lows until reaching the $4,150–$4,180 Resistance Area. This
THE KOG REPORTTHE KOG REPORT
Quick KOG Report this week.
Firstly, we would say it’s the first trading day of the new month so maybe an idea to let the market find it’s feet before jumping in. We’re only going to share the potential path this week and the red box target levels on the breaks. We’ll also stic

Busy trading week coming up!!The trading week of November 3–7 is considered a pivotal period for international financial markets. A series of high-level economic data including manufacturing and services PMIs, ADP non-farm payrolls, trade balances, and interest rate decisions from major central banks will create a mixed picture
Xauusd Price Bullish Continuation Toward Key Resistance Targets (XAU/USD) is showing bullish momentum above the support trend line. Price is expected to continue rising toward the targets at 4,020.081 and 4,037.929, as long as it holds above the trend line support.

See all futures ideas
EURUSD Short: Sellers Targeting Move Toward 1.1480 SupportHello traders! EURUSD continues to move within a clear bearish structure after facing strong rejection from the 1.1660 Supply Zone. The pair recently formed a Pivot Point at the top of the Ascending Channel, where a Fake Breakout signaled exhaustion among buyers and triggered renewed selling pressur

AUD/JPY - Bullish Flag (03.11.2025)🧠 Setup Overview:
AUD/JPY is forming a Bullish Flag Pattern on the 30-minute chart — a continuation setup suggesting potential upside momentum after consolidation. The price has respected the flag support zone and is attempting a breakout above the descending channel, signaling renewed bullish press

EURUSD: Sellers Take Control After Breaking TrendlineHello traders, what’s your view on EURUSD?
At the start of the new week, EUR/USD is trading around 1.153, continuing its downward correction after breaking the medium-term ascending trendline and failing to stay above the dynamic resistance zone 1.1600 – 1.1630. This movement indicates that sellers

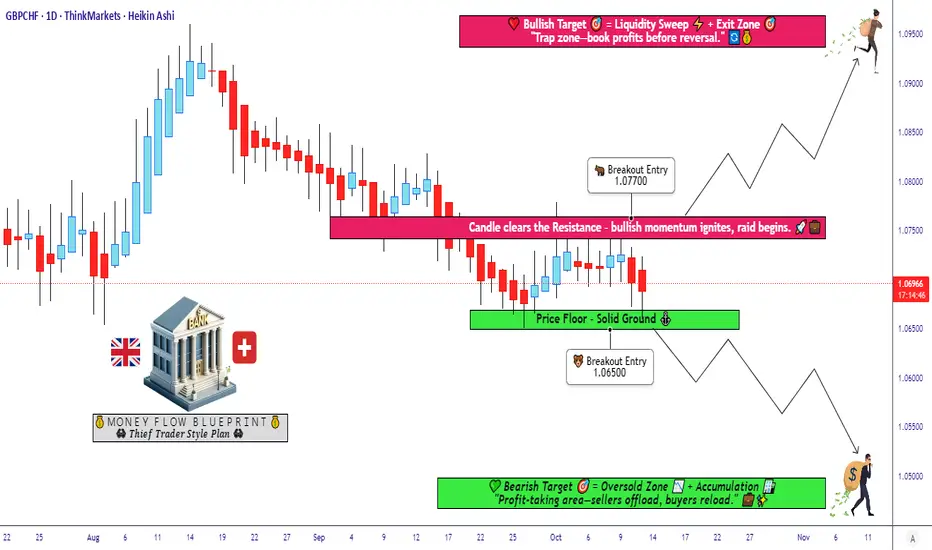
GBP/CHF: Ready for the Next Big Move? Dual Scenario Analysis💷 GBP/CHF “Pound Sterling vs Swiss Franc” — Forex Market Profit Playbook 🧠💰
Style: Swing / Day Trade
Bias: 🟢🔴 Flexible Bias — Ready for Either Breakout!
🎯 Trade Setup Overview
We’re watching GBP/CHF closely for a potential breakout opportunity on either side of the zone. The market’s preparing a mo
GBPJPY | Dual Scenario Plan–Sell from Supply or Buy from DemandGBPJPY is currently trading within a corrective phase after a strong bearish impulse move. The market structure on higher timeframes still remains bearish, but the recent price action is showing signs of retracement and internal correction, giving us a possible setup for both sell and buy scenarios

GBPUSD | Anticipating Buy sideGBPUSD has recently swept daily equal lows, collecting resting liquidity and tapping into a daily bullish order block. This confluence suggests the potential for a buyside reaction if price maintains structure above intraday support.
On the 1H timeframe, I’ll maintain a bullish bias as long as we d

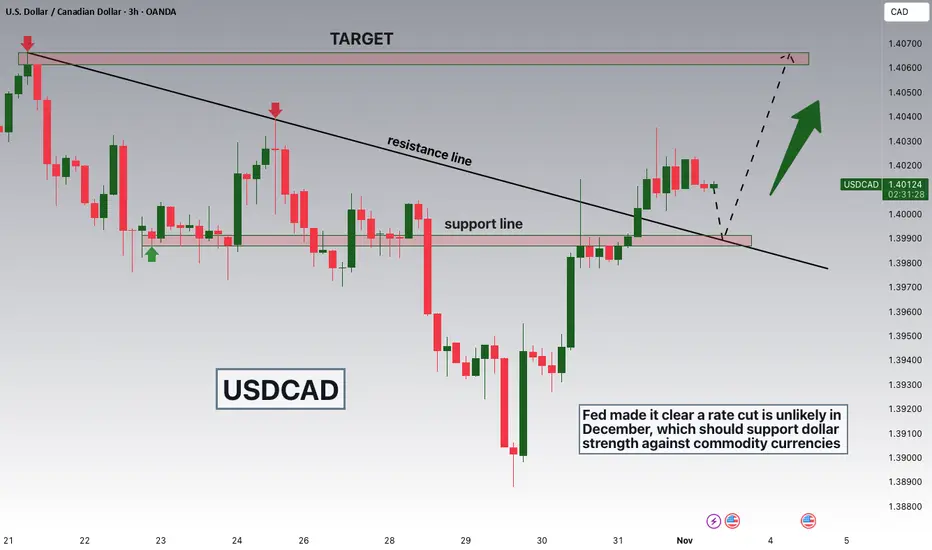
USDCAD Breakout and Potential RetraceHey Traders, in today's trading session we are monitoring USDCAD for a buying opportunity around 1.39900 zone, USDCAD was trading in a downtrend and successfully managed to break it out. Currently is in a correction phase in which it is approaching the retrace area at 1.39900 support and resistance
AUDUSD loadingAUDUSD is loading — and most people are asleep at the wheel. ⚙️
The setup’s too clean to ignore. Pressure’s building where no one’s looking.
Every candle’s a clue… if you can read it.
This isn’t noise — it’s a tell.
If you don’t see it yet, you will. 📈
Don’t wait till it’s obvious.
If you know, yo

AUDUSD-LONG IDEAAUDUSD is in bullish trend according to higher time frame. I have market the structure on the chart. it took a deep retracement of 0.79 fib level according to daily time frame.1h structure is also broken to the upside. Now it is retracing back according to 1 hour time frame. There is a gap in betwee

USDJPY Bullish BreakoutPrice is in strong uptrend we are looking for continuation trades to join the bullish momentum.
Price broke out strongly from resistance zone at (153.292 - 152.952).
Price entered into consolidation phase we are waiting for pullback to the key level to join the move.

See all forex ideas
| - | - | - | - | - | - | - | ||
| - | - | - | - | - | - | - | ||
| - | - | - | - | - | - | - | ||
| - | - | - | - | - | - | - | ||
| - | - | - | - | - | - | - | ||
| - | - | - | - | - | - | - | ||
| - | - | - | - | - | - | - | ||
| - | - | - | - | - | - | - |
Trade directly on the supercharts through our supported, fully-verified and user-reviewed brokers.


