Long bond bulls’ eye bigger breakoutThe bullish move in U.S. ultra-long bond futures anticipated last week has played out nicely, with the contract surging higher over the subsequent days, taking out a key topside hurdle comprising the 200DMA and horizontal resistance at 119’19. The move has now stalled at a downtrend from the highs s

The best trades require research, then commitment.
Get started for free$0 forever, no credit card needed

Scott "Kidd" PoteetThe unlikely astronaut

Where the world does markets
Join 100 million traders and investors taking the future into their own hands.
Major indices

Downtrend in Dell?Dell Technologies has lagged the market for months, and some traders may see further downside in the maker of computer hardware.
The first pattern on today’s chart is the bearish gap on August 29 following quarterly results. While earnings and revenue beat estimates, investors focused on weaker mar

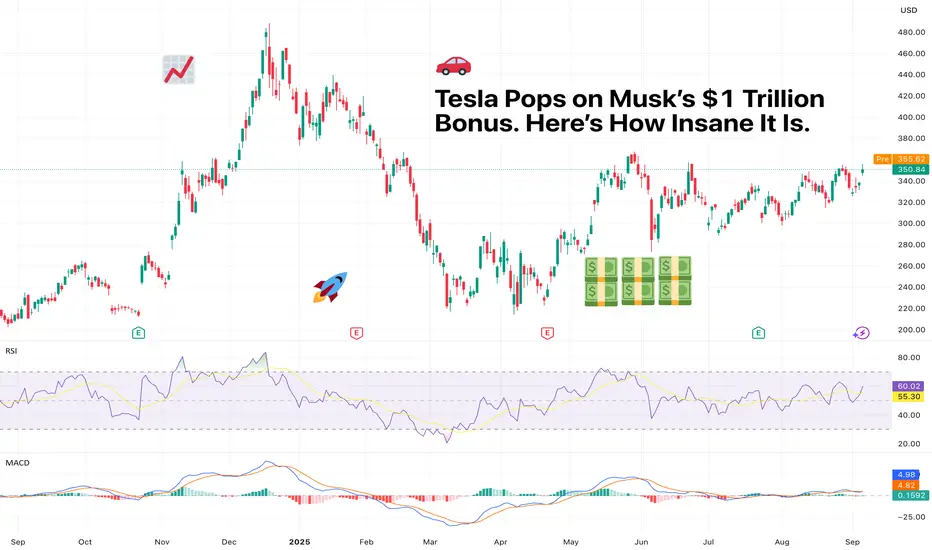
Tesla Pops on Musk’s $1 Trillion Bonus. Here’s How Insane It Is.The mother of all KPIs.
Elon Musk has a new carrot dangling in front of him, and it’s not a Mars colony or a flamethrower.
Tesla’s board is asking investors to approve a bonus so massive, so absurd, so galaxy-brained, that it makes past compensation packages look like pocket change.
Ready? We
NFP "Goldilocks" playbook? EURUSD triggers revealed!Markets are optimistic and consolidating ahead of the Non-Farm Payrolls (NFP) report, with EUR/USD poised for a breakout, plus a quick technical overview of gold, GBP/USD, and USD/JPY.
Mood : Buoyant—risk assets and equities are near weekly highs, bond yields are easing.
Consensus : A "Goldilocks

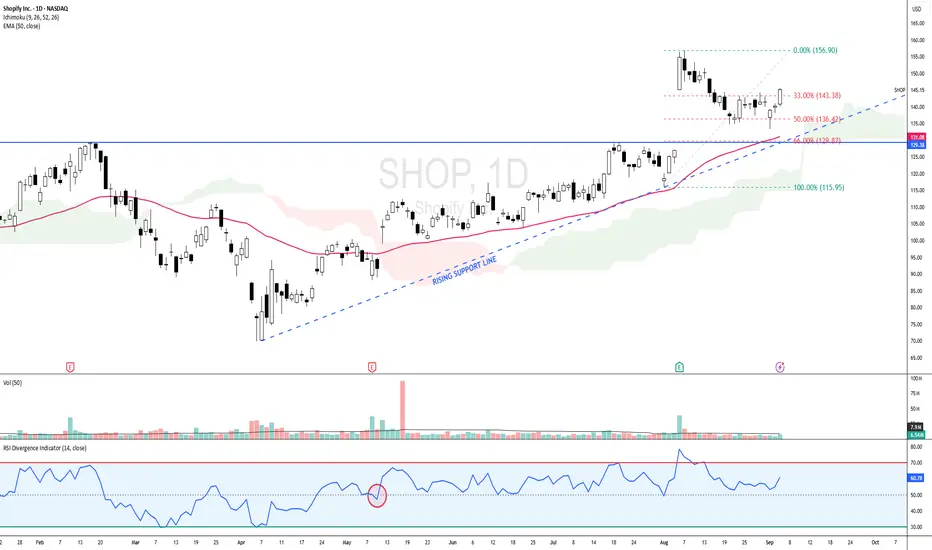
SHOP - BULLISH SCENARIO since 12 MAY 2025 SHOP - CURRENT PRICE : 145.15
SHOP is bullish as the share price is above 50-day EMA. Price action on 12 MAY 2025 is considered starting of bullish scenario because supported by several key indicators :
Share price gap up
Price broke out 50-day EMA
Price moving above ICHIMOKU CLOUD
RSI movin
TradingView Storytellers: Share Your Videos, Inspire TradersCalling all creators, chart wizards, and video storytellers.
👋 Hey traders !
We know many of you aren’t just analyzing the markets and trading — you’re teaching, creating, and inspiring others. We see you!
And now's your chance to get your content in the spotlight — share your best work with us
Bitcoin Rally Fades as Prices Nosedive. End of Bullish Cycle?Technical analysis will tell you that maybe it’s time for a pullback. But then again, this is crypto. It’s the wild west, where predictions are polite suggestions at best. Here’s what we know about where we are.
📉 Bitcoin Takes a Breather
Bitcoin BITSTAMP:BTCUSD started the week on a quieter n

Why Ethereum is Outperforming Bitcoin? | FX ResearchWhile Bitcoin did manage to push to a fresh record high, the broader august trend reflected cautious investor sentiment, supported by modest momentum and ongoing macro uncertainty. The narrative suggests price resilience, but without the forcefulness needed for the next wave of bullish momentum.
I

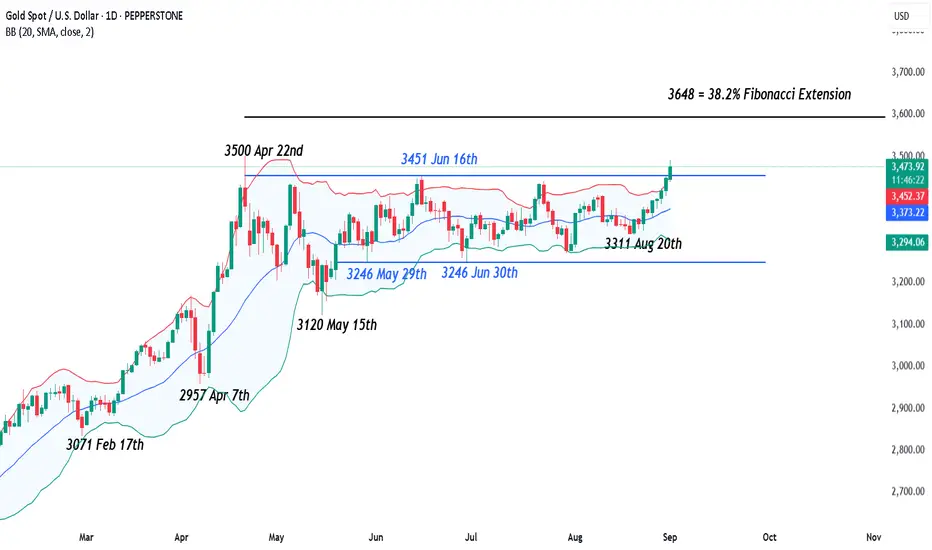
Gold – Breaking Out or Faking Out to Start September?Gold has been trading in a 3250-3450 range since the middle of May, but events last week saw prices test and close right at the top of that range on Friday. The drivers impacting this push higher in Gold, which could remain in play for traders in the first week of September, were numerous. These inc
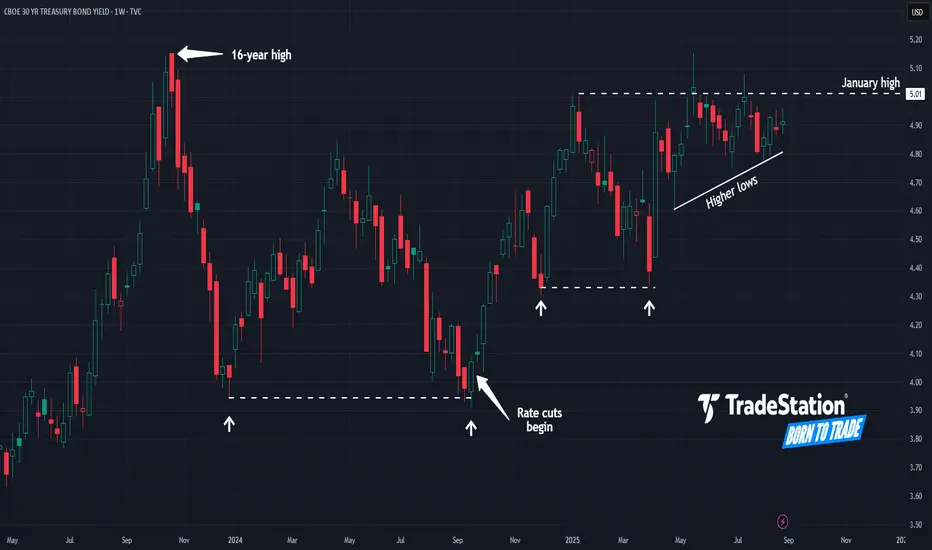
Fear and Loathing at the Long End?Sovereign bond rates have steadily crept higher since the pandemic, and some traders may worry about further upward pressure in the 30-year U.S. Treasury yield.
The first pattern on today’s weekly chart is the double bottom at roughly 3.95 percent in December 2023 and September 2024.
Second, TYX
See all editors' picks ideas
VWAP Price ChannelVWAP Price Channel cuts the crust off of a traditional price channel (Donchian Channel) by anchoring VWAPs at the highs and lows. By doing this, the flat levels, characteristic of traditional Donchian Channels, are no more!
Author's Note: This indicator is formed with no inherent use, and serves

Fibonacci Sequence Circles [BigBeluga]🔵 Overview
The Fibonacci Sequence Circles is a unique and visually intuitive indicator designed for the TradingView platform. It combines the principles of the Fibonacci sequence with geometric circles to help traders identify potential support and resistance levels, as well as price expansio

ATAI Volume Pressure Analyzer V 1.0 — Pure Up/DownATAI Volume Pressure Analyzer V 1.0 — Pure Up/Down
Overview
Volume is a foundational tool for understanding the supply–demand balance. Classic charts show only total volume and don’t tell us what portion came from buying (Up) versus selling (Down). The ATAI Volume Pressure Analyzer fills that g

Market Cap Landscape 3DHello, traders and creators! 👋
Market Cap Landscape 3D. This project is more than just a typical technical analysis tool; it's an exploration into what's possible when code meets artistry on the financial charts. It's a demonstration of how we can transcend flat, two-dimensional lines and step into

ZigzagLiteLibrary "ZigzagLite"
Lighter version of the Zigzag Library. Without indicators and sub-component divisions
method getPrices(pivots)
Gets the array of prices from array of Pivots
Namespace types: Pivot
Parameters:
pivots (Pivot ) : array array of Pivot objects
Returns: array array

ZigzagLibrary "Zigzag"
Zigzag related user defined types. Depends on DrawingTypes library for basic types
method tostring(this, sortKeys, sortOrder, includeKeys)
Converts ZigzagTypes/Pivot object to string representation
Namespace types: Pivot
Parameters:
this (Pivot) : ZigzagTypes/Pivot

Angled Volume Profile [Trendoscope]Volume profile is useful tool to understand the demand and supply zones on horizontal level. But, what if you want to measure the volume levels over trend line? In trending markets, the feature to measure volume over angled levels can be very useful for traders who use these measures. Here is an att

MathEasingFunctionsLibrary "MathEasingFunctions"
A collection of Easing functions.
Easing functions are commonly used for smoothing actions over time, They are used to smooth out the sharp edges
of a function and make it more pleasing to the eye, like for example the motion of a object through time.
Easing function

Treasury Yields Heatmap [By MUQWISHI]▋ INTRODUCTION :
The “Treasury Yields Heatmap” generates a dynamic heat map table, showing treasury yield bond values corresponding with dates. In the last column, it presents the status of the yield curve, discerning whether it’s in a normal, flat, or inverted configuration, which determined by us

Time & Sales (Tape) [By MUQWISHI]▋ INTRODUCTION :
The “Time and Sales” (Tape) indicator generates trade data, including time, direction, price, and volume for each executed trade on an exchange. This information is typically delivered in real-time on a tick-by-tick basis or lower timeframe, providing insights into the traded size

See all indicators and strategies
Community trends
ORCL Earnings Put Play $205 Puts – Are You In?
# 🔥 ORCL Earnings Play – Bearish Tail Hedge 🚨
**📊 Setup:** Oracle (ORCL) – Earnings 09/09 AMC
**🎯 Direction:** PUT (Short Bias)
**💵 Entry:** \$0.93 (205 Put)
**🛑 Stop:** \$0.47 (−50%)
**🎯 Target:** \$2.79 (+300%)
**📅 Expiry:** 2025-09-12
**📈 Confidence:** 66%
---
### ⚡ Why this trade?
* 📉 Weak

Alibaba - Here we have the final bottom!🏮Alibaba ( NYSE:BABA ) finally created its bottom:
🔎Analysis summary:
As we are speaking, Alibaba finally managed to create a long term bottom formation. Specifically with the recent bullish break and retest, bulls are picking up momentum. We just have to see a break above the current key res

AAPL Eyes $300—Bullish Breakout in PlayAAPL Eyes $300—Bullish Breakout in Play
AAPL could reach $300 in the coming months.
Since our last update, the stock has climbed nearly 20%, rising from $200 to $240.
It recently broke out of a small triangle pattern, showing strong bullish momentum. This breakout suggests the rally may continu

Tesla Pops on Musk’s $1 Trillion Bonus. Here’s How Insane It Is.The mother of all KPIs.
Elon Musk has a new carrot dangling in front of him, and it’s not a Mars colony or a flamethrower.
Tesla’s board is asking investors to approve a bonus so massive, so absurd, so galaxy-brained, that it makes past compensation packages look like pocket change.
Ready? We
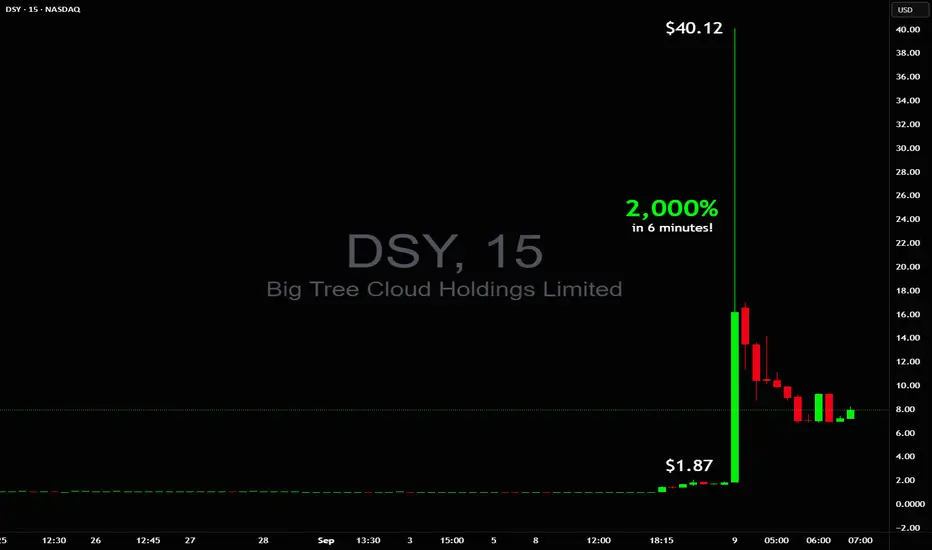
$1.85 to $40.12 in 6 minutes! That's 2,000% on $DSY🚀 $1.85 to $40.12 in 6 minutes! 📈That's 2,000% on NASDAQ:DSY
Early birds got the worm, had to be ready at 4 a.m.
Did you catch it?
I watched it live, it was skipping dollar like it was cents, there really was no safe entry except maybe around $12 - $15 for a vertical to $35+
Other than that you
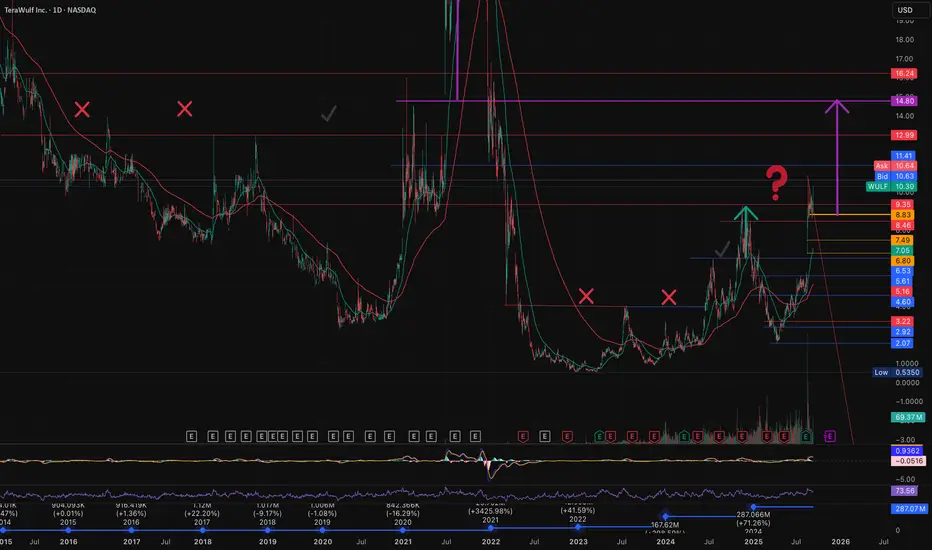
Cup&Handle on WULF pack for another 80% Over last 10years WULF formed at least 6 Cup&Handle patterns among which only Two attained successful results with 350% and 55% respectively to the up side, Four of the patterns were not successful and price headed downward or sideways.
When each of those patterns took One or Two years to complete,
Downtrend in Dell?Dell Technologies has lagged the market for months, and some traders may see further downside in the maker of computer hardware.
The first pattern on today’s chart is the bearish gap on August 29 following quarterly results. While earnings and revenue beat estimates, investors focused on weaker mar
Wolfspeed Inc. Stock on Ending Diagonal completed near 1.13$ - 1.14$ .
Stock Maker accumulate from present level down to 1.13$ - 1.14$ before Rebounding and Triggering to very high Targets.
Above 3 $ is the 1st Target price upto unknown levels.
It is highly recommended for accumulate as much as you can from pre

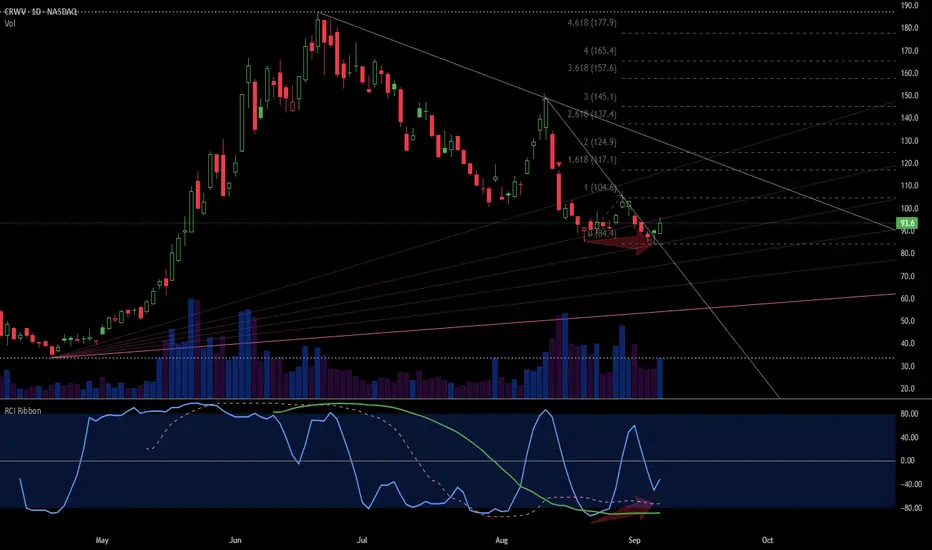
$CRWV: a classic "calm before the storm" setupThe prior markdown has been halted (Phase A), and now the stock is in a low-volatility consolidation range; an early Sign of Strength (SOS) could be forming.
Directional Bias: Neutral with a Tentative Bullish Tilt.
Target 1: $110.00
Target 2: $120.00
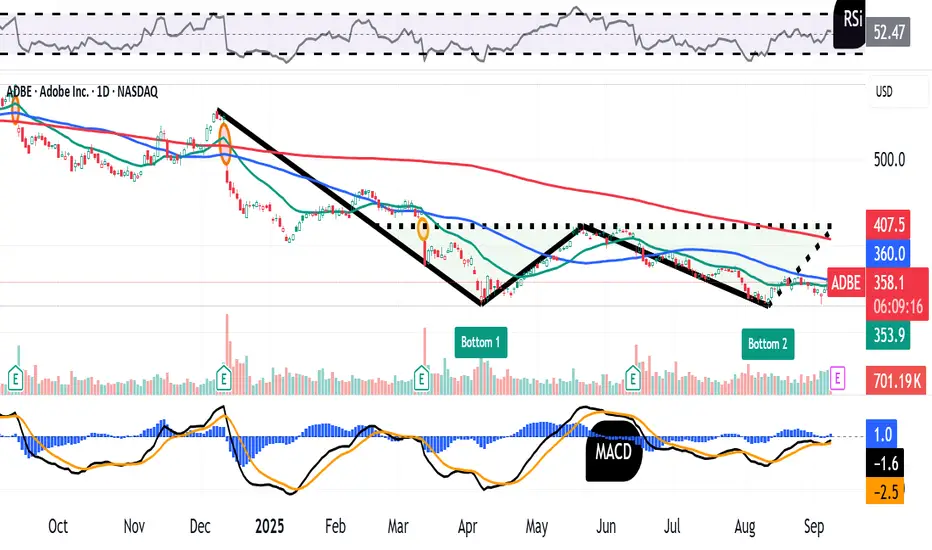
Adobe Has Been Falling For 19 Months. What Its Chart SaysAdobe NASDAQ:ADBE was once known as one the "Cloud Kings," but the 2020s haven't been kind the stock, which has fallen nearly 50% from its November 2021 peak. Let's see what ADBE's technical and fundamental analysis shows us heading into this week's earnings report.
Adobe's Fundamental Analysis
See all stocks ideas
Today
CHWYChewy, Inc.
Actual
—
Estimate
0.14
USD
Today
DAKTDaktronics, Inc.
Actual
—
Estimate
0.21
USD
Today
GMGIGolden Matrix Group, Inc.
Actual
—
Estimate
−0.00
USD
Today
TBHCThe Brand House Collective, Inc
Actual
—
Estimate
−0.70
USD
Today
FIZZNational Beverage Corp.
Actual
—
Estimate
0.60
USD
Today
JVACoffee Holding Co., Inc.
Actual
—
Estimate
—
Today
IXHLIncannex Healthcare Inc.
Actual
—
Estimate
−0.29
USD
Today
MEIPMEI Pharma, Inc.
Actual
—
Estimate
—
See more events
Community trends
Bitcoin - Head and Shoulders to 115k - then dump below 105k!Bitcoin is currently corming a bullish reversal head and shoulders pattern! The price is curently near the right shoulder providing us with a great buying opportunity. What is the profit target? This is a very special situation, because we have an unfilled FVG (Fair Value GAP) right above the HaS ne

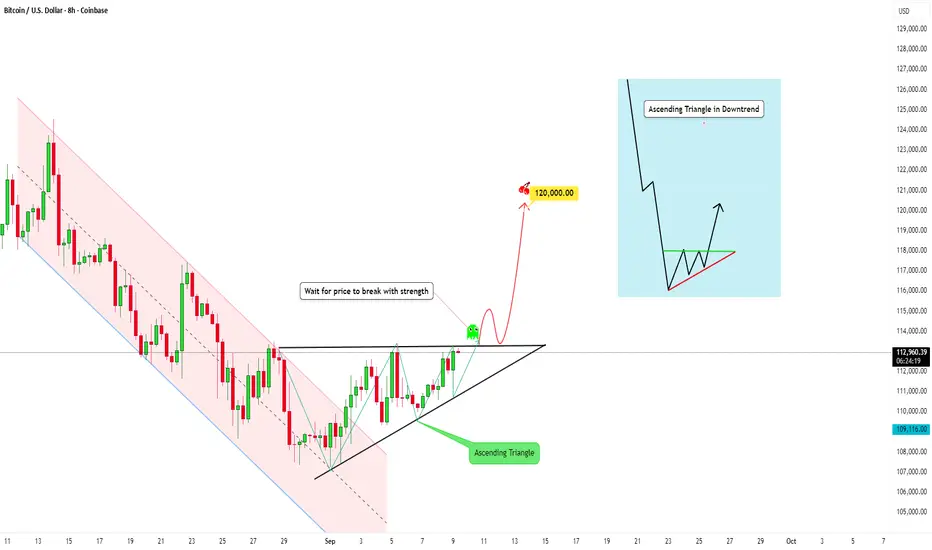
BTC has formed an Ascending Triangle in a DowntrendWhat is Happening Here?
If we take a look at Bitcoin, it's pretty interesting right now: we can observe an ascending triangle just formed. But this pattern took shape after a sharp drop in price.
An ascending triangle is a bullish continuation pattern:
- The resistance line stays horizontal (flat
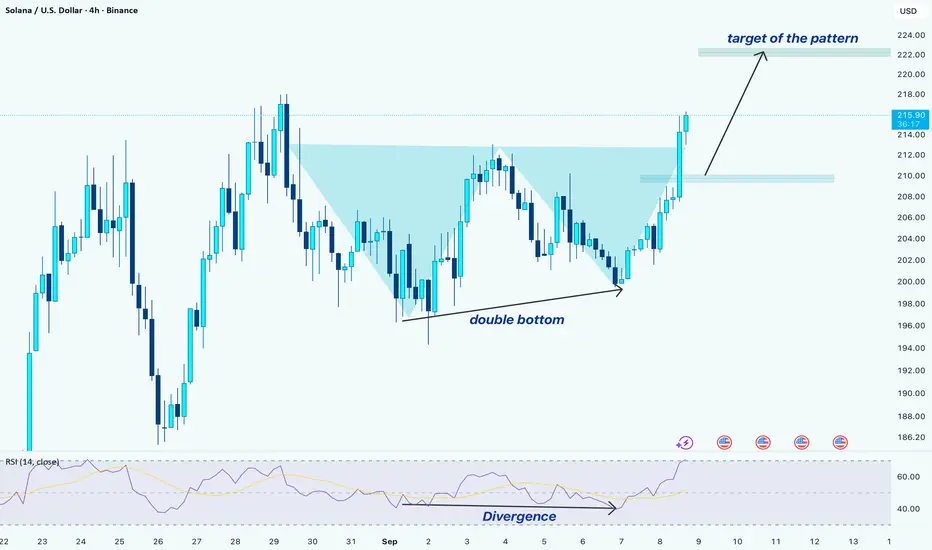
SOL/USDT –> Double Bottom Breakout with Bullish DivergenceHello guys!
Solana has completed a double bottom pattern and broken above the neckline, signaling bullish momentum. Here’s the breakdown:
1-Pattern Formation
A clear double bottom has formed around the $200 zone.
The neckline breakout happened at ~$213–214, confirming the reversal.
2- Moment
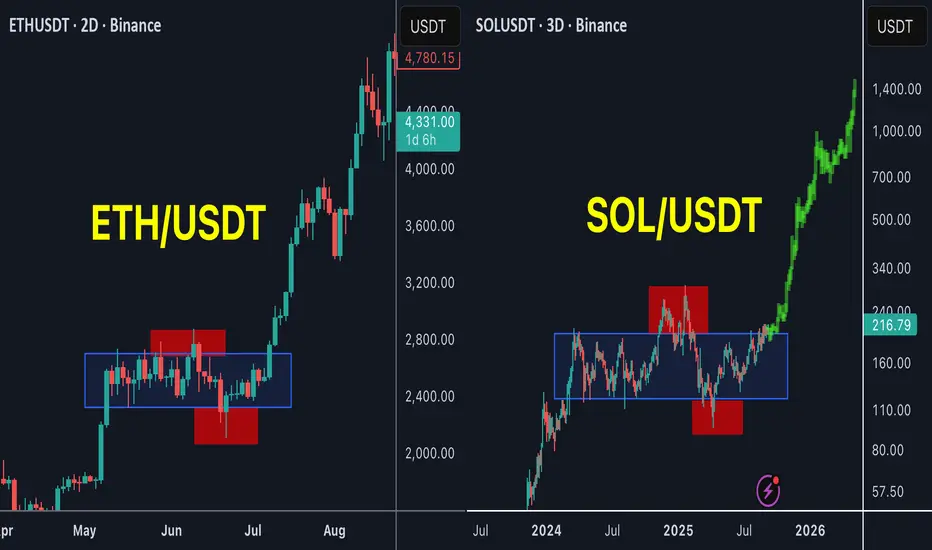
SOL is the next ETH !SOL / USDT
SOL is forming the same pattern as ETH before the huge breakout in past few weeks
Accumulation with 2 major stoploss hunt for bulls and bears and now is trying to breakout the accumulation zone
History show high success rate of this pattern
Will SOL be the next ETH ?
Best of wishes
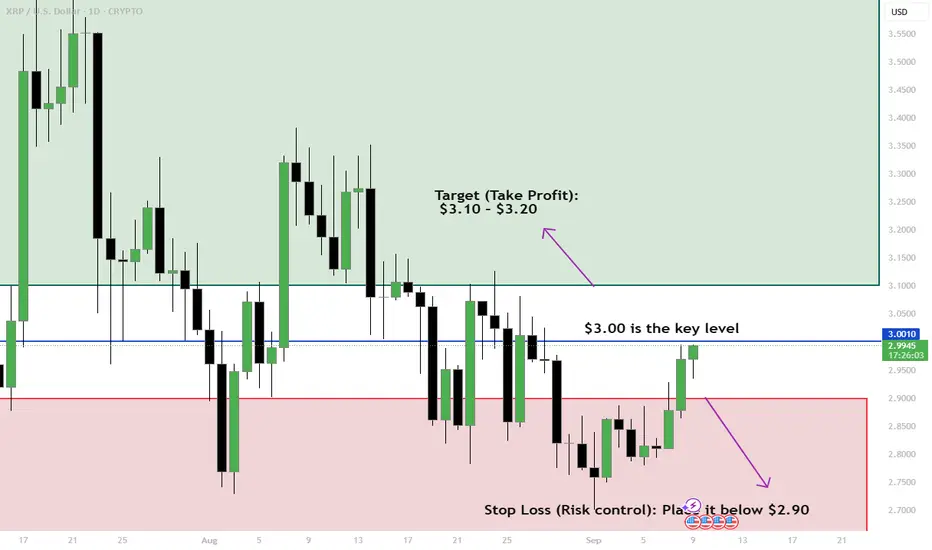
XRP Trading Scenarios (Daily Chart)Hey traders! Let’s break down what’s happening with XRP around the $3.00 level. This price area is very important right now, it could decide the next move. 🚀 or 📉
✅ Bullish Case (If XRP breaks $3.00 upwards)
What to watch: If the daily candle closes above $3.00, that means buyers are strong.
E
BTCUSD: Fake Breakout and Drop to Support LineHello everyone, here is my breakdown of the current Bitcoin setup.
Market Analysis
From a broader perspective, the price of Bitcoin has transitioned from a downward channel into a large rising wedge pattern. This structure has defined the price action for several weeks, creating a volatile envi

SOLUSDT – Bullish Momentum in Upward Channel | Breakout WatchSolana (SOL/USDT) is respecting an upward channel on the 4H chart, showing steady bullish structure.
✅ Multiple Break of Structure (BOS) confirms ongoing uptrend
✅ Price is currently rebounding from the channel support
✅ A clean breakout above 210 – 220 resistance zone could fuel a rally toward 2

BTC - Are the bulls looking for a liquidity grab?Market Context
Bitcoin is holding strong after bouncing from a higher support zone and is now pressing into an area packed with liquidity. The recent bullish price action has carved out multiple fair value gaps on the way up, each serving as confirmation of demand and strengthening the bullish stru

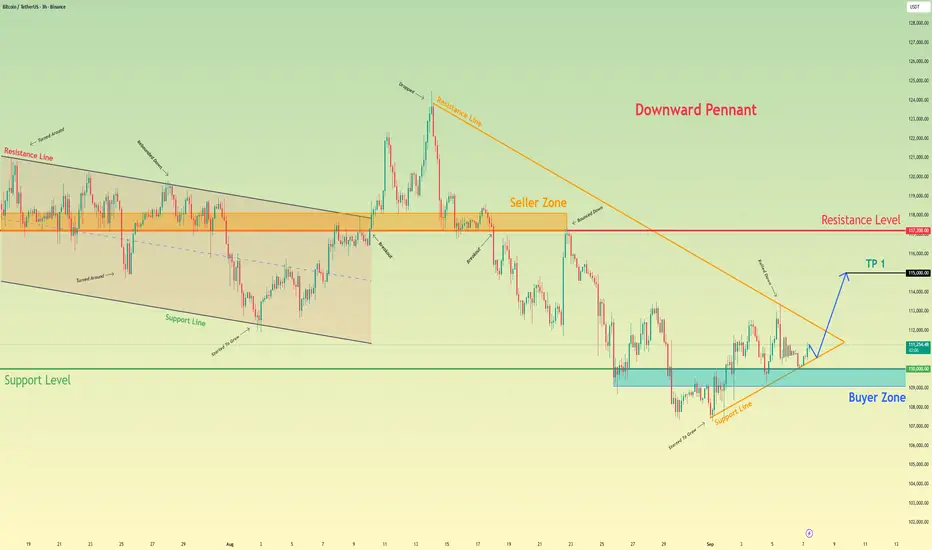
Bitcoin will exit from pennant and continue to growHello traders, I want share with you my opinion about Bitcoin. The market for Bitcoin has been undergoing a lengthy corrective phase, with the price action methodically descending since its last major peak. This bearish price action has been contained within a large downward pennant, a classic rever
ETHUSDT – Sideways with Long-Term OpportunitiesCurrently, ETHUSDT is trading in a sideways range, fluctuating between key support and resistance levels. After facing resistance at 4,360 USD, the price has corrected and is now moving within the range of 4,170 USD – 4,360 USD. The market is lacking decisiveness and there are no strong signals to b

See all crypto ideas
GOLD → Strong bullish trend. What are the targets?FX:XAUUSD continues to rally on positive fundamentals that emerged at the end of last week. The market is pricing in an almost 100% cut in interest rates, which is weakening the dollar and supporting the metal...
Gold is holding close to its record high of $3,600 after extremely weak US employme

Latest Gold Price Update Today👋 Hello everyone , what are your thoughts on OANDA:XAUUSD ?
After Friday’s impressive breakout, gold is now showing signs of a pullback at the upper resistance zone, forming lower highs and currently trading around 3590 USD.
The main scenario still favors the bullish side, but I believe a corre

Lingrid | GOLD Price Deceleration: Short-Term Retracement The price perfectly fulfilled my previous idea . OANDA:XAUUSD has reached a fresh all-time high within the upward channel but is now showing price deceleration near the 3,660 resistance zone, suggesting exhaustion. Price action is forming smaller candles in the profit-taking area, indicating weak

XAUUSDHello Traders! 👋
What are your thoughts on GOLD?
Following the release of the U.S. Non-Farm Payrolls (NFP) data on Friday, gold surged to the 3600 level before entering a corrective phase from that resistance.
We expect this pullback to extend further, potentially reaching lower support zones in t

Another bullish move goldThis is a Gold Spot vs U.S. Dollar (XAU/USD) chart on the 1-hour timeframe from OANDA. At the current moment, the gold price is trading around $3,657.19, showing a gain of +21.345 points (+0.59%).
The chart highlights a bullish momentum, with the price consistently forming higher highs and higher l

Hellena | GOLD (4H): SHORT to support area of 3558.Colleagues, gold is in an active upward impulse of big wave “1” and if until now I was only talking about long positions, now it is time to think about the correction in wave “2”.
Wave “1” (red) consists of five waves and, to all appearances, wave “5” (blue) has either completed or is about to compl

Gold may move up a little and then start to declineHello traders, I want share with you my opinion about Gold. The market for Gold has transitioned from a prolonged balancing phase into a strong directional trend, following a decisive breakout from its prior multi-week big range. This breakout, originating from the support area near the 3445 level,

GOLD: Israeli Airstrike Hits Hamas leaders in QatarGOLD: Israeli Airstrike Hits Hamas leaders in Qatar
🚨 Breaking NEWS:
Several blasts heard in Qatar’s capital after Israeli airstrike on Hamas leadership
The Israel Defence Forces (IDF) said it had carried out a targeted attack on Hamas officials, shortly after the militant group claimed responsi

Long bond bulls’ eye bigger breakoutThe bullish move in U.S. ultra-long bond futures anticipated last week has played out nicely, with the contract surging higher over the subsequent days, taking out a key topside hurdle comprising the 200DMA and horizontal resistance at 119’19. The move has now stalled at a downtrend from the highs s
A Healthy Market Breathes. Gold Hasn’t Exhaled Yet.I remain bullish on Gold overall — that’s not in question.
On 24 August, I even shared a complete cross-market outlook arguing that acceleration to the upside could be the next big move. And indeed, we got it.
But here’s the paradox of markets: sometimes, the stronger the rally, the more fragil

See all futures ideas
EURUSDHello Hello Traders! 👋
What are your thoughts on EURUSD?
EUR/USD has been trapped in a sideways range for the past few weeks, showing choppy back-and-forth movements.
However, the recent break above the descending trendline suggests that a potential bullish breakout could be underway.
After some s

USDJPY Testing 146.700 as Market Awaits ReactionHey Traders, in today's trading session we are monitoring USDJPY for a potential selling opportunity around the 146.700 zone. The pair has been trading in an uptrend, but is currently in a correction phase, approaching this key support/resistance level.
Structure: While the broader bias has been bu

EURUSD Short: Price Reverse and Start FallHello, traders! The price auction for EURUSD has been operating within a well-defined ascending channel for several weeks. This bullish structure has been confirmed by multiple pivot points, with buyers defending the ascending demand line and sellers consistently emerging at the upper supply zone ne

TP1/TP2 +300/+600 pips GBPCAD Advanced XABCD Short From S/R 🔸Hello traders, let's review the 1 hour chart for GBPCAD. Strong gains off the lows recently, however price getting overextended and expecting reversal later at/near PRZ/D.
🔸Speculative XABCD structure defined by point X 8795 point A 8300 point B 8720 point C 8440 point D/PRZ 8970 .
🔸Currently mos

EUR/USD on the 4-hour chart.EUR/USD on the 4-hour chart.
The price is currently around 1.1770
I have drawn a triangle breakout pattern.
The chart shows a target point around 1.1950.
👉 Based on the pattern drawn, the breakout projection suggests the target zone is near 1.1950.

EUR/USD | EUR/USD Breaks 1.17 – Eyes on 1.176+ Targets! (READ)By analyzing the EUR/USD chart on the 4-hour timeframe, we can see that the price held at the 1.16 demand zone as expected and managed to climb above 1.17 with confirmation. Currently, it’s trading around 1.173. If the price can break the 1.174 resistance and close above it, we can expect further up

09.09.25 Morning ForecastPairs on Watch -
FX:EURUSD
FX:EURCAD
FX:NZDCAD
FX:NZDUSD
A short overview of the instruments I am looking at for today, multi-timeframe analysis down to what I will be looking at for an entry. Enjoy!

GBP/JPY – Testing Strong Resistance at 200.200👋Hello everyone, what do you think about the trend of OANDA:GBPJPY ?
Today, this pair is facing strong resistance around the 200.200 level, a key area that needs to be broken for further bullish momentum. After forming a gap and a corrective move to fill it, GBP/JPY could continue its upward tren

USDJPY 30Min Engaged ( Bullish Reversal Entry Detected )Time Frame: 30-Minute Warfare
Entry Protocol: Only after volume-verified breakout
🩸Bullish Reversal - 146.150
➗ Hanzo Protocol: Volume-Tiered Entry Authority
➕ Zone Activated: Dynamic market pressure detected.
The level isn’t just price — it’s a memory of where they moved size.
Volume is rising b

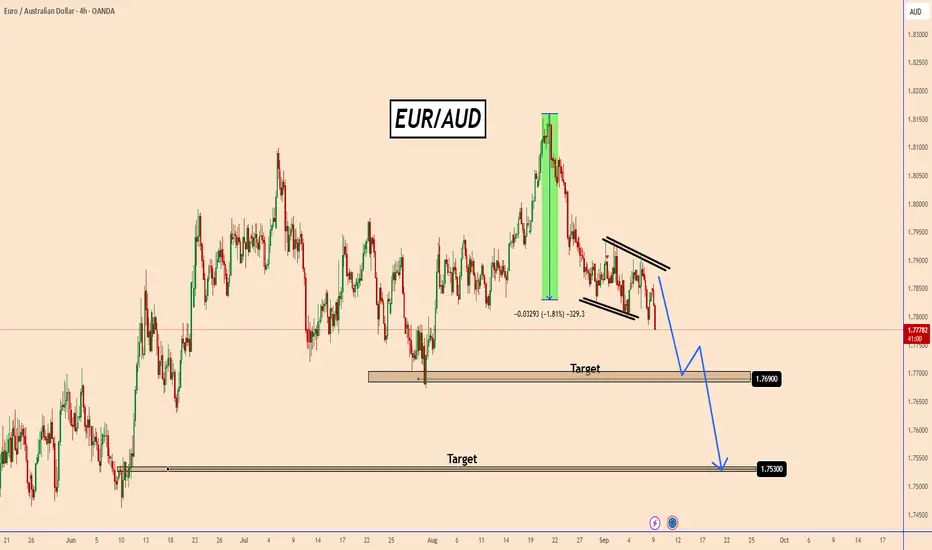
EURAUD: Is Getting Ready To Start a DowntrendEURAUD: Is Getting Ready To Start a Downtrend
From our previous analysis, it seems that EURAUD is about to complete the expected correction. It is not a clear correction, but it is still a correction.
The AUD reported good GDP data last week, showing that the economy is back on track. On the othe
See all forex ideas
| - | - | - | - | - | - | - | ||
| - | - | - | - | - | - | - | ||
| - | - | - | - | - | - | - | ||
| - | - | - | - | - | - | - | ||
| - | - | - | - | - | - | - | ||
| - | - | - | - | - | - | - | ||
| - | - | - | - | - | - | - | ||
| - | - | - | - | - | - | - |
Trade directly on the supercharts through our supported, fully-verified and user-reviewed brokers.


