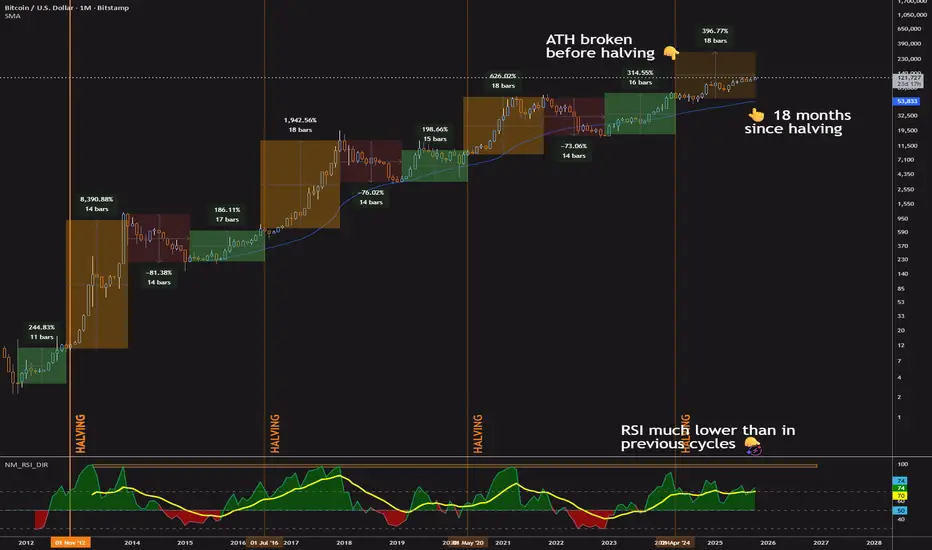
Is Bitcoin's 4-Year Cycle Over? Bitcoin’s 4-year cycle has been a go-to for traders, driven by halving events that spark price surges, sharp corrections, and recovery periods. But something’s off this time.
We’re 18 months into the post-2024 halving rally—hitting the historical peak for bull runs—yet there’s no sign of a crash,

The best trades require research, then commitment.
Get started for free$0 forever, no credit card needed

Scott "Kidd" PoteetThe unlikely astronaut

Where the world does markets
Join 100 million traders and investors taking the future into their own hands.
Major indices
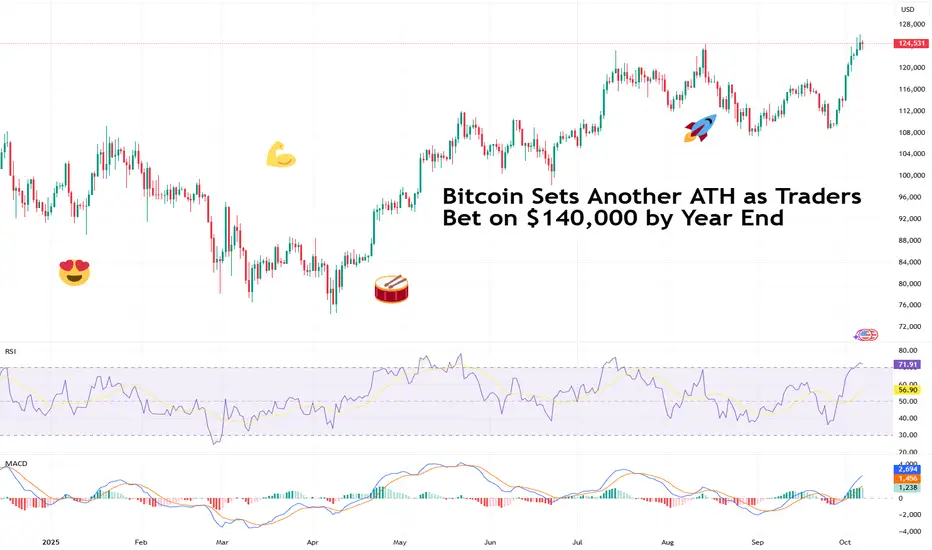
Bitcoin Sets Another ATH as Traders Bet on $140,000 by Year EndBlink and you’ll miss it. Bitcoin’s recent leg up caught lots of traders unprepared. After sinking below $110,000 few weeks back, the OG coin slingshotted to a fresh record high above $126,000 this week. Not a bad way to start October Uptober .
Now, traders are adding to bets that the price will
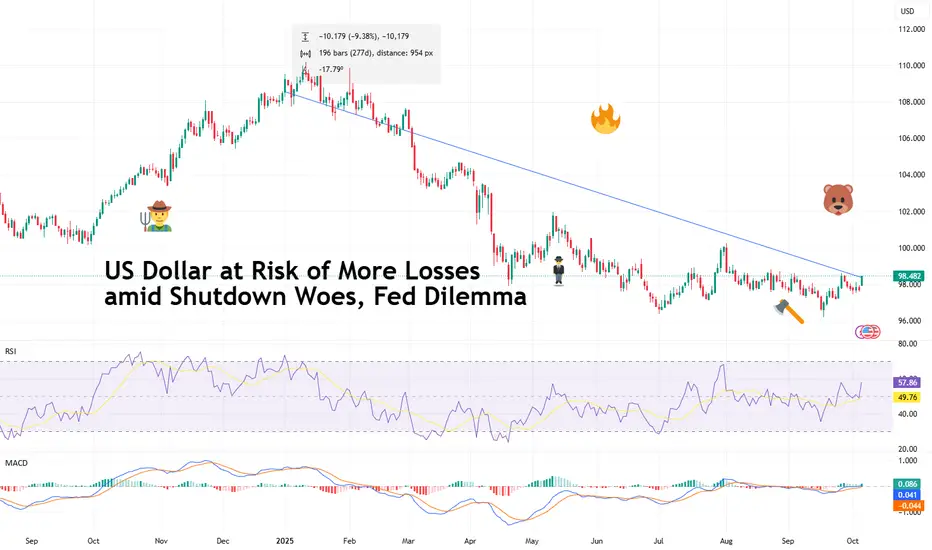
US Dollar at Risk of More Losses amid Shutdown Woes, Fed DilemmaThe US dollar TVC:DXY has been knocked by last week’s US government shutdown and the subsequent economic blackout. At the same time, the Federal Reserve can’t figure out what’s worse – inflation or job crunch.
After Congress failed to pass a funding bill, the government officially went dark at
Retro Editors' picks 2024Closing our retro EP selection , we present to you the last collection of additional scripts that have earned a spot in our Editors' picks, in this case from 2024.
These retrospective selections reflect our continued commitment to honoring outstanding contributions in our community, regardless of

SILVER (XAG/USD): One More Bullish Wave is Coming?!⚠️ SILVER appears to be confined within a horizontal range, as observed on the 4-hour chart. The price is currently nearing the upper limit of this range.
Given the prevailing strong bullish trend, there is a considerable likelihood of a continued upward movement.
A breakout and a 4-hour candle cl

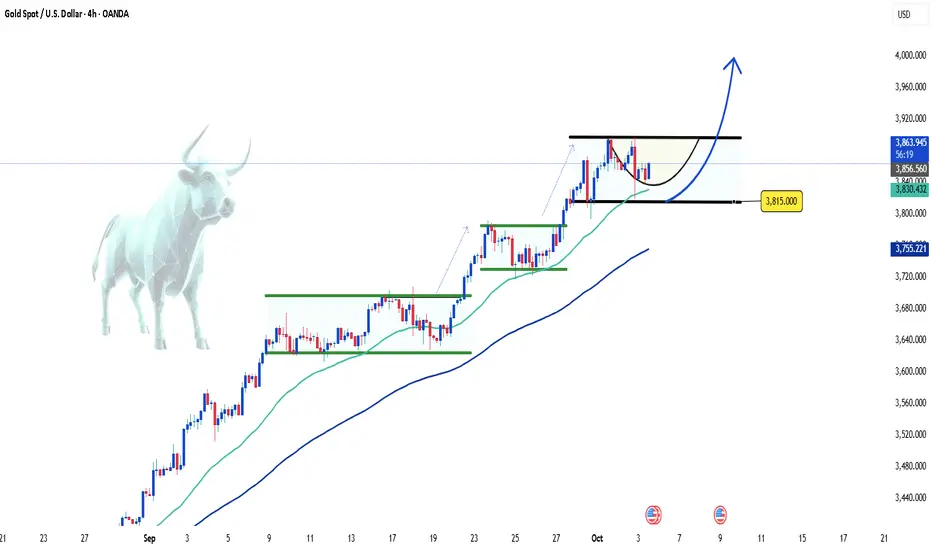
Gold Continues to Challenge Record Resistance Levels👋Hello everyone, what are your thoughts on OANDA:XAUUSD ?
As of this writing, gold continues its upward momentum, having reached new highs as investors increase their bets on the Federal Reserve cutting interest rates in the near future. The concerns over the U.S. government shutdown and global e
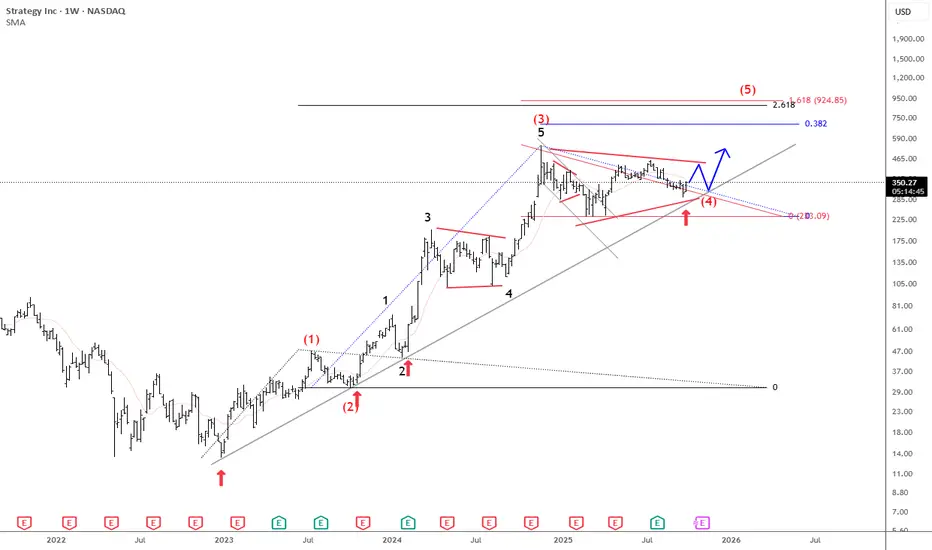
Microstrategy Is Still Pointing Higher For The Final 5th WaveMicrostrategy is a US business intelligence and software company, but it has become best known for its aggressive Bitcoin strategy. Under co-founder Michael Saylor, the company shifted from focusing mainly on software to also using Bitcoin as its primary treasury reserve asset.
Since 2020, MicroStra
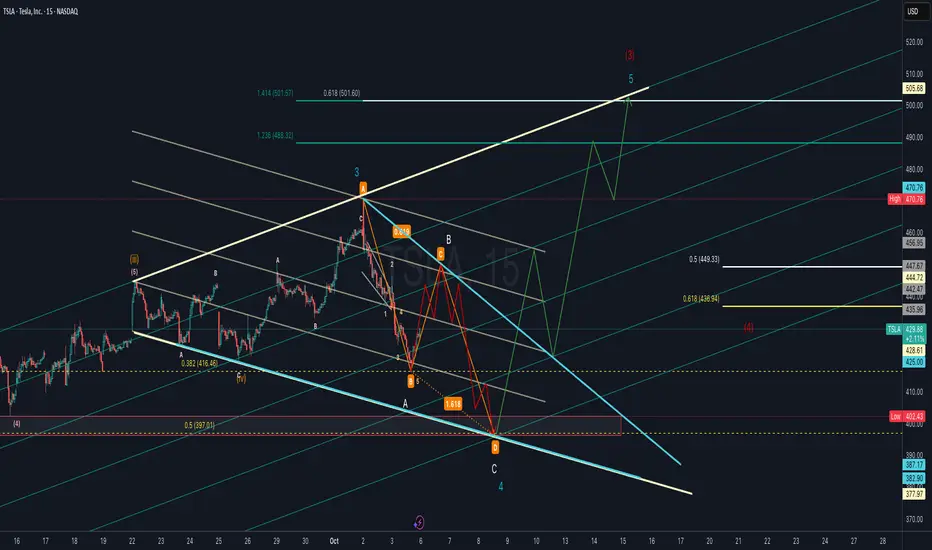
TSLA Elliott Wave Count with ABC Harmonic or Flat Corrective Tesla (TSLA) is forming a potential Wave 4 correction that aligns with an ABC harmonic structure. Price action suggests a possible deeper retracement into the 0.5–0.618 Fibonacci support zone (436–449 area) before resuming its larger uptrend.
If Wave 4 completes near the harmonic “D” zone (highligh
NVDA Ready for Takeoff: $200 Target in Sight!
Based on the daily chart of NVIDIA (NVDA) on NASDAQ, here’s a breakdown:
🔎 Technical Analysis
Overall Trend
The stock is in a strong uptrend (rallying from around $120 to the current $186).
Higher lows are forming, and price is pressing against the 185–187 resistance zone, showing strong buying

Why Gen X Struggles with Crypto?Why does Gen X struggle with crypto?
Because they’re used to the stock market system, where ownership is recorded by a central registry and trades that are tied to a specific exchange.
In their world, you typically should buy through Nasdaq in this example and expect to sell through Nasdaq. But w

See all editors' picks ideas
PongExperience PONG! The classic arcade game, now on your charts!
With this indicator, you can finally achieve your lifelong dream of beating the Markets. . . at PONG!
Pong is jam-packed with features! Such as:
2 Paddles
A moving dot
Floating numbers
The idea of a net
This indicator is solel

Options Max Pain Calculator [BackQuant]Options Max Pain Calculator
A visualization tool that models option expiry dynamics by calculating "max pain" levels, displaying synthetic open interest curves, gamma exposure profiles, and pin-risk zones to help identify where market makers have the least payout exposure.
What is Max Pain?
Max

Volume Profile 3D (Zeiierman)█ Overview
Volume Profile 3D (Zeiierman) is a next-generation volume profile that renders market participation as a 3D-style profile directly on your chart. Instead of flat histograms, you get a depth-aware profile with parallax, gradient transparency, and bull/bear separation, so you can see w

RiskMetrics█ OVERVIEW
This library is a tool for Pine programmers that provides functions for calculating risk-adjusted performance metrics on periodic price returns. The calculations used by this library's functions closely mirror those the Broker Emulator uses to calculate strategy performance metrics (

Simple Decesion Matrix Classification Algorithm [SS]Hello everyone,
It has been a while since I posted an indicator, so thought I would share this project I did for fun.
This indicator is an attempt to develop a pseudo Random Forest classification decision matrix model for Pinescript.
This is not a full, robust Random Forest model by any stretch o

Tick CVD [Kioseff Trading]Hello!
This script "Tick CVD" employs live tick data to calculate CVD and volume delta! No tick chart required.
Features
Live price ticks are recorded
CVD calculated using live ticks
Delta calculated using live ticks
Tick-based HMA, WMA, EMA, or SMA for CVD and price
Key tick levels (S

analytics_tablesLibrary "analytics_tables"
📝 Description
This library provides the implementation of several performance-related statistics and metrics, presented in the form of tables.
The metrics shown in the afforementioned tables where developed during the past years of my in-depth analalysis of various str

Adaptive Trend Classification: Moving Averages [InvestorUnknown]Adaptive Trend Classification: Moving Averages
Overview
The Adaptive Trend Classification (ATC) Moving Averages indicator is a robust and adaptable investing tool designed to provide dynamic signals based on various types of moving averages and their lengths. This indicator incorporates multipl

Statistics • Chi Square • P-value • SignificanceThe Statistics • Chi Square • P-value • Significance publication aims to provide a tool for combining different conditions and checking whether the outcome is significant using the Chi-Square Test and P-value.
🔶 USAGE
The basic principle is to compare two or more groups and check the results

FiniteStateMachine🟩 OVERVIEW
A flexible framework for creating, testing and implementing a Finite State Machine (FSM) in your script. FSMs use rules to control how states change in response to events.
This is the first Finite State Machine library on TradingView and it's quite a different way to think about your

See all indicators and strategies
Community trends
Amd - This is just the beginning!🎈Amd ( NASDAQ:AMD ) breaks out soon:
🔎Analysis summary:
Just a couple of months ago, we witnessed a very strong bullish retest on Amd. Back then the channel continuation remained extremely likely, perfectly playing out until today. But despite the recent parabolic rise, Amd can still rally an

Falling Knife Trade - Bottom PickingA 44% drop since November 2024 in this Financial Data powerhouse, is this a knife worth catching or does this have lower to go?
Purely from a technical perspective, this chart is extremely weak. We are clutching onto a long term trendline, with the 0.786 Fib and 200M EMA just below. If we get a mea

BearishAPP (Applovin) – Bearish Trade Plan
Setup: Price rejected from ~$725 resistance after a strong run. Momentum shows signs of exhaustion with potential for a corrective move lower.
Entry:
Short around $695–705 on weakness (confirmation with daily close below $700 preferred).
Stop Loss:
Above $730

BTQQF - Tommy Lee's Quantum NameBTQ name is lately popular after Tommy Lee mentioned it for Quantum Crypto POC blah blah..
Anyways, Technically this is in a good buy zone.
- Above 200MA
- Above big volume shelf support zone
- Finished ABC correction and Wave 2 about to begin on the primary cycle.
Low float 138M shares, S

NVDA Long/Investment till mid nov. 2 entries: low probability of orders getting filled/high profit margin.
1. one for higher probability of getting filled. E: 174 SL: 166
2. better profit margin. E: 172 SL: 167
target is $200 - $220
only allowed to hold it till:
1. 15 of November
or
2. 3 of December
why not to hold it till

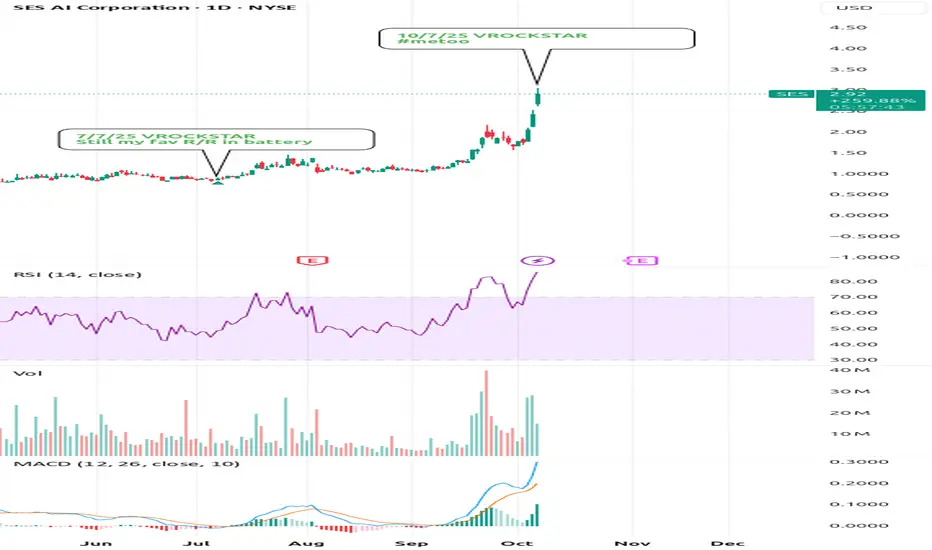
10/7/25 - $ses - #metoo10/7/25 :: VROCKSTAR :: NYSE:SES
#metoo
- don't flame me as i was a bull here
- honestly this is a co w/ an actual product
- that is probably worth 100B in this market
- but c'mon
- read the tea leaves guys, this is all going to end so quickly
here's what everyone is missing:
- when *everything
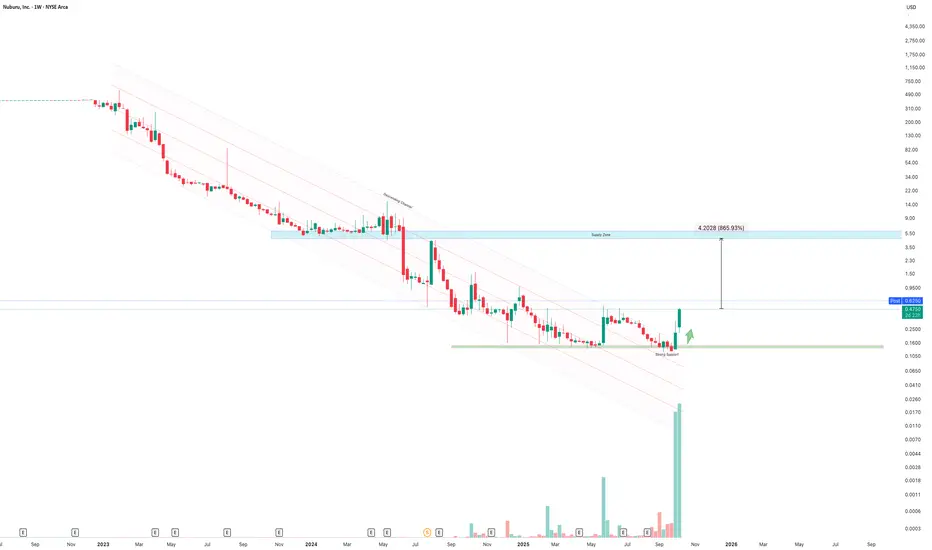
Buru to $5.00 NearTerm?!The chart illustrates a confirmed breakout from a long-term descending channel following an extended period of accumulation near strong support around $0.16–$0.20. A powerful volume surge — the largest in the stock’s history — confirms strong momentum and potential trend reversal.
Price has now clo
AMD Best Level to BUY/HOLD 300% gains SWING TRADE🔸Hello traders, today let's review recent price chart for AMD.
Well defined swings in progress, expecting further downside before
the tide finally turns for AMD bulls. Currently it's recommended to stay out.
🔸AMD is trailing behind NVDA massively, so eventually AMD will to the
mean reversion trade

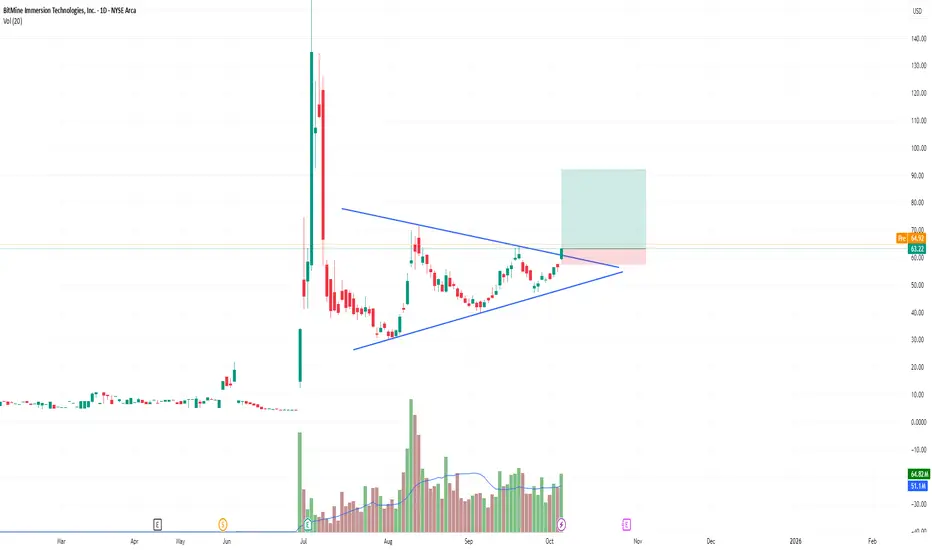
BITM – Symmetrical Triangle Breakout Setting Up for a Potential
BitMine Immersion Technologies (NYSE: BITM) is showing a classic symmetrical triangle pattern on the daily chart — a consolidation that often precedes a major directional breakout.
After the explosive move in July that sent the stock from the $10s to above $130, price has been cooling off and form
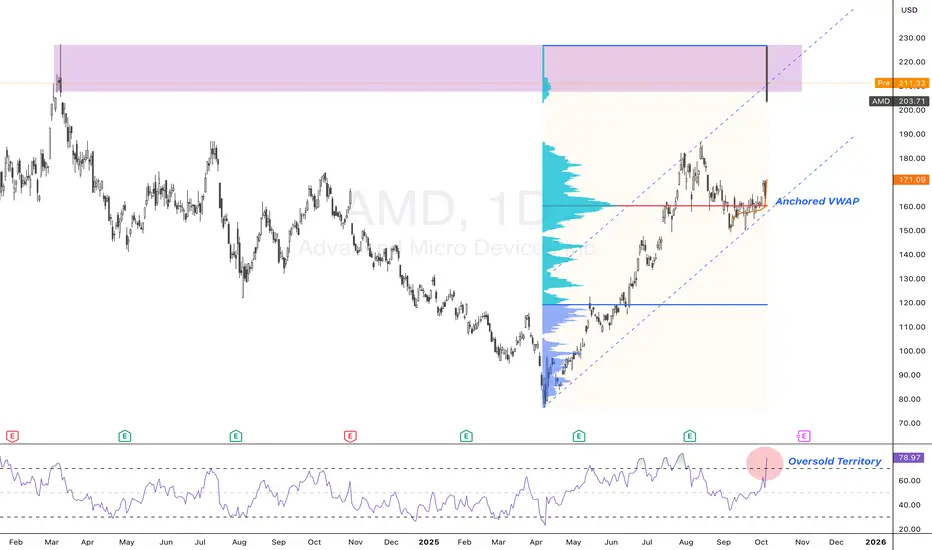
AMD: Big AI Deal, Bigger Expectations — But Caution Near HighsAMD ripped +37% after announcing a 6 GW GPU supply deal with OpenAI, including a 10% warrant structure tied to performance and stock price.
Yes, the partnership validates AMD as a serious Nvidia rival — but much of that sentiment is already priced in.
Now we enter the quiet phase:
Revenue from
See all stocks ideas
Today
CMTLComtech Telecommunications Corp.
Actual
—
Estimate
−0.75
USD
Today
GMGIGolden Matrix Group, Inc.
Actual
—
Estimate
−0.00
USD
Today
PKEPark Aerospace Corp.
Actual
—
Estimate
—
Today
LFCRLifecore Biomedical, Inc.
Actual
—
Estimate
−0.31
USD
Today
MAYSJ. W. Mays, Inc.
Actual
—
Estimate
—
Today
VFSVinFast Auto Ltd.
Actual
—
Estimate
−0.26
USD
Today
BSETBassett Furniture Industries, Incorporated
Actual
—
Estimate
0.09
USD
Today
RGPResources Connection, Inc.
Actual
—
Estimate
−0.20
USD
See more events
Community trends
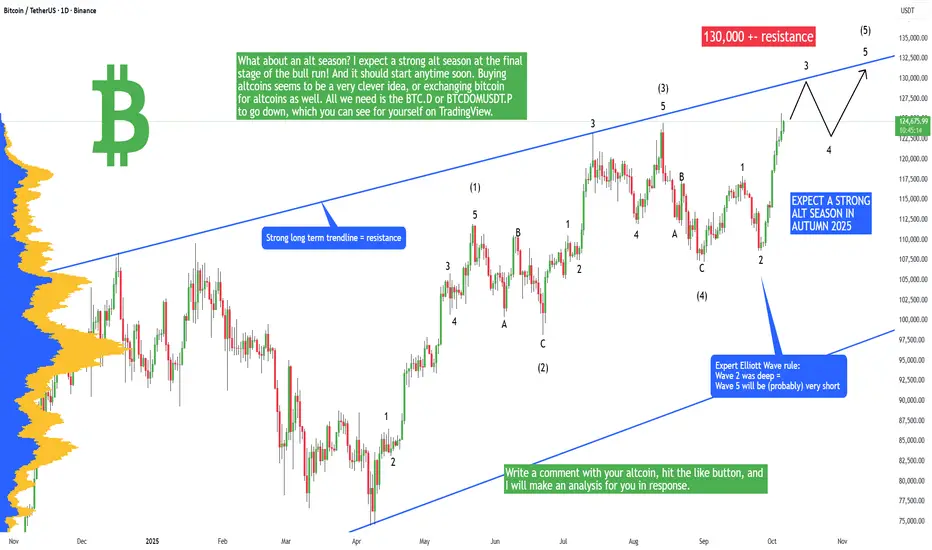
Bitcoin + ALT-SEASON 2025 Starting! (sell here, thank me later)Bitcoin has been pumping heavily in past days! And this trend will likely continue the whole month of October. We have a very likely scenario that will probably happen on Bitcoin, and in this analysis I will tell you which one!
The Elliott Wave theory is one of the strongest tools that you can use
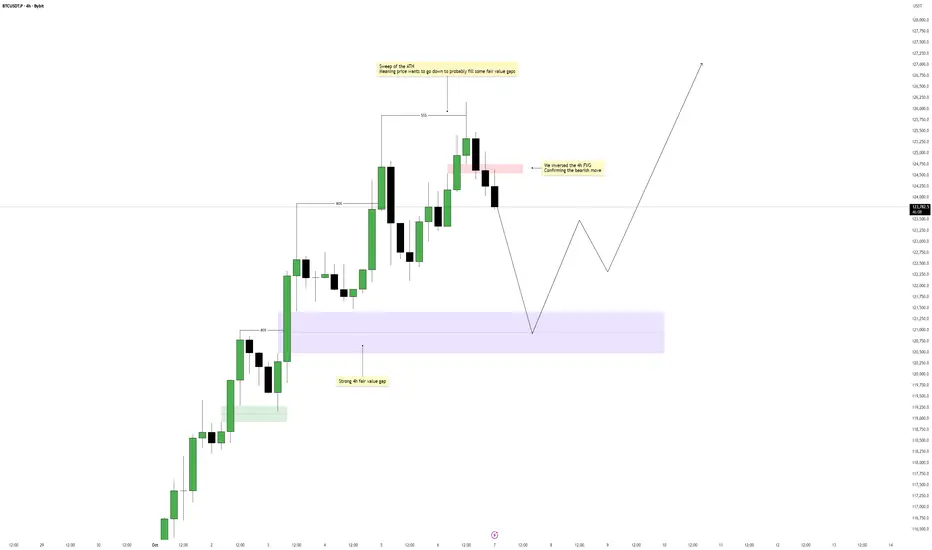
Bitcoin – Short-Term Weakness, Long-Term StrengthBitcoin has recently swept the all-time high, triggering a short-term reaction from liquidity resting above that level. This move often signals that the market has completed its buy-side run and is now seeking to rebalance inefficiencies created during the aggressive push upward. The current structu
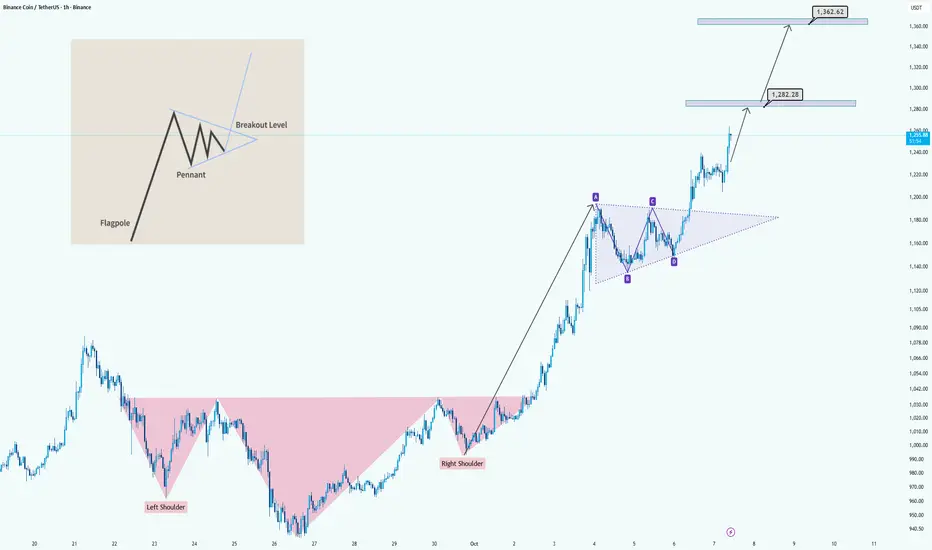
BNB/USDT: Bullish Breakout from H&S and Pennant FormationHi guys!
The chart clearly shows a bullish structure forming after a strong upward move. Initially, the price completed an Inverse Head and Shoulders pattern , signaling a potential trend reversal from bearish to bullish. After the breakout above the neckline, the market continued to climb and sta
BITCOIN ENDING DIAGONAL: $160K OR $120K? (1HR CRITICAL UPDATE)While I typically avoid short-term CRYPTOCAP:BTC analysis, this 1hr setup is too critical to ignore. Price is painting a textbook Elliott Wave pattern that could deliver a explosive move.
CURRENT STRUCTURE:
• Waves 1 & 2 ✅ COMPLETE
• Wave 3 (extended) now forming an ENDING DIAGONAL
• Current tr

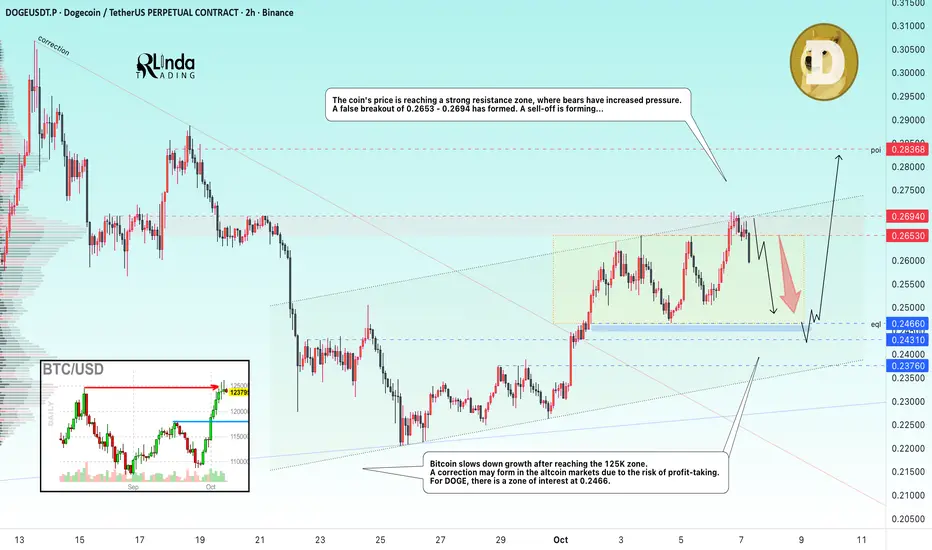
DOGEUSDT → Correction to 0.246. The hunt for liquidity BINANCE:DOGEUSDT.P attempted to realize its potential after breaking out of the downward resistance. After updating the local maximum to 0.27, the price entered a phase of correction and consolidation...
Bitcoin slows down its growth after reaching the 125K zone. A correction may form in the a
Bitcoin Sets Another ATH as Traders Bet on $140,000 by Year EndBlink and you’ll miss it. Bitcoin’s recent leg up caught lots of traders unprepared. After sinking below $110,000 few weeks back, the OG coin slingshotted to a fresh record high above $126,000 this week. Not a bad way to start October Uptober .
Now, traders are adding to bets that the price will
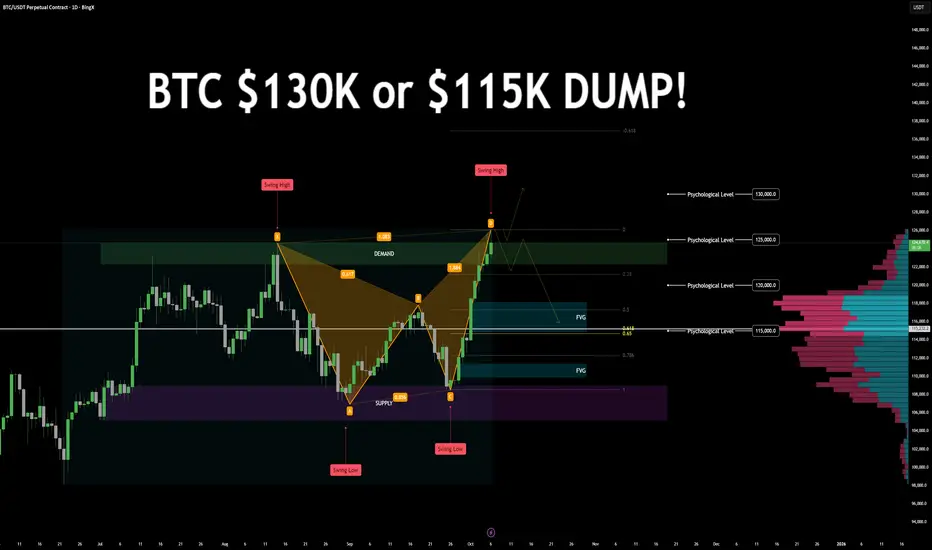
$BTC Daily chart $130K! or $115k DUMPBTC/USDT – Bearish Harmonic Formation | Key Levels & Scenarios
Technical Overview:
Price is currently forming a bearish harmonic pattern, approaching a key decision zone. The next few daily candles will determine whether BTC continues its bullish trend or initiates a corrective phase.
Key Zon
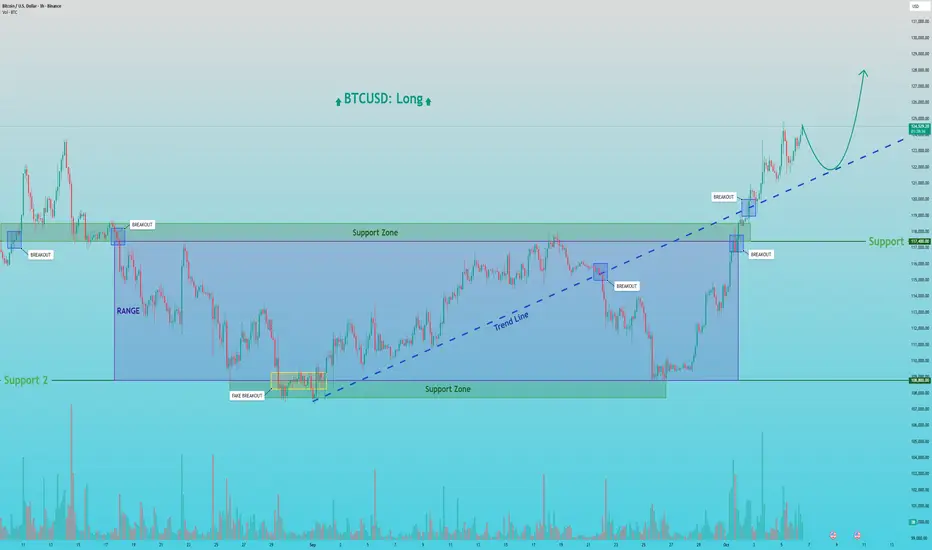
BTCUSD: Is This the Breakout to a New All-Time High?Hello everyone, here is my breakdown of the current Bitcoin setup.
Market Analysis
From a broader perspective, the price action for Bitcoin has been complex, culminating in a powerful breakout. After a fake breakdown below the 108800 Support level, the price reversed strongly, broke out of its
XRP - 20% move is COMING!! BIG OI rise!!XRP - 20% move is COMING!! BIG OI rise!!
open interest increased by 154m Xrp coins
many times fater such thing price did significant move
in a case of break donw it could reach 2.4

ETH/USD (Ethereum vs US Dollar) .ETH/USD (Ethereum vs US Dollar) on the 1D timeframe (Bitstamp exchange).
From My setup:
Current price: $4,691
I have drawn a bullish trendline (supporting the uptrend).
The Ichimoku cloud is providing support, price is trading above it.
A resistance zone was broken recently.
I have marked a T

See all crypto ideas
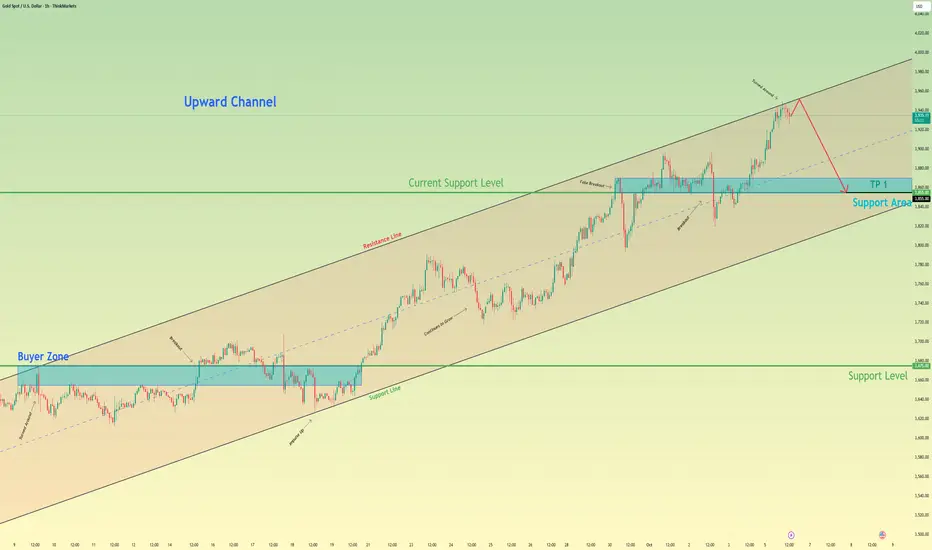
Gold can Start a Correction Towards 3855 SupportHello traders, I want share with you my opinion about Gold. The broader market context for Gold has been decidedly bullish since the price reversed and broke out from a prior descending channel. This structural shift established a new uptrend, which has since been neatly contained within a well-defi
Lingrid | GOLD Persistent Bullish Trajectory ContinuesThe price perfectly fulfilled my previous idea . OANDA:XAUUSD is holding firm above 3900 after setting a new ATH near 3980 within the upward channel. Price action confirms bullish structure, with higher lows and trend continuation signals. A rejection support zone near 3920 could open the path fo

XAUUSD - Target $4,000 in Sight ⭐️Hello everyone, what do you think about the trend of OANDA:XAUUSD ?
XAUUSD has continued its strong upward momentum since the start of the week, breaking past the $3,950 level and approaching the psychological barrier of $4,000. Demand for gold has surged amid concerns about a potential U.S. go

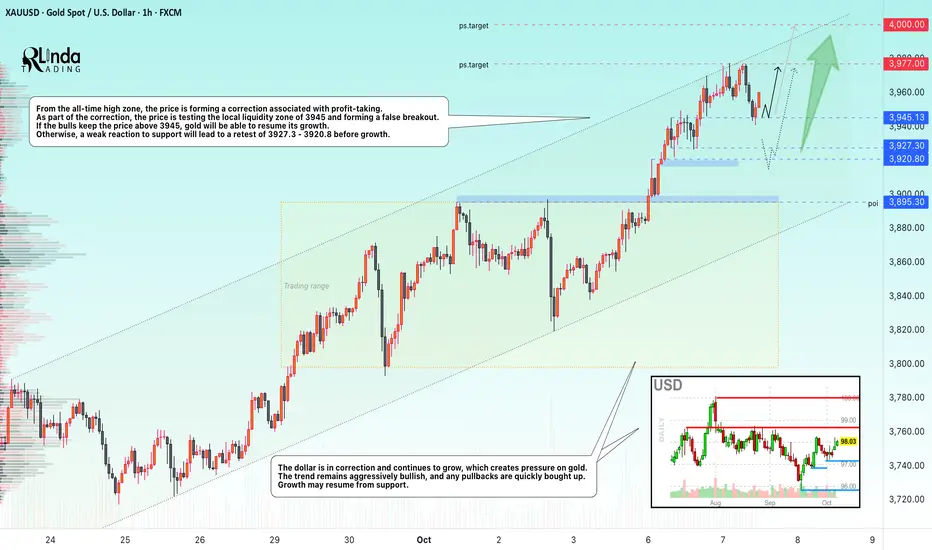
GOLD → The correction will trigger growth to $4,000.FX:XAUUSD hit a new record high of nearly $3,977 and entered a correction phase to build up potential before further growth. Despite the local strengthening of the dollar, the upward trend continues thanks to a combination of macroeconomic and geopolitical factors.
Key supporting factors: Ongo
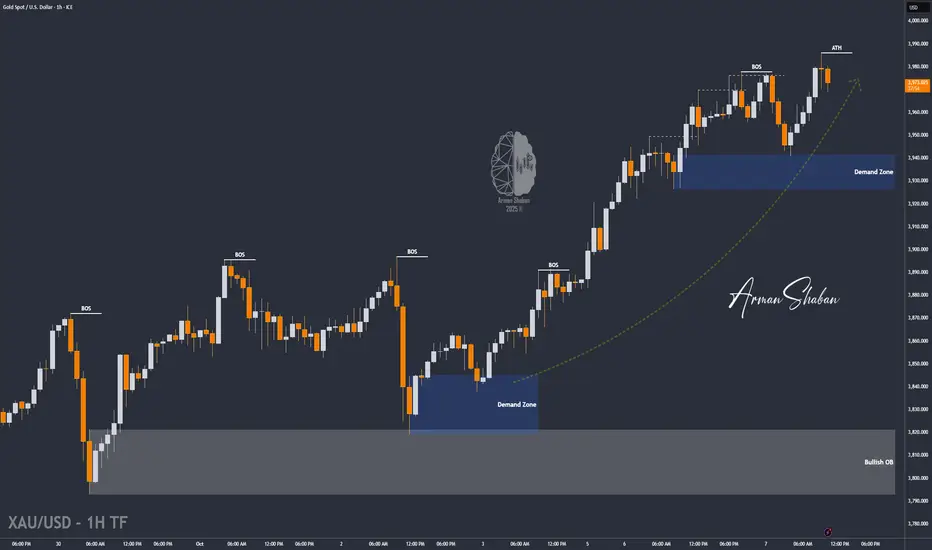
GOLD ROUTE MAP UPDATEHey Everyone,
As promised, here’s the latest update on our ongoing 1H Chart Idea, which continues to play out in true GoldViewFX fashion.
After completing all our previous bullish targets yesterday, we stated that price was now playing between 3937 and 3965, awaiting an EMA5 cross and lock to dete

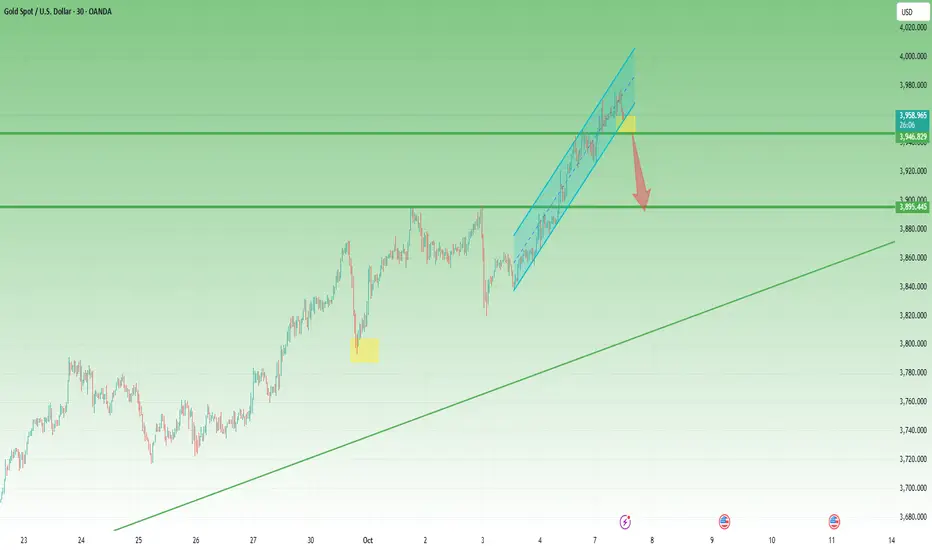
Gold: The Higher It Flies, the Louder the Correction WhispersAs explained in my Sunday video, the new all-time high for Gold is not a question of if, but how high it can rise once it firmly breaks above 3900.
Indeed, Gold has continued its unstoppable march, printing ATH after ATH, with the latest one formed during today's Asian session at 3977 — another a
GOLD In A New Upward Move Targeting $4000 - $4100GOLD In A New Upward Move Targeting $4000 - $4100
From our previous analysis, GOLD respected the bullish scenario. This came with a confirmation during the night trading session as I explained in the previous post.
With this move above 3895, the price confirmed a bullish triangle pattern that sh

XAU/USD | Gold Nears $4000 as Goldman Sachs Target $4900 by 2026By analyzing the Gold (XAUUSD) chart on the 1-hour timeframe, we can see that the price continued its strong bullish momentum today and reached $3985.66, marking a new all-time high (ATH)! Gold is now just a step away from the $4000 milestone.
Interestingly, Goldman Sachs has raised its gold price f
XAUUSD: A Correction Is Coming – Don’t Miss Out!Hey everyone, Kilian here!
Let’s dive into today’s XAUUSD analysis!
The price is currently moving within a clear upward channel, with price action testing the upper boundary. This could act as a dynamic resistance level, and if the price is rejected here, we might see a slight pullback, bringing t

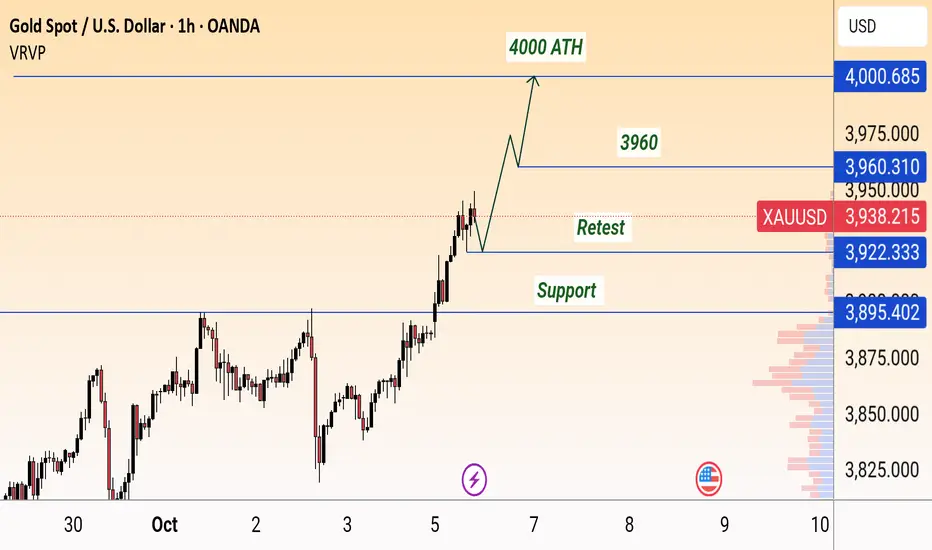
XAU/USD Bullish Setup Targeting 4000 ATHThis analysis on XAU/USD (Gold vs. US Dollar) 1H chart highlights a bullish outlook. Price is currently trading around 3937 after a strong upward move.
Support Zone: Around 3895 – 3922, providing a key base for buyers.
Retest Level: Expected pullback near 3960, which could act as a confirmation ar
See all futures ideas
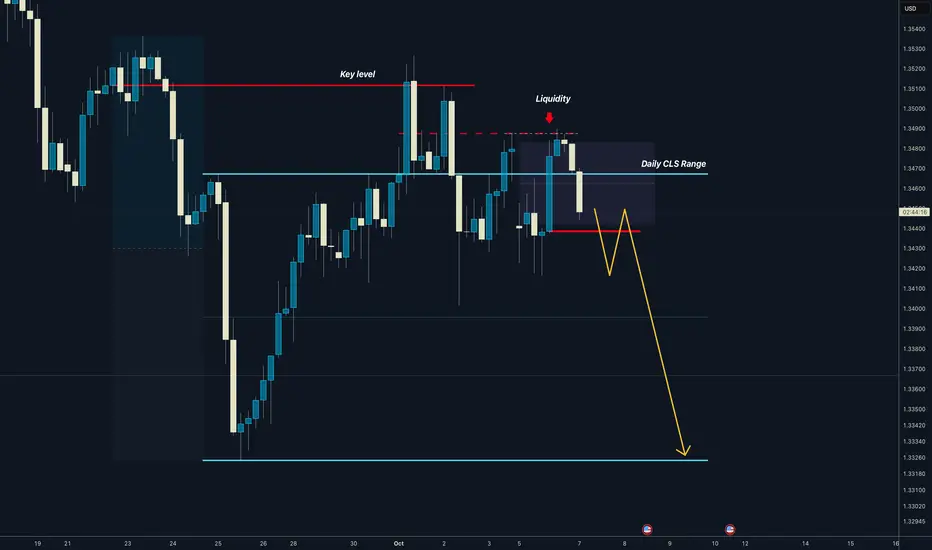
GBPUSD Daily CLS Range, Key Level OB, Distribution PhaseHi friends, new range created. As always we are looking for the manipulation in to the key level around the range. Don't forget confirmation switch from manipulation phase to the distribution phase to make the setup valid. Stay patient and enter only after change in order flow. If price reaches 50%
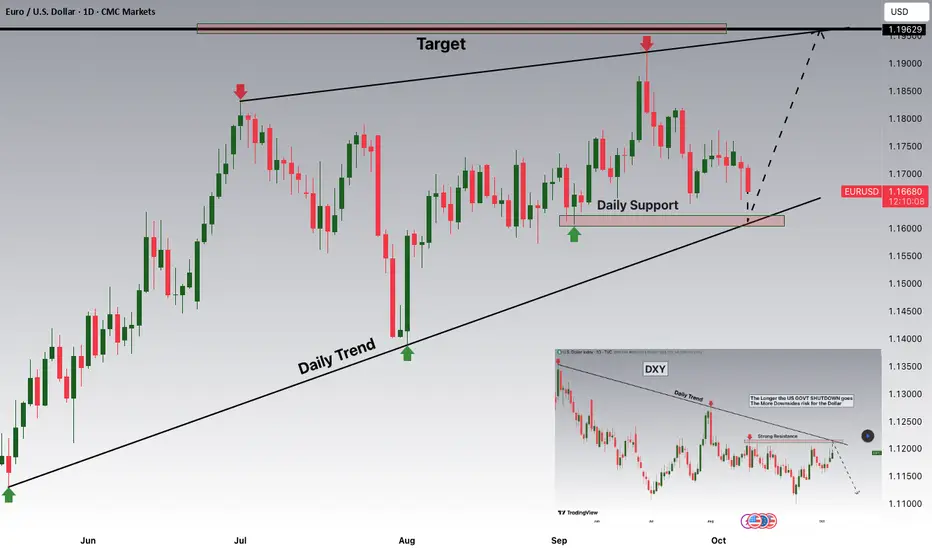
EURUSD: Buying Interest Builds at 1.1610 as Shutdown DragsHey Traders, in today’s trading session we are monitoring EURUSD for a potential buying opportunity around the 1.16100 zone. The pair remains in a broader uptrend and is currently in a correction phase, approaching a strong daily support area at 1.16100 that aligns with the ascending trendline.
Str
AUDUSD - Steady Uptrend with Strong Support ? 👋Hello everyone, what do you think about the trend of OANDA:AUDUSD ?
AUDUSD has maintained a steady uptrend over the past few months, primarily consolidating in a defined price channel, with the price holding above key support levels. Technically, the pair is currently testing the support zone t

EURUSD consolidating but remains in a broader downtrendThe EUR/USD pair has been consolidating but remains in a broader downtrend. The recent price action suggests that a deeper correction pattern could unfold. The pair corrected as expected but did not get close to the 1.1770 resistance level. Interestingly, the recent U.S. government shutdown news had

GBP/ USD Bullish Setup GBP/USD 30M analysis shows a potential bullish move from the 1.3437 support zone toward the target zone 1.3489–1.3562. Buy setup active above 1.3437 with targets TP1: 1.3489, TP2: 1.3527, TP3: 1.3562, and stop loss at 1.3399.

Gbpusd Setup This GBP/USD 1-hour chart analysis shows a bullish setup forming above the support trend line. Price is currently retracing towards the trend line support near 1.3440, suggesting a potential bounce. If the support holds, the pair is expected to move upward toward the resistance zone around 1.3486. A

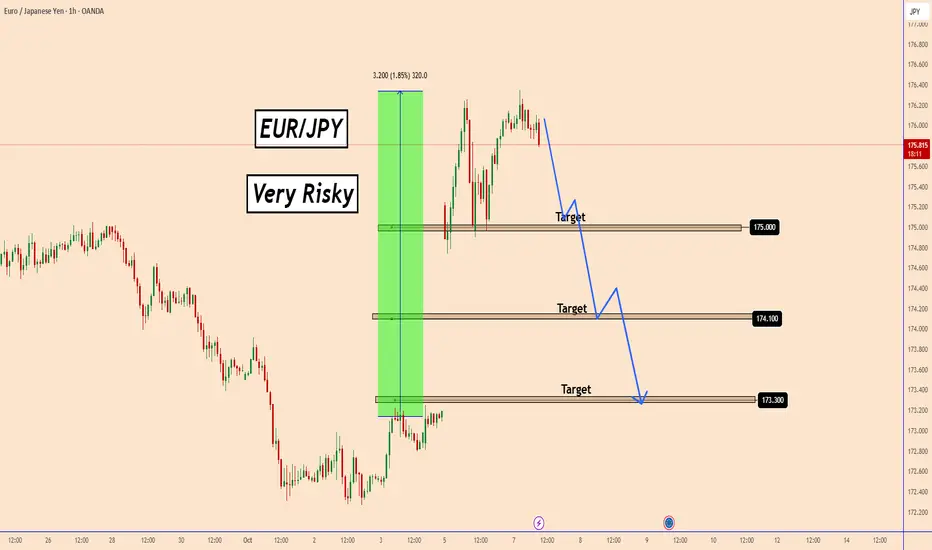
EURJPY: Very Risky SetupEURJPY: Very Risky Setup
EURJPY had a strong upward push over the weekend created by the Japanese Election result.
The pair now looks overbought considering it gained almost 320 pips in a single day. It is possible that EURJPY could face a correction soon.
If the price fails to hold current lev
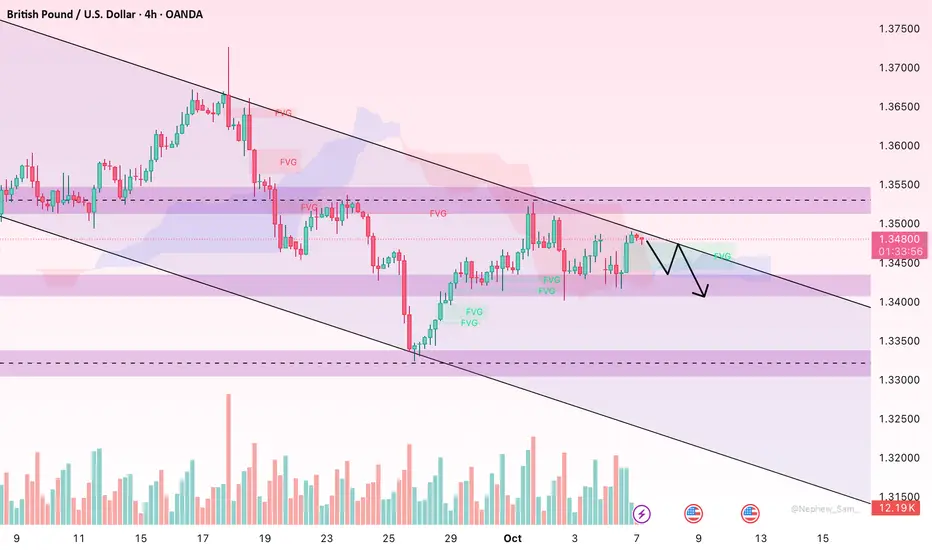
GBP/USD: Short Pause or Start of a Deeper Correction?Hello traders, after a sharp and impressive rally, GBP/USD is now entering a consolidation phase, hovering around 1.3475. This zone highlights the current tug-of-war between bulls and bears as the market cools down after an extended climb.
On the 4-hour chart, several Fair Value Gaps (FVGs) can be
AUDUSDHello Traders! 👋
What are your thoughts on AUDUSD?
The pair has broken its ascending trendline and completed a pullback to the broken level.
It is now trading below a key resistance zone, showing signs of bearish pressure.
After some consolidation in this area, the price is expected to continue de

NZDUSD short? Wyckoff : the structure strongly suggests we are ending the markdown and preparing for accumulation / re-markup.
Fundamentally, a short-term dip to 0.57 is logical and healthy before the next impulsive leg up.
Unless the RBNZ delivers an ultra-dovish message or the USD rallies broadly, a move muc

See all forex ideas
| - | - | - | - | - | - | - | ||
| - | - | - | - | - | - | - | ||
| - | - | - | - | - | - | - | ||
| - | - | - | - | - | - | - | ||
| - | - | - | - | - | - | - | ||
| - | - | - | - | - | - | - | ||
| - | - | - | - | - | - | - | ||
| - | - | - | - | - | - | - |
Trade directly on the supercharts through our supported, fully-verified and user-reviewed brokers.


