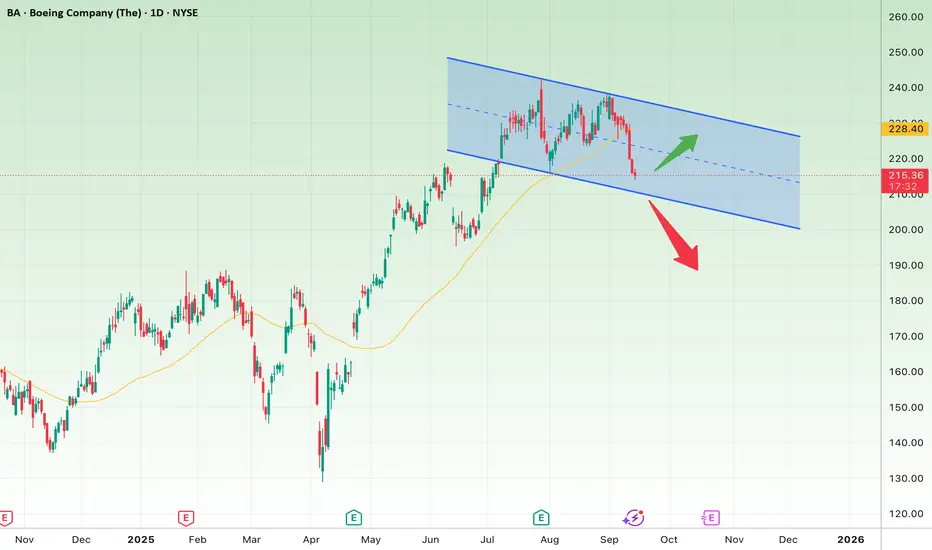
Professional Analysis of Boeing (BA) Stock – Daily TimeframeOn the daily chart, Boeing (BA) has entered a descending channel after a strong rally from the $175 lows up to around $240 highs.
Bullish Scenario:
The price is currently around $215, near the channel’s lower boundary.
If this support holds and the stock reclaims the 50-day moving average (yellow

The best trades require research, then commitment.
Get started for free$0 forever, no credit card needed

Scott "Kidd" PoteetThe unlikely astronaut

Where the world does markets
Join 100 million traders and investors taking the future into their own hands.
Major indices
Bitcoin - Will Bitcoin break out of range?!Bitcoin is above EMA50 and EMA200 on the four-hour timeframe and is in its ascending channel. If the downward trend continues towards the specified demand range, we can buy Bitcoin with appropriate risk-reward.
Bitcoin’s rise to around 121,000 and its arrival at the specified supply range will provi

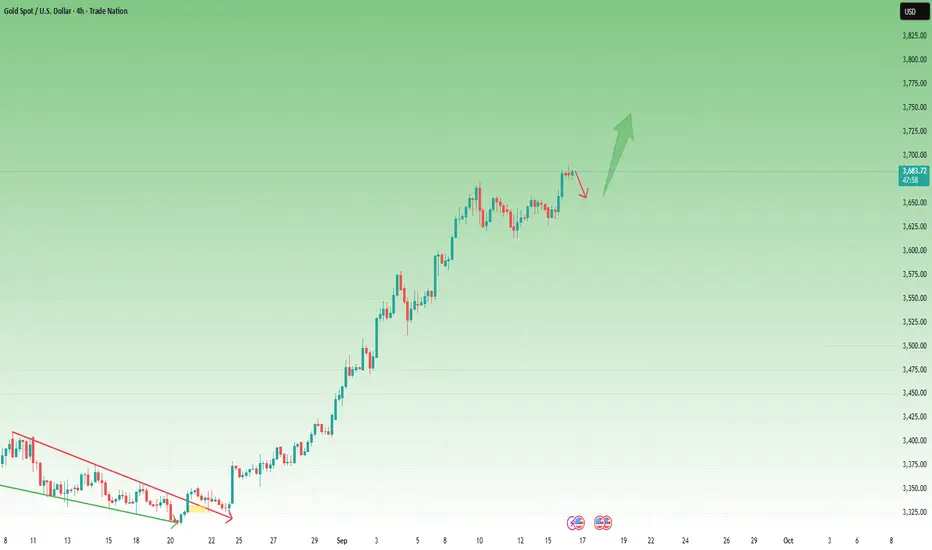
The Golden Run Continues: XAUUSD Eyes $3800? The Golden Run Continues: XAUUSD Eyes $3800?
Prior Bullish Momentum & Consolidation : XAUUSD entered a period of consolidation following a robust bullish rally earlier in the year. This initial surge established a strong underlying demand.
Symmetrical Triangle Formation : This consolidation p

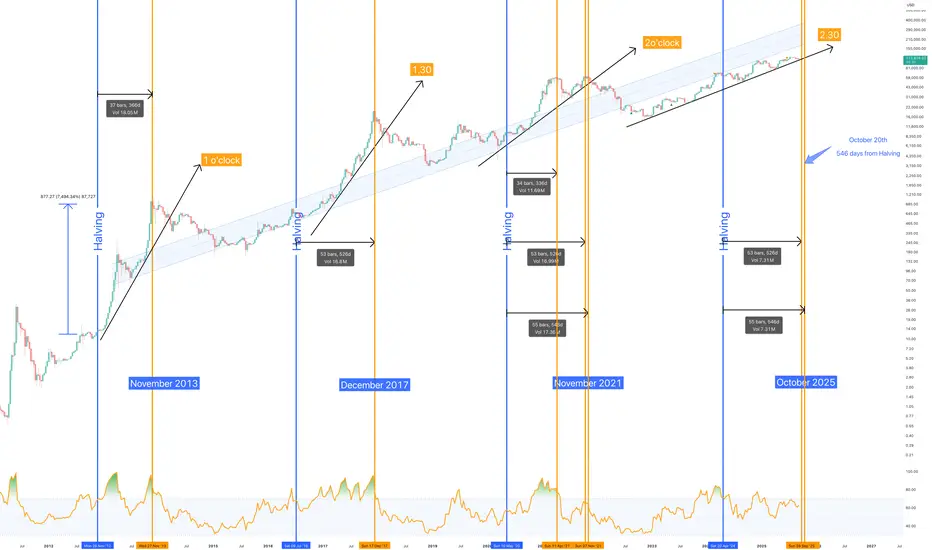
The end of Bitcoin…. begins in 40 days time @ ~$160k in Oct 2025** What the next 12 months will look like **
Let’s just start with a strong provocative title to raise the blood pressure.. “The end of Bitcoin”
…. with an explosion and then a slow erosion of relevance, that’s how.
Whether it withers through regulation, succumbs to its own technological limits
Why Ethereum is Outperforming Bitcoin? | FX ResearchWhile Bitcoin did manage to push to a fresh record high, the broader august trend reflected cautious investor sentiment, supported by modest momentum and ongoing macro uncertainty. The narrative suggests price resilience, but without the forcefulness needed for the next wave of bullish momentum.
I

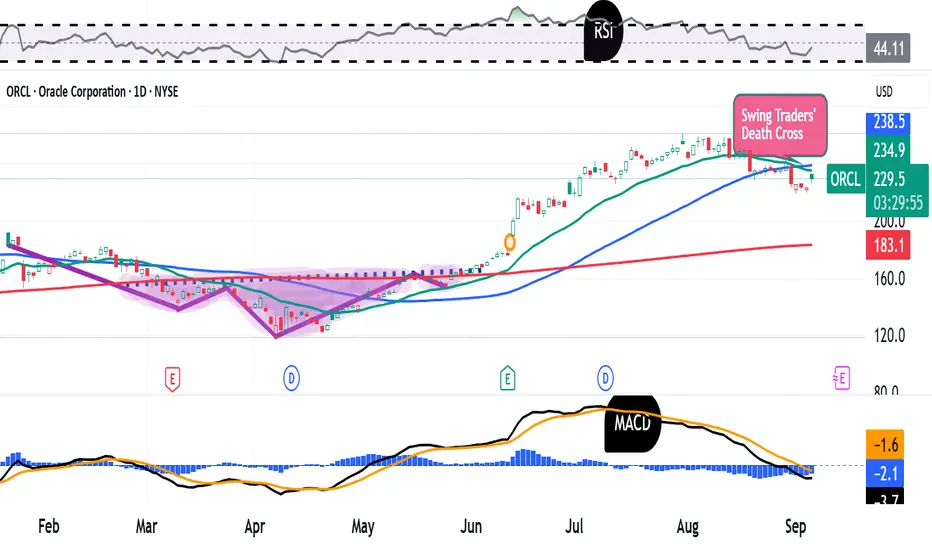
Oracle Is Up 80% Since April. What Does Its Chart Tell Us?Oracle NYSE:ORCL will release fiscal Q1 results next week at a time when the tech giant's stock has risen more than 80% from its April lows, but also given back some 15% since hitting a 52-week high in late July. Let's see what the stock's technical and fundamental analysis can tell us.
Oracle's
Long bond bulls’ eye bigger breakoutThe bullish move in U.S. ultra-long bond futures anticipated last week has played out nicely, with the contract surging higher over the subsequent days, taking out a key topside hurdle comprising the 200DMA and horizontal resistance at 119’19. The move has now stalled at a downtrend from the highs s

Downtrend in Dell?Dell Technologies has lagged the market for months, and some traders may see further downside in the maker of computer hardware.
The first pattern on today’s chart is the bearish gap on August 29 following quarterly results. While earnings and revenue beat estimates, investors focused on weaker mar

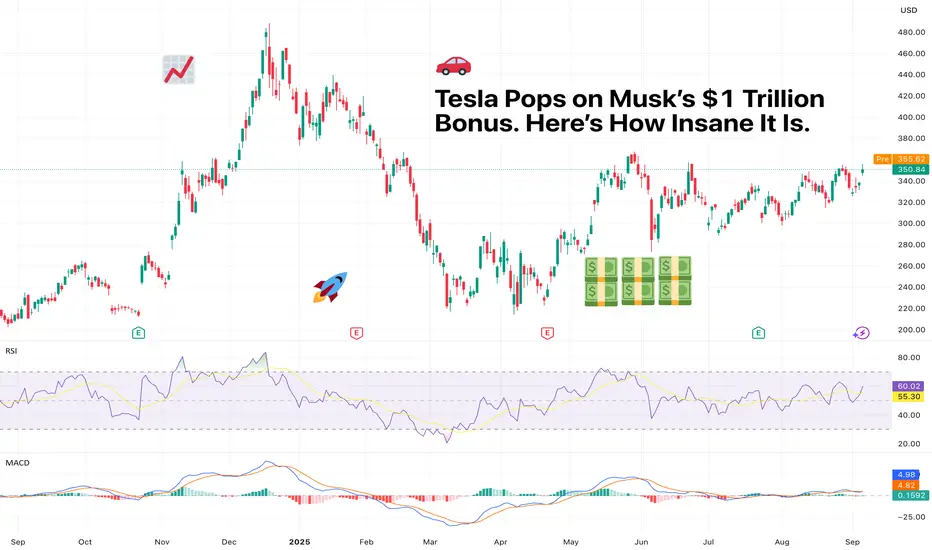
Tesla Pops on Musk’s $1 Trillion Bonus. Here’s How Insane It Is.The mother of all KPIs.
Elon Musk has a new carrot dangling in front of him, and it’s not a Mars colony or a flamethrower.
Tesla’s board is asking investors to approve a bonus so massive, so absurd, so galaxy-brained, that it makes past compensation packages look like pocket change.
Ready? We
NFP "Goldilocks" playbook? EURUSD triggers revealed!Markets are optimistic and consolidating ahead of the Non-Farm Payrolls (NFP) report, with EUR/USD poised for a breakout, plus a quick technical overview of gold, GBP/USD, and USD/JPY.
Mood : Buoyant—risk assets and equities are near weekly highs, bond yields are easing.
Consensus : A "Goldilocks

See all editors' picks ideas
Volume by Time [LuxAlgo]The Volume by Time indicator collects volume data for every point in time over the day and displays the average volume of the specific dataset collected at each respective bar.
The indicator overlays the current volume and the historical average to allow for better comparisons.
🔶 USAGE
Thr

FlowScope [Hapharmonic]FlowScope: Uncover the Market's True Intent 🔬
Ever wished you could look inside the candles and see where the real action is happening? FlowScope is your microscope for the market's flow, designed to give you a powerful edge by revealing the volume distribution that price action alone can't sh

VWAP Price ChannelVWAP Price Channel cuts the crust off of a traditional price channel (Donchian Channel) by anchoring VWAPs at the highs and lows. By doing this, the flat levels, characteristic of traditional Donchian Channels, are no more!
Author's Note: This indicator is formed with no inherent use, and serves

Fibonacci Sequence Circles [BigBeluga]🔵 Overview
The Fibonacci Sequence Circles is a unique and visually intuitive indicator designed for the TradingView platform. It combines the principles of the Fibonacci sequence with geometric circles to help traders identify potential support and resistance levels, as well as price expansio

ATAI Volume Pressure Analyzer V 1.0 — Pure Up/DownATAI Volume Pressure Analyzer V 1.0 — Pure Up/Down
Overview
Volume is a foundational tool for understanding the supply–demand balance. Classic charts show only total volume and don’t tell us what portion came from buying (Up) versus selling (Down). The ATAI Volume Pressure Analyzer fills that g

Market Cap Landscape 3DHello, traders and creators! 👋
Market Cap Landscape 3D. This project is more than just a typical technical analysis tool; it's an exploration into what's possible when code meets artistry on the financial charts. It's a demonstration of how we can transcend flat, two-dimensional lines and step into

ZigzagLiteLibrary "ZigzagLite"
Lighter version of the Zigzag Library. Without indicators and sub-component divisions
method getPrices(pivots)
Gets the array of prices from array of Pivots
Namespace types: Pivot
Parameters:
pivots (Pivot ) : array array of Pivot objects
Returns: array array

ZigzagLibrary "Zigzag"
Zigzag related user defined types. Depends on DrawingTypes library for basic types
method tostring(this, sortKeys, sortOrder, includeKeys)
Converts ZigzagTypes/Pivot object to string representation
Namespace types: Pivot
Parameters:
this (Pivot) : ZigzagTypes/Pivot

Angled Volume Profile [Trendoscope]Volume profile is useful tool to understand the demand and supply zones on horizontal level. But, what if you want to measure the volume levels over trend line? In trending markets, the feature to measure volume over angled levels can be very useful for traders who use these measures. Here is an att

MathEasingFunctionsLibrary "MathEasingFunctions"
A collection of Easing functions.
Easing functions are commonly used for smoothing actions over time, They are used to smooth out the sharp edges
of a function and make it more pleasing to the eye, like for example the motion of a object through time.
Easing function

See all indicators and strategies
Community trends
Tesla - Here we goooooo!🚗Tesla ( NASDAQ:TSLA ) is finally breaking out:
🔎Analysis summary:
Finally, after a consolidation of four years, Tesla is attempting another all time high breakout. With the bullish triangle coming to an end, bulls are dominating this stock. It just comes down to the next couple of months but

Professional Analysis of Boeing (BA) Stock – Daily TimeframeOn the daily chart, Boeing (BA) has entered a descending channel after a strong rally from the $175 lows up to around $240 highs.
Bullish Scenario:
The price is currently around $215, near the channel’s lower boundary.
If this support holds and the stock reclaims the 50-day moving average (yellow
9/16/25 - $qbts - Grim RIP'per9/16/25 :: VROCKSTAR :: NYSE:QBTS
Grim RIP'per
- as the weird times are upon us
- and have been
- get yourself a healthy dose of Halloween in Sep with NYSE:QBTS
- trick or treat = F. A. F. O.
- well for $6B, i probably get something nice, right?
- yes $25 million of revenue
- it makes money ri

TESLA - Robotaxi will drive the price above 1000This is not a short-term trade as you know from me on FX, Crypto and Indices. This is buy and hold investment. I got already good bag of share and Im still adding without trying to time if perfectly, but now I think its time to buy bigger positions.
Tesla is my 3rd biggest position after the Bitcoi

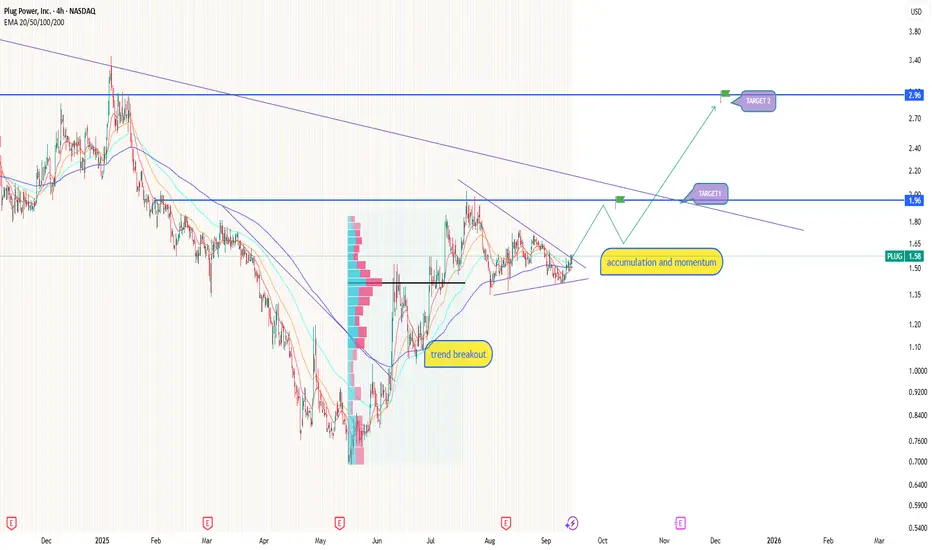
PLUG: accumulation turning into breakout fuelPlug Power is slowly emerging from a long downtrend, building an accumulation structure after a trendline breakout. On the 4H chart, price is consolidating around 1.55–1.60 and gaining momentum. The first upside target is 1.90, where buyers will be tested. A strong breakout could open the way toward
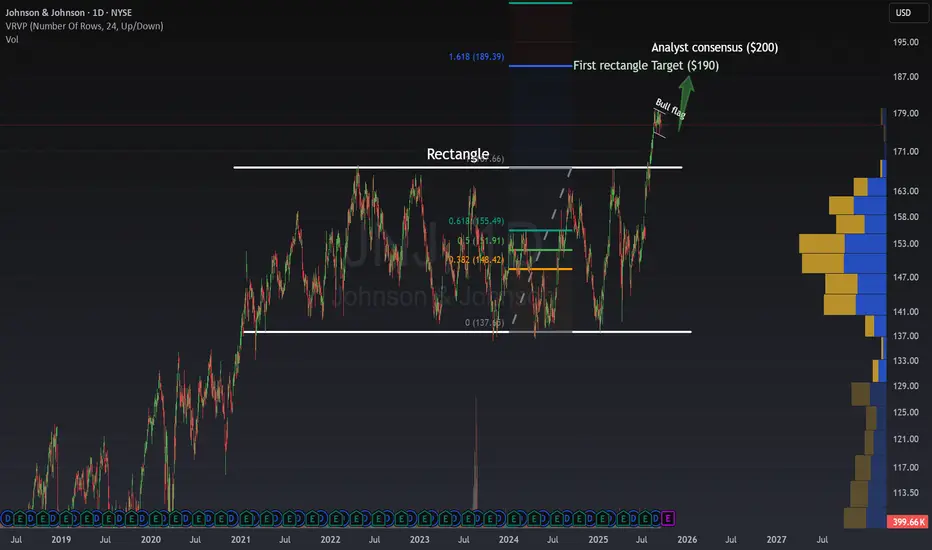
JNJ is unchainedJNJ is unchained
JNJ has spent 4 years moving sideways, which basically means the market agreed this was the fair price f or the stock.
But this August, we saw analysts like Joanne Wuensch from Citi start pointing to the $200 zone , and it looks like she might have been right. 🚀
If you missed
SNOW BUYSnowflake (SNOW) has positioned itself as the backbone for AI applications. By managing and streamlining data across platforms, Snowflake is enabling companies to build smarter AI systems.

RIO Monthly Breakout + Cheap P/E → $90-$120 Target📊 Technical Setup: RIO has been coiling in a giant monthly triangle since the 2021 peak. Price is pressing against long-term support around $63. A breakout from here projects first to $90 and then into the $110-$120 zone over the next 12-18 months.
💰 Valuation: Trailing EPS ≈ $6.28. Current P/E ≈ 1

IONQ BUY SET UPPrice has broken out of a triangular consolidation, with fundamentals supporting the move.
The UK just cleared IonQ’s Oxford Ionics acquisition, strengthening its quantum hardware capabilities. At the same time, revenue growth and improving financials add weight to the bullish breakout.

What Is Beta in Stocks and How May It BeUsed?What Does Beta Mean in Stocks, and How May It Be Used in Risk Management?
Beta is a key measure of how a stock moves relative to the market, helping traders assess risk exposure and price volatility. Understanding this indicator can help traders analyse potential price swings and portfolio stabili
See all stocks ideas
Today
GISGeneral Mills, Inc.
Actual
—
Estimate
0.81
USD
Today
MANUManchester
Actual
—
Estimate
0.01
USD
Today
BNEDBarnes & Noble Education, Inc
Actual
—
Estimate
—
Today
LITSLite Strategy, Inc.
Actual
—
Estimate
—
Today
GMGIGolden Matrix Group, Inc.
Actual
—
Estimate
−0.00
USD
Today
IXHLIncannex Healthcare Inc.
Actual
—
Estimate
−0.29
USD
Today
NCPLNetcapital Inc.
Actual
—
Estimate
−0.34
USD
Today
RZLTRezolute, Inc.
Actual
—
Estimate
−0.22
USD
See more events
Community trends
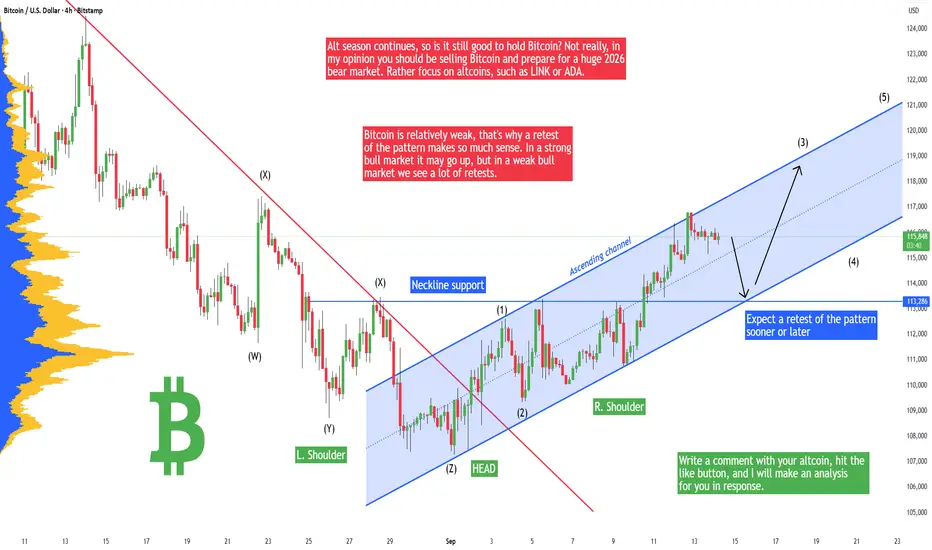
Bitcoin - Must go down to retest this pattern + new ATH soon!Bitcoin recently broke out of the head and shoulders pattern and made a pretty strong uptrend. That's a sign of strength that Bitcoin will be ready to continue in the uptrend and go to a new all time high, but not yet! I still think that Bitcoin should retest the previous Head and Shoulders pattern
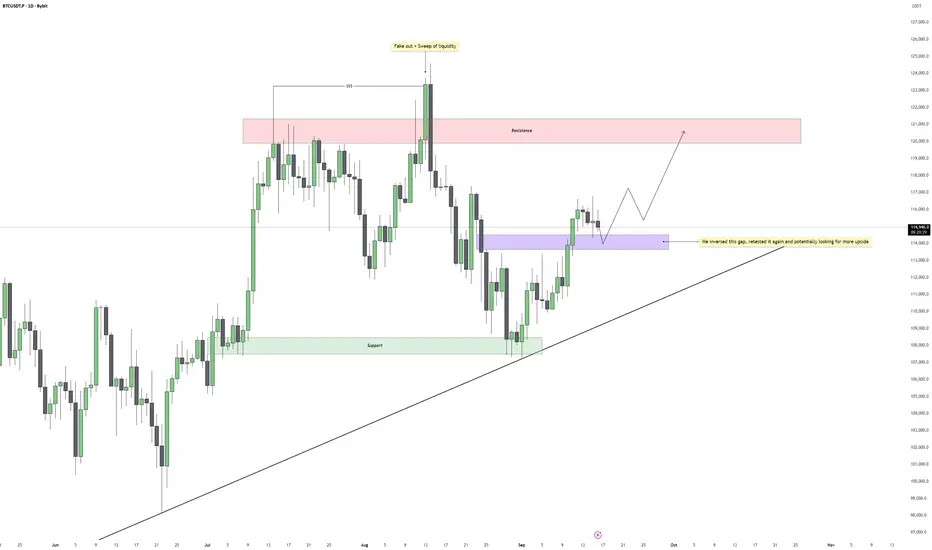
Bitcoin - Daily Gap Inversion Aligns with UptrendBitcoin recently made a push higher that cleared local highs and swept liquidity above the previous range. This move created a temporary fake out before price sharply retraced, filling inefficiencies left behind in the market. After completing this corrective move, price has begun reclaiming structu
Bitcoin fall ahead or breakout and new ATHstill the price is near 116K$ which is strong and major resistance of market and if it hold then heavy dump here will lead dump price even below 100K$ this time but also we can expect more rise and gain if we see valid breakout to the upside and then at least targets like 130K$ is easy one for bulls

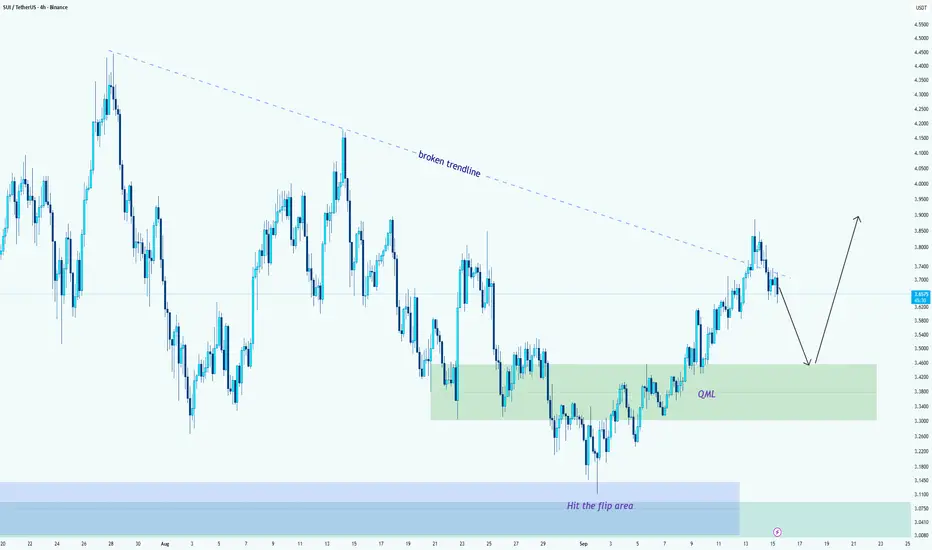
SUI/USDT --> Two-Step Setup: Retest QML, Then RallyHello guys!
Short version first: I expect a pullback to the QML (3.30–3.45), then a bounce that resumes the upside toward 3.80–3.90 (and potentially higher if momentum continues).
Why this makes sense (the plan):
Step 1 --> Pullback to QML:
Price broke the long descending trendline and i
BITCOIN 1W Stoch RSI completed a Bullish Cross. Expect new ATH.Bitcoin (BTCUSD) just completed a Bullish Cross on its 1W STOCH RSI and that's the first time it does so since April 07 2025. That was as we know, the previous market bottom of the Trade War correction.
In fact, every 1W STOCH RSI Bullish Cross has been a buy signal within this Bull Cycle's Channel

BTC: From Triangle to Flag → 118K?Let's take a look at the recent market context. Bitcoin climbed aggressively, creating a powerful impulsive leg upward.
That rally formed the pole of our bullish flag, a clear continuation pattern.
After that, price consolidated, shaping a tight, downward-sloping flag, while overall momentum stayed

$SOLANA 250+ or bearish trend to 225/200With the recent solana pump, major profits have been taking place.
However, SOL stopped out at 249. Just under the Psychological level of 250.
On this chart we can see the following:
- Supply & Demand
- Anchored Volume
- Pattern: BF / BC /SR
- Two 4 hour FVG's below price, with HTF GP on the seco

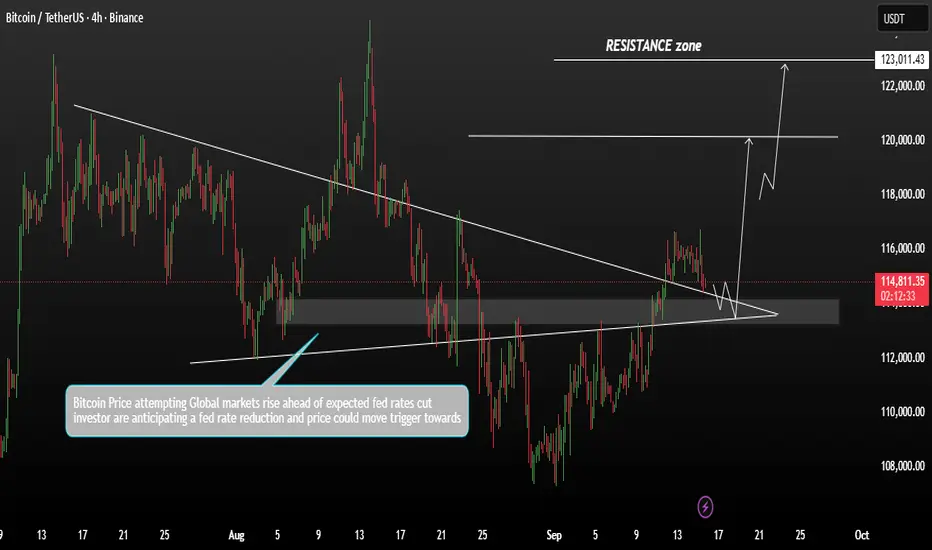
BTCUSDT Open Ways correction before another buying attemptBitcoin Technical Outlook Market is consolidating near this zone. A false breakdown below support has already occurred, attracting buyers back into the range.
Key Levels for watch :
1st Resistance 120,000
2nd Resistance : 123,000
if Price action is waiting for confirmation from potential Fed rate
PEPEUSDT -the easiest way to get ur capital Tripled!Let me tell you the fastest way to triple your capital at the beginning of 2026.
The CRYPTOCAP:PEPE chart looks extremely tempting right now, and since it’s one of the coins with insane price action, you really don’t want to miss this opportunity.
On the 3D timeframe , PEPE has formed a symmet

Lingrid | ETHUSDT Pullback Entry Continuation SetupBINANCE:ETHUSDT is trading above its key support at 4,400 after a rebound from the upward trendline, showing resilience despite recent pullbacks. The structure highlights a breakout from the falling wedge and the formation of higher lows, signaling accumulation before continuation. If buyers defend

See all crypto ideas
1000 USD: Coffee Bull Market Overview: Prices set to DOUBLE ☕ Coffee (Arabica, ICE “KC”) — Outlook to 2026
Where we are: Nearby Arabica trades ~405–410 US¢/lb after a parabolic 2025 on weather stress, thin deliverable stocks, and policy shocks. The Dec ’25 contract is ~400 ¢/lb.
Big picture 2025/26: Official global production is pegged at a record ~178.7 M

GOLD → Testing 3700. What to expect from the price going forwardFX:XAUUSD continues to rally. Ahead lies the psychological barrier of 3700, where the market may form profit-taking ahead of Tuesday and Wednesday's news...
Gold is testing 3700. The bullish trend remains unshakable thanks to a combination of macroeconomic and geopolitical factors.
Expectation

Lingrid | GOLD Record Breaking Rally ContinuesOANDA:XAUUSD is maintaining bullish structure after bouncing from higher lows and breaking through the 3,670 level, reinforcing upward momentum. Price is now consolidating just below the resistance zone, with the upward channel continuing to guide direction. If buyers hold above 3,670, gold could e

XAU/USD | Gold Prints New ATH at $3,685 – Rate Cut Rally Ahead?By analyzing the gold chart on the 1-hour timeframe, we can see that the price broke the key $3,657 level, just as expected, and today it even printed a new ATH at an impressive $3,685! As you know, this week is the interest rate decision week, and markets are preparing for a rate cut — either 0.25%

GOLD: Remains In a Very Risky PositionGOLD: Remains In a Very Risky Position
The current price of gold is around 3643. Currently, the price is moving sideways within a triangle pattern (consolidation). The highest price ever reached was at 3675.
The current picture is a bit complex, considering that after the Gold reached 3675 withou

Complacency Before the Fall? Bulls in Control, But For How Long?Yesterday, I was debating whether last week’s consolidation was a rectangle (suggesting continuation) or, in fact, a triple top (hinting at correction). I began the session with a slightly bearish bias, but the reversal from support and the subsequent breakout above the consolidation’s resistance fo
Gold will correct to support area and then continue to growHello traders, I want share with you my opinion about Gold. The market context for Gold has been firmly bullish, with the price action being guided by a well-established upward channel that has defined the trend for a significant period. The structure of this channel has been confirmed by multiple r

President Trump Speaks, Israel Strikes—What’s Gold Gonna Do?Hey Guys,
It’s been a while since I dropped a gold chart. Got a ton of requests—so here’s a fresh swing setup for you.
Fundamentally, President Trump recently said “Trump says his patience with Putin is running out.” That kind of statement adds fuel to gold’s upside. Plus, Israel’s attacks in the

Gold Surges - Shining Bright In Green.👋Hello everyone, what do you think about OANDA:XAUUSD trend?
Yesterday, gold continued to shine with another strong session, climbing close to the 3700 USD target. At the time of writing, it’s consolidating around 3680 USD, showing that bullish momentum is still intact.
Gold started the week tra

Gold 30Min Engaged ( Bullish entry Detected )Time Frame: 30-Minute Warfare
Entry Protocol: Only after volume-verified breakout
🩸Bullish Movement From : 3645
➗ Hanzo Protocol: Volume-Tiered Entry Authority
➕ Zone Activated: Dynamic market pressure detected.
The level isn’t just price — it’s a memory of where they moved size.
Volume is rising

See all futures ideas
EURAUD Triple Bottom SpottedPrice on EURAUD has been in a strong downtrend, pressing lower with sellers in control.
But notice what happens at this level.
Price tests it once… bounces.
Comes back again…
And then a third time, buyers defend the level once more.
That’s a clear Triple Bottom, a strong sign that sellers are los

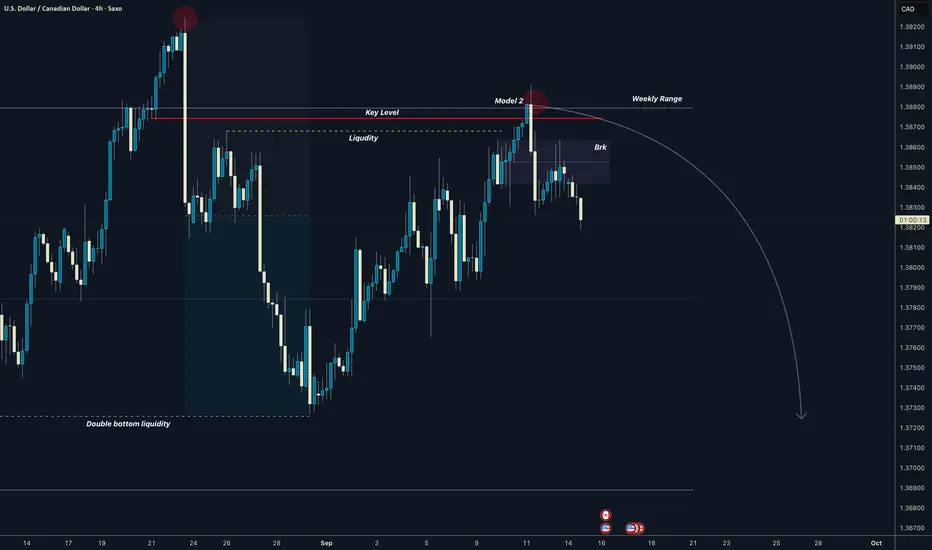
USDCAD Weekly Range Model 2Bearish setup from the weekly range retest from the key level.
Weekly Range manipulated
Price dropped down and created double bottom = Liqudity
Pullback to the Premium liquidity
Rejection + Breaker
Targeting 50% of Range and Double bottom , then Range low
Note: FOMC this week. it can b
AUDUSD – Testing the 0.6670 Resistance -->Breakout ? Hello everyone, let’s discuss OANDA:AUDUSD !
Today, the pair maintains its bullish momentum, trading near 0.6670 since the start of the session. The Aussie dollar is strengthening as demand for risk-sensitive assets rises, fueled by solid expectations that the Federal Reserve will begin its monet

EUR/NZD – Trendline Broken, Bears Warming UpAfter touching the psychological 2.00 handle once more at the end of August, EUR/NZD started to fall. Last week, the pair finally broke below the rising trendline that had been intact since June — a technical signal that momentum is shifting.
Following the recent low at 1.9627, the pair is now in a

16.09.25 Morning ForecastPairs on Watch -
FX:AUDJPY
FX:GBPJPY
FX:EURNZD
A short overview of the instruments I am looking at for today, multi-timeframe analysis down to what I will be looking at for an entry. Enjoy!

USD/CAD - Bearish Flag (15.09.2025)The USD/CAD Pair on the M30 timeframe presents a Potential Selling Opportunity due to a recent Formation of a Bearish Flag Pattern. TRADENATION:USDCAD
This suggests a shift in momentum towards the downside in the coming hours.
Possible Short Trade:
Entry: Consider Entering A Short Position

EURUSD: Is the USD Weakness Already Priced In?Is the USD Weakness Already Priced In?
The market expects the Fed to cut rates by 25 basis points at this meeting.
Right now, the main story is that this expectation is driving the USD lower. But is that really the reason behind the weakness?
The USD has often shown weakness no matter the news

GBPUSD – Buyers Are Gaining Momentum!OANDA:GBPUSD Looking at today’s chart, it’s hard to ignore the strength of GBPUSD. Price continues to climb steadily within a rising channel – a clear sign that momentum remains with the buyers.
The recent break & retest was the highlight: price broke above resistance, pulled back to test it, and

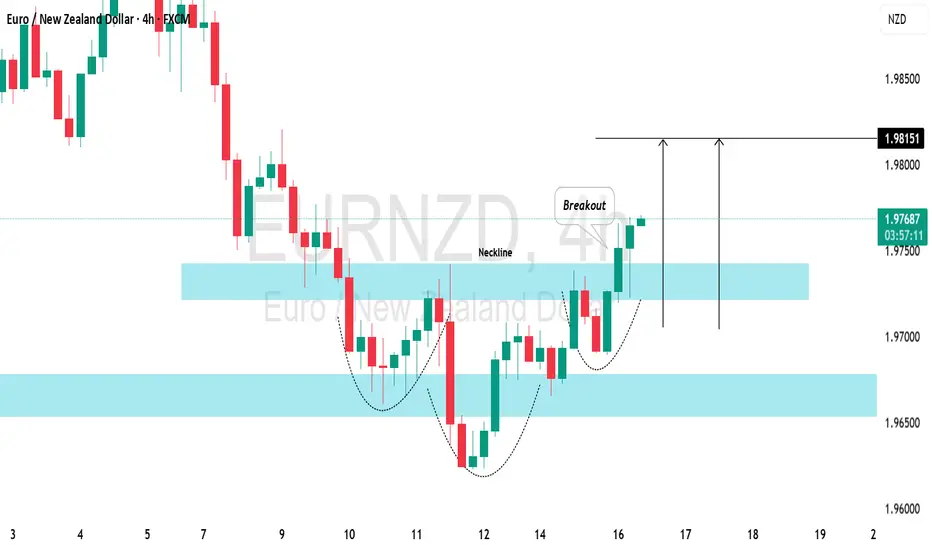
EURNZD: Time For PullbackThe EURNZD pair has recently tested a significant daily/intraday support level.
Following a test of the identified support structure, the market formed an inverted head and shoulders pattern on the 4-hour timeframe.
A bullish breakout above the neckline of this pattern suggests a strong bullish si
EURUSD This is its final rally before Bear Market.The EURUSD pair has been rising aggressively within a (blue) Channel Up since the January 13 2025 bottom. The current Bullish Leg started 6 weeks ago when it hit the 1D MA100 (red trend-line) and rebounded.
This is a critical buy level as it has supported all similar Channel Up patterns since Janua

See all forex ideas
| - | - | - | - | - | - | - | ||
| - | - | - | - | - | - | - | ||
| - | - | - | - | - | - | - | ||
| - | - | - | - | - | - | - | ||
| - | - | - | - | - | - | - | ||
| - | - | - | - | - | - | - | ||
| - | - | - | - | - | - | - | ||
| - | - | - | - | - | - | - |
Trade directly on the supercharts through our supported, fully-verified and user-reviewed brokers.


