EUR/AUD at a Crossroads!The EUR/AUD pair is trading in an upward trend on the four-hour timeframe following the pullback that took place between November 25 and December 10.
The pair is now at a crossroads between continuing the upward trend from the current support levels at 1.77340 and 1.77154, targeting 1.77792 as the
Your 2025 space mission is here
Suit up and get ready to explore every highlight of your trading galaxy.


Navigating Volatility Amid Unprecedented Scale and Future InvestNASDAQ:META Meta Platforms, Inc. (META) presents a compelling bullish case rooted in its unparalleled execution within the digital advertising core business, juxtaposed against significant strategic investments in future technologies—investments that, while costly, are funded by immense cash flows
GC(XAU/USD) technical analysis and directional opinion*In this analysis I will not include macroecnomic analysis as we all know broad financial market is waiting for BoJ to create clear directional bias upcoming end of this week on Friday. However I will make a seperate post regarding "How to decode BoJ decision" on the day before the Japanese rate dec

Nasdaq-100: Lower Low and Lower High?The Nasdaq-100 made a lower low, and now it might have made a lower high.
The first pattern on today’s chart is the November 21 low of 23,854, some 353 points below the October trough. That broke a series of higher lows since April.
Second, the tech-heavy index peaked at 25,835 on December 10. Tha

Lingrid | GOLD Sideways Movement Ahead of FOMC DecisionOANDA:XAUUSD perfectly played out my previous trading idea . Price is holding inside a well-defined consolidation after its prior surge, with price rotating above the rising channel base. The trend remains constructive, but momentum has cooled, suggesting participants are waiting for a catalyst ra

BOJ to Stress Test Global Markets? Why a Black Swan Is PossibleWhile US markets are busy debating AI valuations and parsing the Fed’s latest rate cut , something far more understated — and potentially more disruptive — is brewing across the Pacific.
The Bank of Japan is expected to raise interest rates on Friday, marking what could be its first hike in 11 mon

GOOG: Is a 10% Surge Imminent? The Setup for $340 Explained🚀 NASDAQ:GOOG : Is a 10% Surge Imminent? The Setup for $340 Explained
In the noisy world of trading, clarity is power.
Today, we are looking at Alphabet Inc. (GOOGL). We are not predicting the future, we are simply preparing for a high-probability outcome.
We have identified a textbook Bull Fla

DOGE pulls back before major decline DOGECOIN is in a range formed against the backdrop of a downtrend. The market is under pressure from above at 0.155 - 0.153 - 0.150. The structure is bearish. The rebound from 0.134 is directed towards 0.1415. A false breakout could trigger a decline.
There is no volume from the bulls, and the mark

BTC Corrections Don’t Kill Bull Market. They Power Them1. Primary Trend Structure
Macro trend: Clearly bullish. Price has respected a rising diagonal trendline since the 2022–2023 cycle low. Market structure shows higher highs and higher lows, confirming an intact uptrend.
This is a classic bull market staircase: impulsive advances (green boxes) follo

2025 BITCOIN TARGETS: Reality Check
Forecasting is easy. Being right is hard.
1. When Targets Turn Into Illusions
Look at this chart.
Bitcoin at $90,000. Sixteen days left in 2025.
And every “expert” target — JPMorgan, VanEck, Standard Chartered, Tom Lee, Kiyosaki, BlackRock, Cathie Wood —
all of them missed. Every single one.

See all editors' picks ideas
Multi-Ticker Anchored CandlesMulti-Ticker Anchored Candles (MTAC) is a simple tool for overlaying up to 3 tickers onto the same chart. This is achieved by interpreting each symbol's OHLC data as percentages, then plotting their candle points relative to the main chart's open. This allows for a simple comparison of tickers to tr

Vdubus Divergence Wave Pattern Generator V1The Vdubus Divergence Wave Theory
10 years in the making & now finally thanks to AI I have attempted to put my Trading strategy & logic into a visual representation of how I analyse and project market using Core price action & MacD. Enjoy :)
A Proprietary Structural & Momentum Confluence System

Per Bak Self-Organized CriticalityTL;DR: This indicator measures market fragility. It measures the system's vulnerability to cascade failures and phase transitions. I've added four independent stress vectors: tail risk, volatility regime, credit stress, and positioning extremes. This allows us to quantify how susceptible markets are

Volatility Risk PremiumTHE INSURANCE PREMIUM OF THE STOCK MARKET
Every day, millions of investors face a fundamental question that has puzzled economists for decades: how much should protection against market crashes cost? The answer lies in a phenomenon called the Volatility Risk Premium, and understanding it may fundam

Volume Gaps & Imbalances (Zeiierman)█ Overview
Volume Gaps & Imbalances (Zeiierman) is an advanced market-structure and order-flow visualizer that maps where the market traded, where it did not, and how buyer-vs-seller pressure accumulated across the entire price range.
The core of the indicator is a price-by-price volume prof

Match Finder [theUltimator5]Match Finder is the dating app of indicators. It takes your current ticker and finds the most compatible match over a recent time period. The match may not be Mr. right, but it is Mr. right now. It doesn't forecast future connection, but it tells you current compatibility for today.
Jokes aside,

Trend Line Methods (TLM)Trend Line Methods (TLM)
Overview
Trend Line Methods (TLM) is a visual study designed to help traders explore trend structure using two complementary, auto-drawn trend channels. The script focuses on how price interacts with rising or falling boundaries over time. It does not generate trade sign

Breakouts & Pullbacks [Trendoscope®]🎲 Breakouts & Pullbacks - All-Time High Breakout Analyzer
Probability-Based Post-Breakout Behavior Statistics | Real-Time Pullback & Runup Tracker
A professional-grade Pine Script v6 indicator designed specifically for analyzing the historical and real-time behavior of price after strong All-Ti

Count█ OVERVIEW
A library of functions for counting the number of times (frequency) that elements occur in an array or matrix.
█ USAGE
Import the Count library.
import joebaus/count/1 as c
Create an array or matrix that is a `float`, `int`, `string`, or `bool` type to count elements from, t

Holographic Market Microstructure | AlphaNattHolographic Market Microstructure | AlphaNatt
A multidimensional, holographically-rendered framework designed to expose the invisible forces shaping every candle — liquidity voids, smart money footprints, order flow imbalances, and structural evolution — in real time.
---
📘 Overview
The Hol

See all indicators and strategies
Community trends
Intc The technicals are pointing towards 41-45$ in the next 2weeks..
3 things make me come to that conclusion.
1. Inverted hammer at the end of a downtrend with volume.
2. Retest of up trend from 19$ lows
3. 4hour Money flow and Macd went too oversold on the most recent pullback.. each time t

Triple bottom, potential (devastating) double-UpThe price is moving near its lows despite steadily increasing revenue.
The current formation is a double or triple bottom with a neckline at $29.3. At the moment, the price continues to decline, following the blue resistance — it’s better to wait for a breakout with a close above it before starting

PLTR GEX - Bull Flag Breakout SetupPLTR Technical & Options Setup Overview
PLTR is setting up a clean bull flag breakout on the daily chart, following a strong impulsive leg higher.
The consolidation has been holding above the 50-day moving average , which has acted as dynamic support throughout the flag structure. Two sessions

Breaking; Plug Power Set to Install 5MW GenEcoPlug Power Installs 5MW GenEco Electrolyzer with Cleanergy Solutions Namibia for Africa’s First Fully Integrated Green Hydrogen Facility.
The Walvis Bay project plant, which officially opened in September, represents Africa’s first fully integrated commercial green hydrogen facility and will serve
Is Visa Ready for a Deeper Drop? Key Daily Levels in Focus👋 Hello & Respect to All Traders
Hello and respect to all traders and dedicated TradingView followers 🙌
Wishing you disciplined trades, solid risk management, and consistent execution 📊🧠
💳 Visa Inc. – Company Overview
Visa Inc. (V) is one of the world’s largest electronic payment networks, provid

$CELH – A Multifaceted Growth Engine Poised for AppreciationCelsius Holdings has transformed from a niche energy drink brand into a formidable, multi-brand growth platform. While the organic growth rate of its flagship Celsius line has moderated from its initial explosive phase—a natural evolution following its groundbreaking distribution partnership with Pe

META Regains Direction as Price Rebuilds MomentumMeta Platforms is showing a constructive shift in price behaviour on the 4H timeframe after a corrective phase, with structure beginning to realign in favour of continuation. The recent recovery suggests buyers are gradually reasserting control as the market reassesses growth expectations and broade

UBER shortSupply Zone had been confirmed
Looks like ABC Pattern.
Stop 93,
Short entry 91
Target 82, 75
Risk management is much more important than a good entry point.
I am not a PRO trader.
In my trading plan, the Max Risk of each short term trade should be less than 1% of an account.

"VG" Inverse Head & Shoulders Pattern @ 1H FrameThe price action of the 1H timeframe shows a well developed inverse head and shoulders pattern, which is a classically a trend-reversal formation from bearish to bullish.
The neckline is sloping slightly downward, curranty around 6.3 - 6.35

Adyen 1W: The trend broke twice, the market is just catching upOn the weekly chart, Adyen has broken the long term downtrend twice, and price is now performing a controlled pullback retest. The current consolidation holds above the $15.5–16.0 demand zone, where MA100, 0.786 Fibonacci and strong volume profile support align. Selling pressure is fading, volumes
See all stocks ideas
Tomorrow
EBFEnnis, Inc.
Actual
—
Estimate
0.41
USD
Dec 23
GTIMGood Times Restaurants Inc.
Actual
—
Estimate
—
Dec 23
USBCUSBC, Inc.
Actual
—
Estimate
−2.40
USD
Dec 23
LMNRLimoneira Co
Actual
—
Estimate
−0.11
USD
Dec 31
KAVLKaival Brands Innovations Group, Inc.
Actual
—
Estimate
—
Dec 31
JVACoffee Holding Co., Inc.
Actual
—
Estimate
—
Dec 31
MSSMaison Solutions Inc.
Actual
—
Estimate
0.00
USD
Jan 1
PKEPark Aerospace Corp.
Actual
—
Estimate
—
See more events
Community trends
Ethereum (ETHUSDT): Short-Term Recovery Attempt Hi guys!
ETH is still trading inside a well-defined descending channel, keeping the broader short-term structure bearish. The previous upside breakout attempt near the upper boundary resulted in a clear fakeout, confirming strong supply pressure at higher levels. Following that rejection, price exp

Bitcoin’s Next Move Starts Here Key Levels MappedBTC is currently in a technically critical phase. Price is trading below a major dynamic trendline resistance after a confirmed bearish break, keeping the broader structure corrective rather than impulsive. Momentum remains capped unless bulls reclaim key dynamic levels.
The plan from here is stra

BTCUSDTHello Traders! 👋
What are your thoughts on Bitcoin?
Bitcoin has entered a corrective phase after a strong bearish move and is currently ranging between a clearly defined support and resistance zone. As long as price remains inside this range, no major directional move is expected.
At the moment,

ETH/USD Bearish Structure with Downside TargetsETH/USD is showing clear bearish pressure after repeated failures to sustain above the highlighted supply zone around the 3,050–3,100 area. Price action indicates a lower high structure, followed by a strong rejection from the Ichimoku cloud, suggesting sellers remain in control. The cloud ahead is

Hey guys guess what !!! $BTC is strong !!!If we pump this we break out of a long down trend. If you look to the left we have a similar structure that broke out the same way.
Do you think we can see history repeat it self ?
Comment like and share for more charts.
(If you need me to draw something up for you comment bellow)

ETH Holds Support - Bulls Still in Play!?📈ETH has been trading within a rising broadening wedge pattern.
⚔️This week, price rejected the lower boundary of the structure.
🏹As long as the wedge remains intact, and ETH holds above the last major low at $2,750, a bullish continuation toward the upper boundary of the wedge remains the favo

BTC Gold - BKC Charting ExampleBare Knuckle Charting BKC is something I developed (And still developing) over the years.
I will use this chart to give you a crash course in BKC.
Here is the original post I made back in March to follow along. )
So, BKC, let's start with:
1. Always start with a plain chart.
2. 99.9% of the time


bitcoin correction Targeting 73700 for wave C completion. Sell entry at current price. Got my eyes on that 73700 mark for wave C. Placing a sell order right now at market price. Let's see if this plays out. Tight stop loss, just in case.

DOGEUSDT above 0.15$ the massive pump will start again soonAs highlighted in our previous analysis, the $0.15 level remains a significant technical resistance for DOGE. A decisive breakout above this level—particularly with increasing trading volume—would serve as a key confirmation of renewed bullish momentum and likely initiate a sustained upward move.
I

See all crypto ideas
Gold (XAUUSD) | 1H SMC Liquidity Outlook
Price rejected from 4350–4360 resistance and is testing 4310 support.
A break below support may target 4265; otherwise, price may consolidate.
Price is consolidating below a key resistance zone around 4350–4360, showing rejection after a recent push higher. Market remains within an ascending chann

XAUUSD Short: Supply Zone Holds - Gold Slips Into CorrectionHello traders! Here’s a clear technical breakdown of XAUUSD (Gold) based on the current chart structure. Gold is still trading within a broader ascending trend, supported by a well-defined rising trend line from the pivot point. The market previously made an impulsive bullish move, but price has now

GOLD 1H CHART ROUTE MAP UPDATE & TRADING PLAN FOR THE WEEKHey Everyone,
Please see our 1h chart levels and targets for the coming week.
We are seeing price play between two weighted levels with a gap above at 4360 and a gap below at 4327, as support. We will need to see ema5 cross and lock on either weighted level to determine the next range.
We will se

XAUUSD (H4) – Weekly Outlook (Dec 22–26)Buy the dip inside the channel, watch for a short-term correction after Wave 5
Strategy summary for next week
On the H4 chart, gold is still trading inside a mid-term rising channel. However, the wave structure suggests Wave 5 is likely завершed, so next week I’m focusing on two main ideas:
Mid-te

XAUUSDHello Traders! 👋
What are your thoughts on GOLD?
Gold is currently trading near its all-time high (ATH) and the upper boundary of a short-term ascending channel.
This zone has acted as a strong resistance area, where price has been rejected multiple times in the past.
As long as price remains belo

Gold 1H – CPI Data Uncertainty Fuels Liquidity Traps at Extremes🟡 XAUUSD – Intraday Smart Money Plan | by Ryan_TitanTrader (19/12)
📈 Market Context
Gold is trading in a tightly engineered range as markets digest the latest U.S. CPI print, which has drawn caution from economists over data reliability and seasonal distortions.
Despite headline inflation showing si

XAUUSD Demand Holding - Resistance Retest in PlayHello traders! Here’s my technical outlook on Gold (XAUUSD, 4H) based on the current chart structure. After a strong bullish impulse from the 3,650–3,700 area, price formed a clear ascending channel, respecting both rising support and resistance. Higher highs and higher lows continue to confirm bull

Gold at 4338: Pricing the Russia–Ukrain War, and Repricing PeaceDate: Saturday, 20-12-2025
Gold Weekly Close: 4338 USD
While preparing a comprehensive outlook for gold, I stepped back from short-term forecasts and focused on the bigger picture.
Specifically, the historical charts and the extraordinary price expansion gold has experienced over the last three yea

Weekly review of Overall Market
Commodities:
Gold has been running a good uptrend for a while, now looking it is going to break out again after this consolidation.
US Stocks:
SNDK and XMTR looking really nice as it consolidates, top and bottom of orange bar are the entry and stop loss respsectively.
Have a nice Christma

XAUUSD (D1) – Weekly OutlookXAUUSD (D1) – Weekly Outlook: Lana focuses on buying discounted zones, preparing for a possible ABC correction 💛
Quick summary
Higher timeframe (Daily): The main uptrend remains intact and structurally strong
Elliott Wave: Gold likely completed Wave 5, with a potential ABC corrective phase ahead

See all futures ideas
EUR/USD - H4 Weekly Outlook - Breakout Loading ?📝 Description 🔍 Market Structure
EUR/USD remains in a strong H4 uptrend, supported by a rising trend OANDA:EURUSD line and higher-high / higher-low structure. Price is currently compressing below a key resistance zone, suggesting a breakout or pullback scenario is loading.
🔴Trendline support r

EURUSD: Rejection From Key Resistance - Support 1.1660 in FocusHello everyone, here is my breakdown of the current EURUSD setup.
Market Analysis
EURUSD is trading within a broader corrective structure, and the current price action suggests increasing bearish pressure near key resistance. Earlier, the pair formed a triangle structure, where price respected bo

GBP/USD Ready for a Year–End Breakout?Daily Technical Analysis
GBP/USD is currently trading around the 1.337 area, holding above a rising channel structure after breaking through the 1.322 demand zone at the start of December. Recent daily candles show slowing bullish momentum under a higher–timeframe supply zone extending toward 1.345

GBPUSD Trendline Breakdown Deeper Pullback from Key ResistanceThis 2-hour GBP/USD chart highlights a strong bullish structure built on a rising trendline, with price respecting higher lows throughout early December. Multiple ascending and corrective channels show controlled upside momentum.
Price recently tested a major resistance zone near 1.3450, failed to h
Head and shodetBased on the three candles at the left shoulder, head and right shoulder, there is a strong selling preassure. With the RSI exhausted, there is a high probability of a temporary drop

Don’t Rush to Call the Top on EURUSDEURUSD in the late December 20–21 period is showing a clearly bullish picture , supported by both fundamental news and technical structure . This is not a euphoric phase , but rather a period where the market slows down to accumulate before making its next move.
From a fundamental perspective,

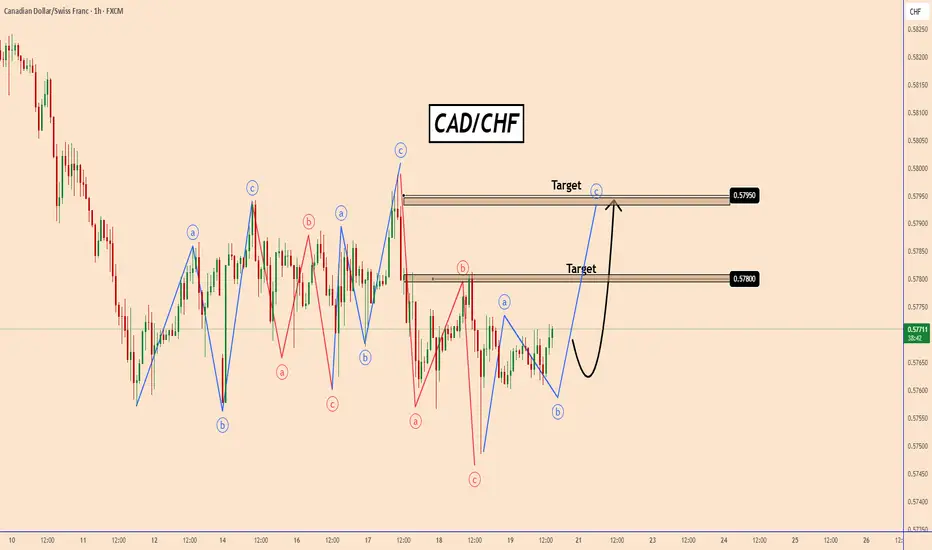
CADCHF – Corrective ABC Near Completion, Wave C in FocusCADCHF – Corrective ABC Near Completion, Wave C in Focus
CADCHF is moving within a large corrective pattern which is taking shape with corrective waves ABC.
At the moment it seems that corrective wave B is about to end and CADCHF may start impulsive wave C which could push CADCHF even above the
NZDJPY | Bullish Continuation LoadingHello and well done to all my TradingView followers 👋✨
I hope you’re having profitable and well-managed trades 📈
🔹 Symbol: NZDJPY (New Zealand Dollar / Japanese Yen)
This currency pair, combining a commodity-based currency (NZD) with a safe-haven currency (JPY), often delivers clean and reliable te

NZDUSD SELLNZDUSD - DISTRIBUTION
I see NZDUSD going lower as there's just to much supply currently, as well as the distribution that has occurred, which is in its final stages (phase D/E).... we should see an expansion playout soon enough

YEN CARRY TRADE LAST WAVE UP 5 of C of B CRASH SOON AFTERThe chart of the yen carry trade The reason for the coming CRASH in world markets for 2026 . Best of trades WAVETIMER !

See all forex ideas
| - | - | - | - | - | - | - | ||
| - | - | - | - | - | - | - | ||
| - | - | - | - | - | - | - | ||
| - | - | - | - | - | - | - | ||
| - | - | - | - | - | - | - | ||
| - | - | - | - | - | - | - | ||
| - | - | - | - | - | - | - | ||
| - | - | - | - | - | - | - |
Trade directly on Supercharts through our supported, fully-verified, and user-reviewed brokers.


