Gold at Its Golden SupportThe daily chart of GOLD shows that after a strong rally from around $3,200, the price has now pulled back toward the 50-day moving average (around $3,860) — a level that has repeatedly acted as a key support over the past several months, sparking multiple upward waves each time.
Short-Term Outlook

The best trades require research, then commitment.
Get started for free$0 forever, no credit card needed

Scott "Kidd" PoteetThe unlikely astronaut

Where the world does markets
Join 100 million traders and investors taking the future into their own hands.

Qqq.. No crying in the casinoPullback from summer channel top to channel bottom is underway and almost finished..
But go to your weekly and zoom out a decade
Logarithmic
Zoomed in
So yes, we are at the bottom of a 6month channel but we are still at the top of a 15year trendline and I don't think we last above here much

Tech Rally Sputters Ahead of Nvidia Earnings. What to KnowIs the powerful AI sector finally out of breath? With valuations that stretched, some investors fear if we all took it too far.
After months of seemingly unstoppable gains, the tech trade is finally showing signs of fatigue. Stocks are back in the red this week, with technology — the sector that’s
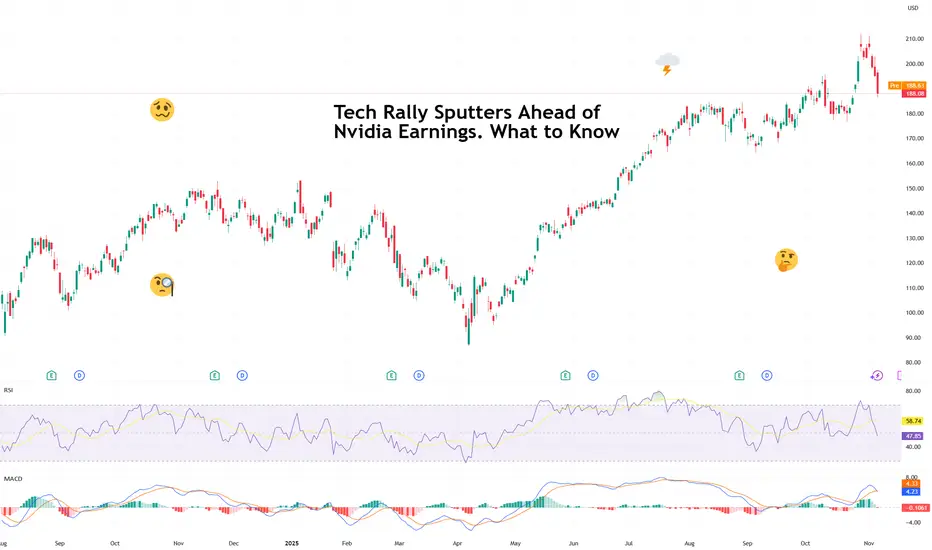
Nvidia: Acceleration Toward New Highs Nvidia gained strong upward momentum shortly after our last update, surging past the $196.45 mark, which had previously served as resistance. As a result, our prior short-term alternative scenario was triggered, and we have now adjusted the chart accordingly (with minor modifications). We now view t

BITCOIN – LEVELS TO WATCHTraders,
We dumped. Now we are in a controlled recovery. The question is not only “are we going up” but “where will the market make its real decision.” Right now the chart is giving us two very clean checkpoints.
1. What happened
We lost the weekly open and sold off.
Spot was selling too, so

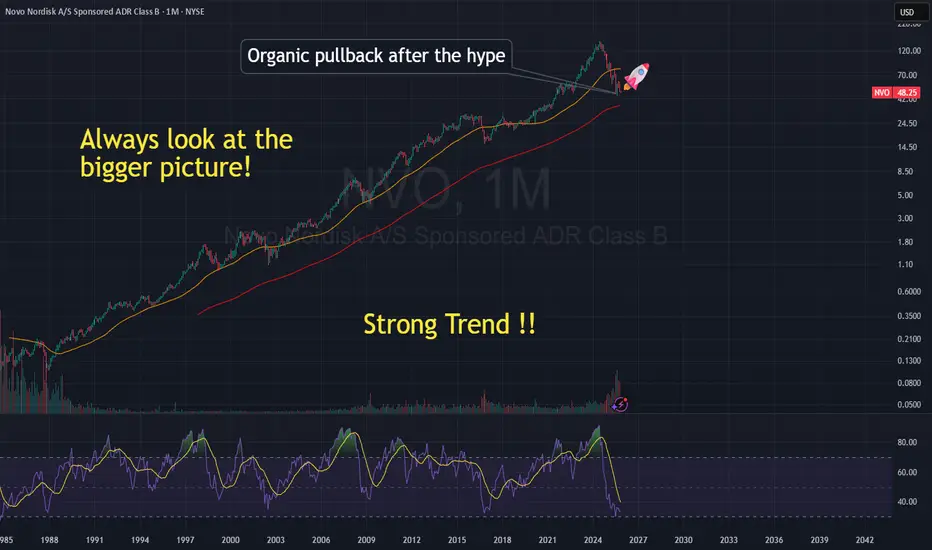
$NVO Last opportunity!🌱 Novo Nordisk: A Healthy Pullback in a Long-Term Growth Story
After years of remarkable growth, Novo Nordisk (NYSE: NVO) has seen its stock cool off — sliding from over 💲130 to around 💲49. At first glance, that might look alarming, but the reality is far more balanced. What we’re seeing is an or
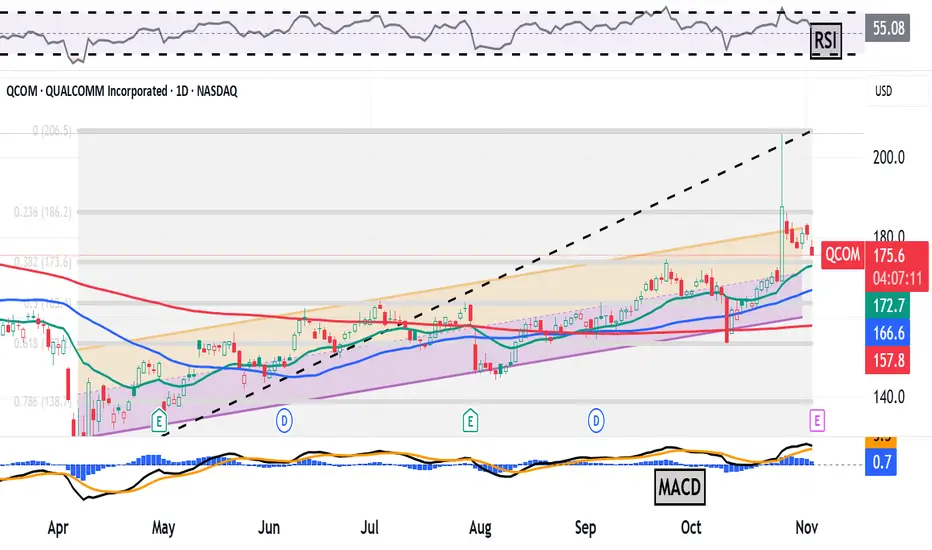
Qualcomm Rose 11% in One Day on AI Plans. What Its Chart SaysSemiconductor designer Qualcomm NASDAQ:QCOM , which is known for providing products to the consumer-electronics industry, rose more than 11% to a 15-month high in a single day last week when it announced a pivot into the world of artificial intelligence. Let's see what QCOM's chart and fundamental
Peak Tech Earnings Wrapped Up: Here Are the Winners and LosersWe're past that time when we all get glued to the dual-monitor setup and watch the titans of tech parade their financials.
Last week was the Super Bowl of earnings season, with Meta NASDAQ:META , Microsoft NASDAQ:MSFT , Alphabet NASDAQ:GOOGL , Apple NASDAQ:AAPL , and Amazon NASDAQ:AMZN all re

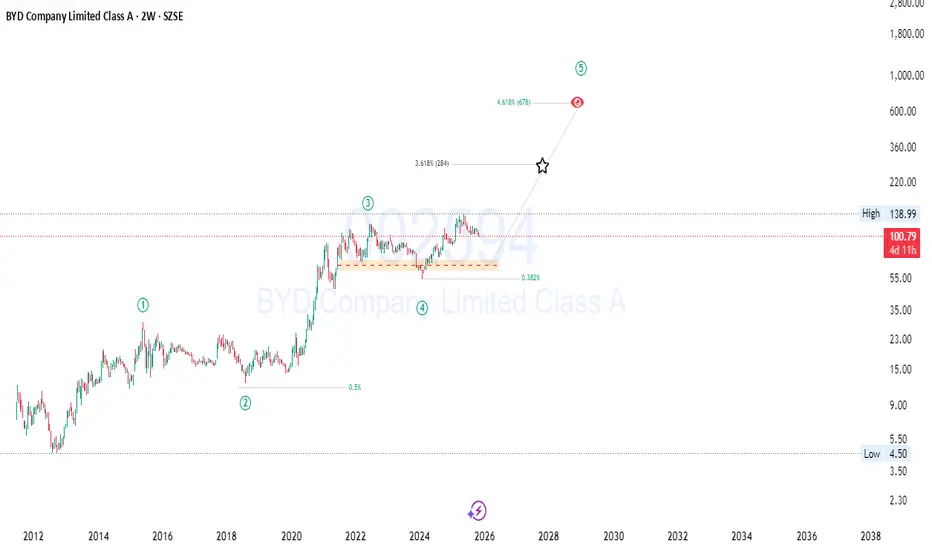
BYD : Smart Money Loading Before a Massive Wave 5 Breakout🚀 BYD Company Limited Class A (SZSE: 002594) — Wave 5 Expansion Setup
Big structure, clean levels, and solid fundamentals… Wave 5 might surprise a lot of people 👇
BYD has been quietly building strength, and the chart now suggests that the next major bullish wave could be setting up. After a
Busy trading week coming up!!The trading week of November 3–7 is considered a pivotal period for international financial markets. A series of high-level economic data including manufacturing and services PMIs, ADP non-farm payrolls, trade balances, and interest rate decisions from major central banks will create a mixed picture

See all editors' picks ideas
PriceFormatLibrary for automatically converting price values to formatted strings
matching the same format that TradingView uses to display open/high/low/close prices on the chart.
█ OVERVIEW
This library is intended for Pine Coders who are authors of scripts that display numbers onto a user's charts. T

LogNormalLibrary "LogNormal"
A collection of functions used to model skewed distributions as log-normal.
Prices are commonly modeled using log-normal distributions (ie. Black-Scholes) because they exhibit multiplicative changes with long tails; skewed exponential growth and high variance. This approach i

Range Oscillator (Zeiierman)█ Overview
Range Oscillator (Zeiierman) is a dynamic market oscillator designed to visualize how far the price is trading relative to its equilibrium range. Instead of relying on traditional overbought/oversold thresholds, it uses adaptive range detection and heatmap coloring to reveal where pri

Volume Surprise [LuxAlgo]The Volume Surprise tool displays the trading volume alongside the expected volume at that time, allowing users to spot unexpected trading activity on the chart easily.
The tool includes an extrapolation of the estimated volume for future periods, allowing forecasting future trading activity.
🔶 U

Smooth Theil-SenI wanted to build a Theil-Sen estimator that could run on more than one bar and produce smoother output than the standard implementation. Theil-Sen regression is a non-parametric method that calculates the median slope between all pairs of points in your dataset, which makes it extremely robust to o

Fair Value Gaps by DGTFair Value Gaps
A refined, multi-timeframe Fair Value Gap (FVG) detection tool that brings institutional imbalance zones to life directly on your chart.
Designed for precision, it visualizes how price delivers into inefficiencies across chart, higher, and lower (intrabar) timeframes — offering a fl

TASC 2025.11 The Points and Line Chart█ OVERVIEW
This script implements the Points and Line Chart described by Mohamed Ashraf Mahfouz and Mohamed Meregy in the November 2025 edition of the TASC Traders' Tips , "Efficient Display of Irregular Time Series”. This novel chart type interprets regular time series chart data to create an ir

Simplified Percentile ClusteringSimplified Percentile Clustering (SPC) is a clustering system for trend regime analysis.
Instead of relying on heavy iterative algorithms such as k-means, SPC takes a deterministic approach: it uses percentiles and running averages to form cluster centers directly from the data, producing smoo

Adaptive Volume Delta Map---
📊 Adaptive Volume Delta Map (AVDM)
What is Adaptive Volume Delta Map (AVDM)?
The Adaptive Volume Delta Map (AVDM) is a smart, multi-timeframe indicator that visualizes buy and sell volume imbalances directly on the chart.
It adapts automatically to the best available data resolution

Dynamic Equity Allocation Model"Cash is Trash"? Not Always. Here's Why Science Beats Guesswork.
Every retail trader knows the frustration: you draw support and resistance lines, you spot patterns, you follow market gurus on social media—and still, when the next bear market hits, your portfolio bleeds red. Meanwhile, institution

See all indicators and strategies
Community trends
Concerns on market specifically NVDA - Not financial adviceSome thoughts and concerns watching the market as an amateur investor looking at historical shifts and trends. This is not a prediction and not to be considered financial advice in any manner shape or form. It is simply a personal opinion based on my impression of the market. Please discuss any choi

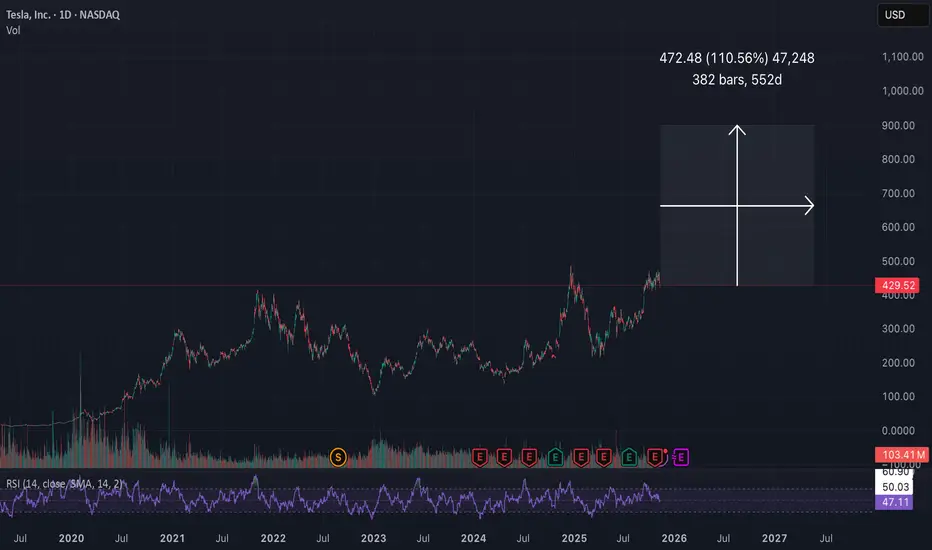
1 trillion dollar pay package to elon muskTesla shareholders agreed to pay Elon Musk a package of 1 trillion dollars, and that's 12% of total gains if he reached his promised goal to shareholders of making Tesla the most valuable company in the world, and it stays that way for 5 years. If Musk delivers, the stock price should jump to 1000 d
DIS: Monthly and Earnings!My thoughts on DIS for the month and its earnings release next week.
Just thoughts, not advice of course.
Thanks for watching!

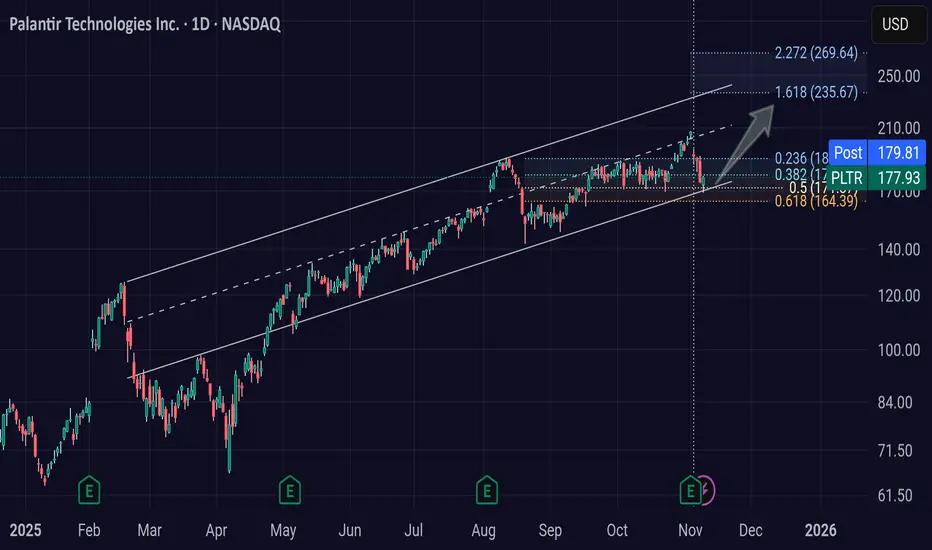
PLTR: staying on track for the time beingBullish channel in tact. Successful rebound on the .5 fib.
I can see a 40%+ move from here in the short-term, and following the trend.
Will it hold? Idk.
I'm a long term holder (10-20 yrs), and don't make any trade advice.
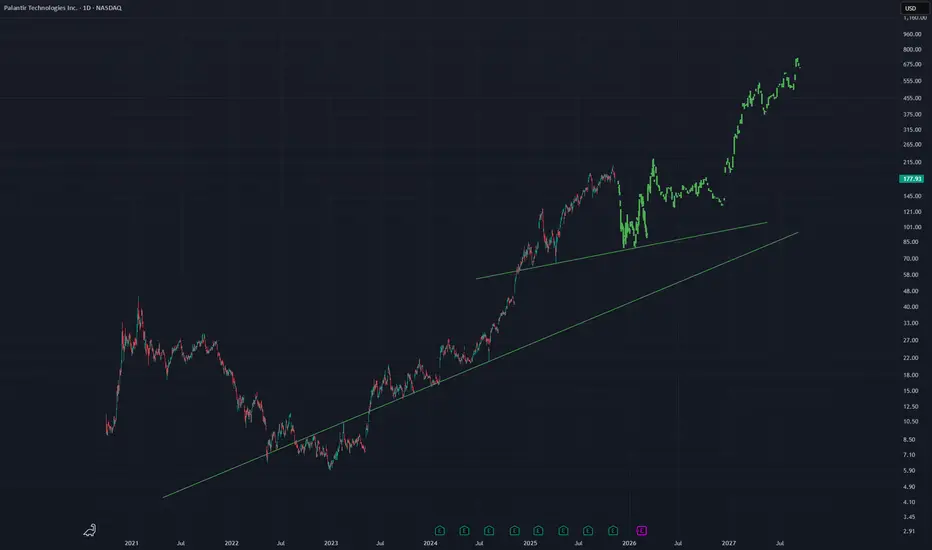
PLTR - Bars Pattern PredictionsUsing the bars pattern tool on this daily chart for PLTR to see if there will be a retest of a lower trend line before continuation upward
The lowest trend line probably will not be hit but i leave it there
See if future price action looks anything at ALL like this
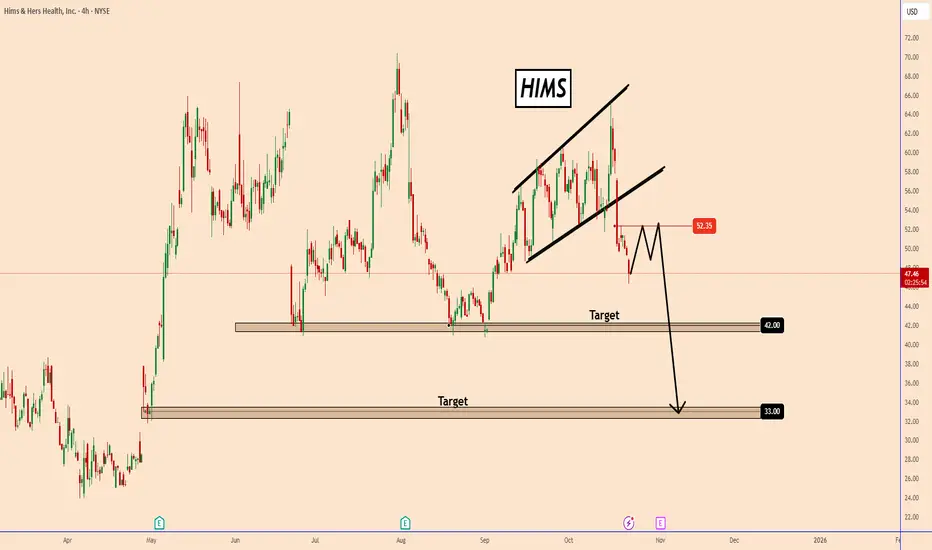
HIMS: Showing Signs of Exhaustion: Downside Targets at 42 and 33HIMS: Showing Signs of Exhaustion: Downside Targets at 42 and 33
HIMS appears to be forming a rising wedge pattern, a typically bearish formation that often signals exhaustion of upward momentum.
After several failed attempts to break higher, the price has now started to pull back, suggesting tha
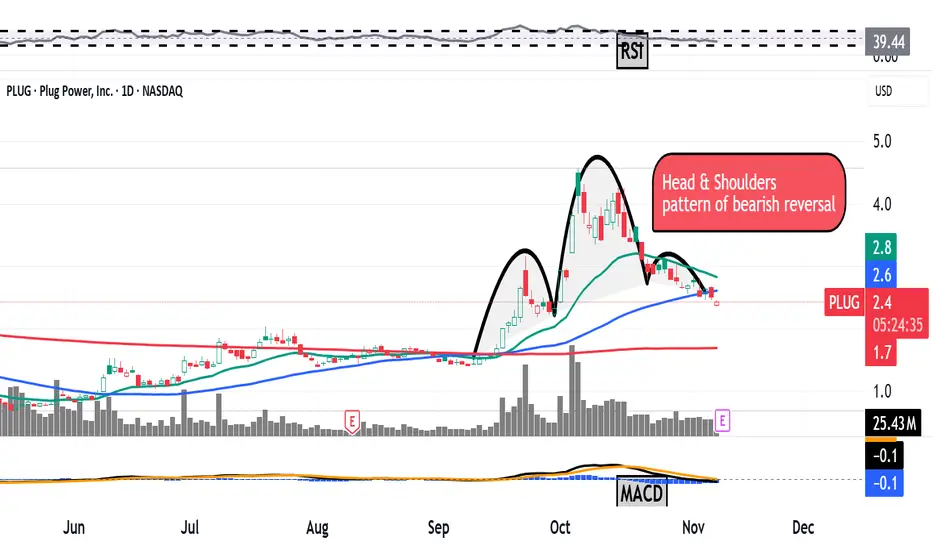
Plug Power Rose 560%, Then Pulled Back. What Its Chart Says NowPlug Power NASDAQ:PLUG soared more than 560% between May and October, then the hydrogen-fuel-cell firm gave back some 45% of those gains over the past month. What does PLUG's chart and fundamental analysis say ahead of next week's Q3 earnings report?
Let's see:
Plug Power's Fundamental Analysis
$TSLA - Reaching $1050 in 2026 is NOT a Dream!I can't ignore how bullish Tesla stocks chart looks right now. A massive ascending triangle with horizontal resistance ($430) was broken upwards and currently the price is consolidating above it, the resistance also perfectly correlates with the 0.786 lvl by Fibo.
Taking into account the over

$MSTR Bullish Shark Harmonic completedNASDAQ:MSTR : C wave of this ABC correction has gone beyond A, meeting the requirements of an ABC flat correction. Bullish Shark Harmonic also looks complete.

Puma Biotechnology Inc, the rise of an underdog? - November 2025For years Puma Biotechnology (NASDAQ:PBYI) has lived quietly in the shadows, the biotech equivalent of a washed up boxer still training in a basement gym waiting for one last fight. But recently, something changed. The chart tells the story better than any press release ever could.
After almost eig

See all stocks ideas
Today
RDNTRadNet, Inc.
Actual
—
Estimate
0.22
USD
Tomorrow
CMCLCaledonia Mining Corporation Plc
Actual
—
Estimate
0.78
USD
Tomorrow
KMDAKamada Ltd.
Actual
—
Estimate
0.09
USD
Tomorrow
ACDCProFrac Holding Corp.
Actual
—
Estimate
−0.43
USD
Tomorrow
SPRYARS Pharmaceuticals, Inc.
Actual
—
Estimate
−0.45
USD
Tomorrow
TSQTownsquare Media, Inc.
Actual
—
Estimate
0.07
USD
Tomorrow
BXSLBlackstone Secured Lending Fund
Actual
—
Estimate
0.78
USD
Tomorrow
THSTreehouse Foods, Inc.
Actual
—
Estimate
0.56
USD
See more events
Community trends
BTCUSD Tests Buyer Zone — Eyes Break Below $100KHello traders, here’s my current outlook on Bitcoin (BTCUSD). The market continues to trade within a broader bearish structure after breaking down from the previous rising channel. The price failed to hold above the $110,000–$111,000 Seller Zone, where multiple fake breakouts occurred, indicating st

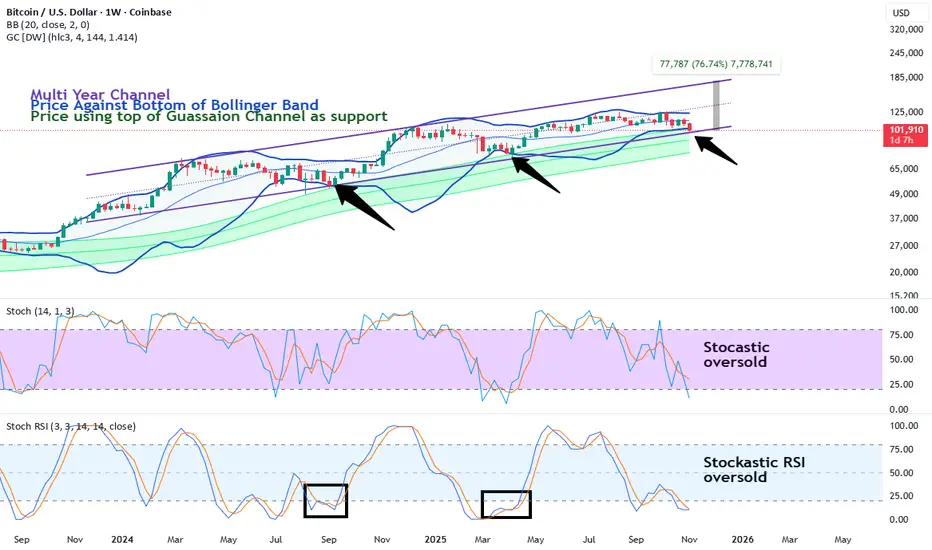
People Panic (again) as bitcoin returns to support (again)Bitcoin has been channeling up for about a year pretty consistently. The basic technical supports are still working. Price hits the weekly Bollinger band bottom, wicks through, builds structure and reverses to a new high. Price has also been bouncing off the top of the weekly gaussian channel. Th
Bitcoin Faces Rejection — Targeting 101,300 SupportBitcoin (BTC/USD) is showing a potential bearish setup around the 103,000 level, with resistance near 104,500. A pullback is expected, targeting the 101,300 support area for a possible short-term decline.
Title: Bitcoin Bearish Rejection Toward 101,300 Target

BTCUSDTHello Traders! 👋
What are your thoughts on BITCOIN?
Bitcoin has entered a corrective phase after reaching the top of its ascending channel and setting a new high.
The correction is still ongoing, and the price is now approaching a major support zone that aligns with the ascending trendline.
This c

BNB: Inverse Head & Shoulders & Rising Channel StructureHi!
BNB has completed a clear inverse Head & Shoulders pattern at the bottom, with the neckline successfully reclaimed. After the breakout, the price is now moving inside a well-defined rising channel, showing steady bullish momentum.
The market has pulled back toward the midline of the channel, w

Lingrid | SHIBUSDT Market Consolidation ContinuesThe price perfectly fulfilled my previous idea . BINANCE:SHIBUSDT rejected from the upper boundary of its descending structure, continuing to trade within a well-defined bearish channel. The price structure shows repeated lower lows and consolidations inside a mid-range zone under the downward tr

SOL/USDT – Holding Steady Near the $160 ThresholdHello everyone, Solana (SOL/USDT) is currently stabilising around $156 after a strong correction earlier this week. This area serves as a key support level, as buying pressure has become more visible over recent sessions.
On the 4-hour chart, the main trend still leans slightly bearish, but the re

Bitcoin: 100K NOW Attractive For Investing.Bitcoin looks bearish to most, I can understand why BUT as bearish as this looks, the current price area still presents a potential area for a bullish reversal. The 98K low dates back to the June low which is now acting as the support. IF this level breaks, 95K is the next inflection point to watch

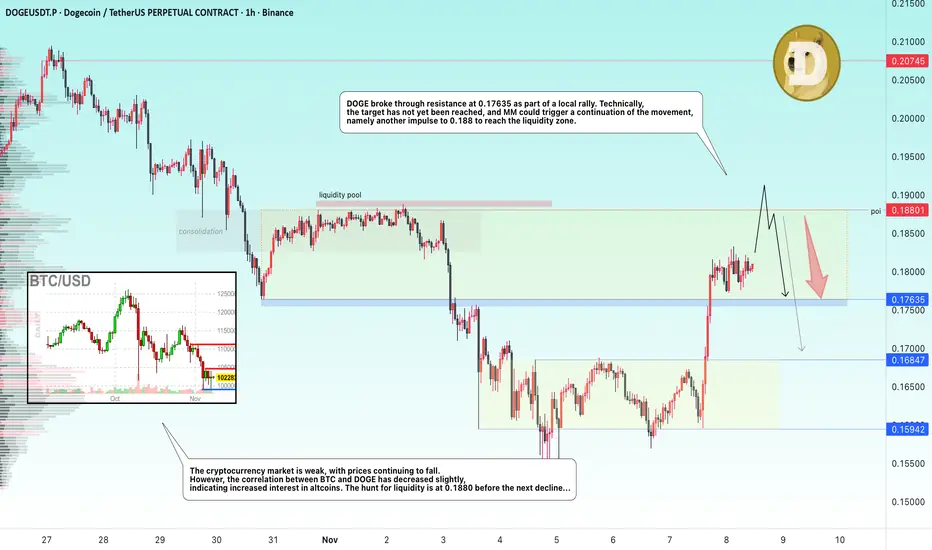
DOGE → The hunt for liquidity before the fallBINANCE:DOGEUSDT rose sharply on Friday. The reason is local news related to ETFs and Musk's tweet (it still works :) ). The growth potential may quickly exhaust itself...
The altcoin is strengthening, breaking resistance and consolidating between two important levels - 0.1763 and 0.188. The t
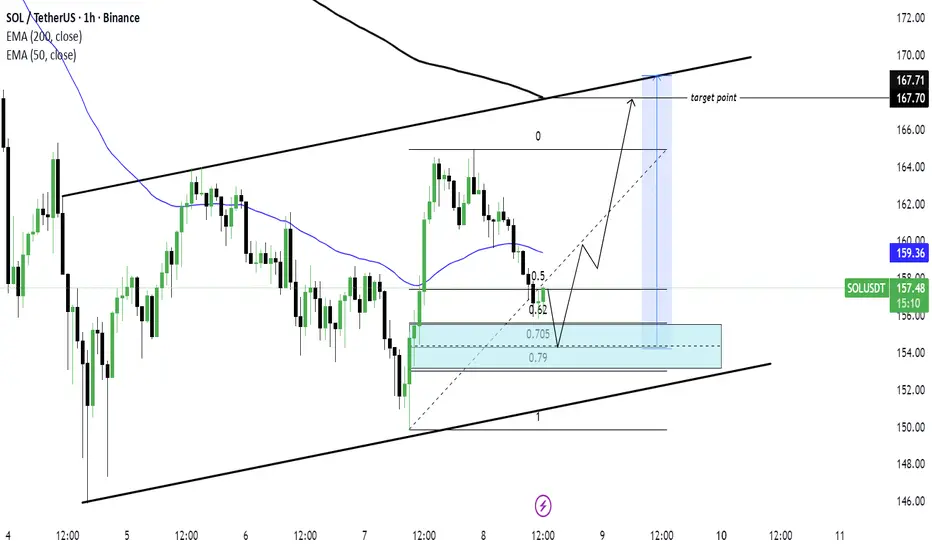
SOL/USDT) Bullish trend analysis Read The captionSMC Trading point update
Technical analysis of SOL/USDT (1-hour timeframe) — a potential continuation move within an ascending channel.
Here’s the complete breakdown
---
1. Market Structure
Price is moving inside a rising channel, confirming a bullish structure with higher highs and higher
See all crypto ideas
XAUUSD: Gold $3500 NextGold currently trading at a very key level from where we think price can reverse, there are three targets if the trade setup get activated. Remember to risk appropriately based on your own risk management. If you like our idea then do consider liking and commeting it means a lot to us.
For further

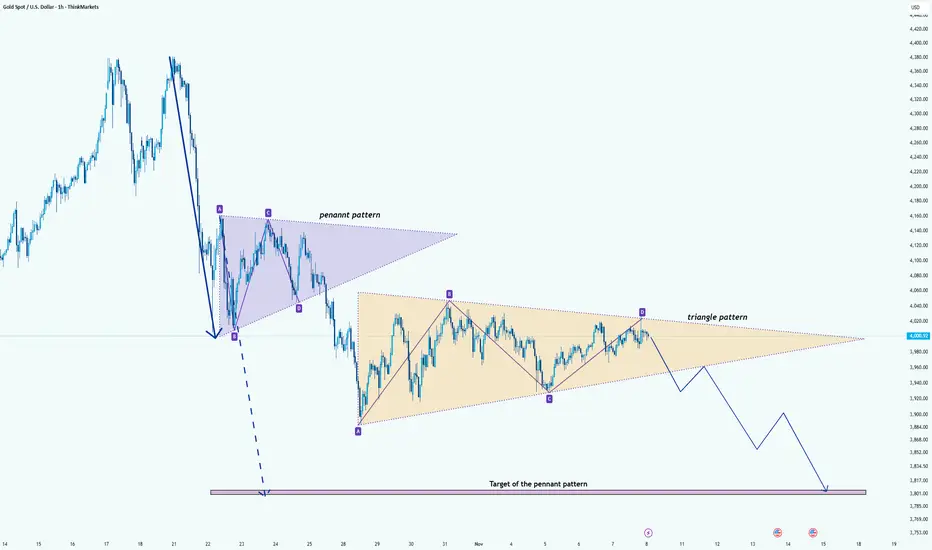
Gold (XAUUSD): Triangle Compression After Pennant BreakHi!
After the strong, impulsive drop, Gold formed a bearish pennant, which has already broken to the downside. The measured move target of that pennant remains unfilled, and the price continues to consolidate below the breakdown point.
Currently, the market structure is developing inside a symmetr
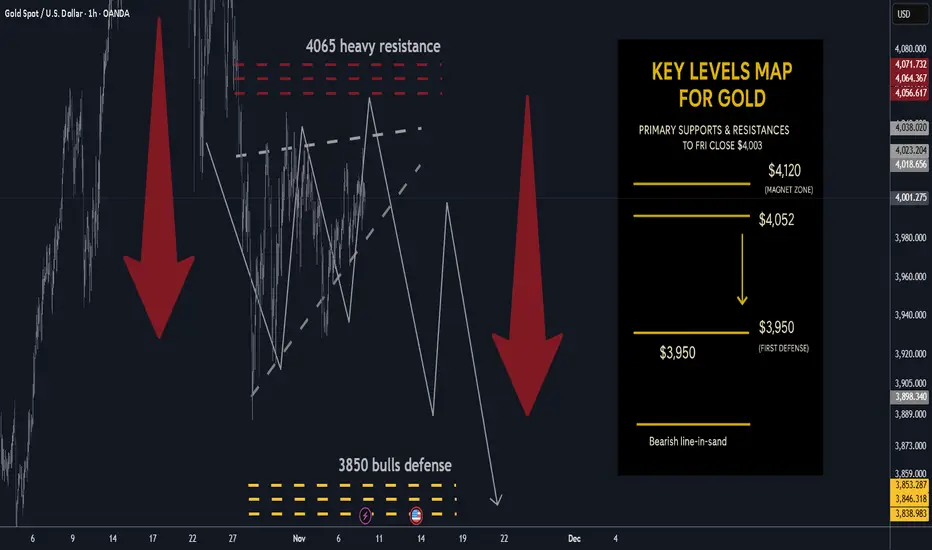
Gold next week: Key S/R Levels and Outlook for Traders🔥 GOLD WEEKLY SNAPSHOT — BY PROJECTSYNDICATE
🏆 High/Close: $4,024.9 → ~$4,003 — sellers faded upticks; weekly close soft but back above the round $4k.
📈 Trend: Neutral / mild correction inside range; not expecting immediate new highs while <$4,080–4,120.
🛡 Supports: $3,950 → $3,900 → $3,850 — piv
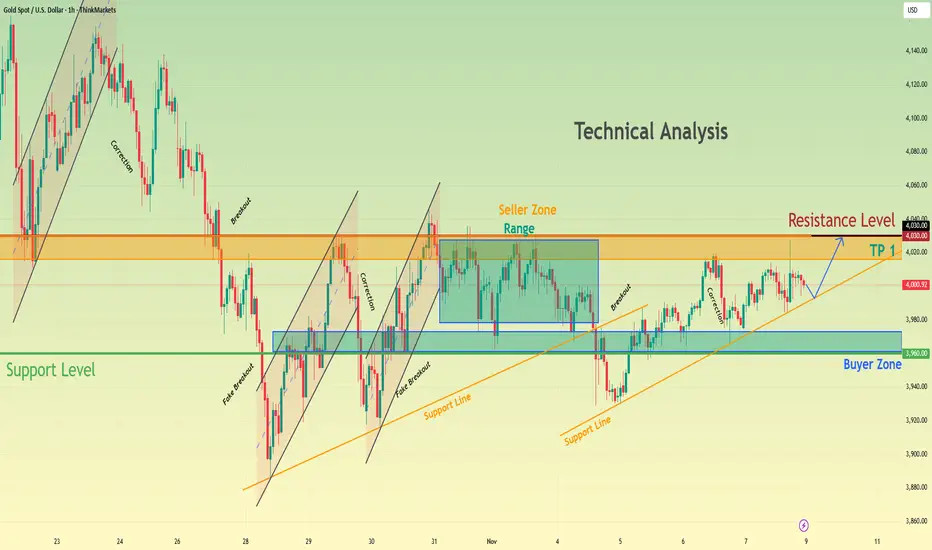
XAUUSD Holds Buyer Zone — Potential Recovery Toward $4,030Hello traders, I’d like to share my view on Gold (XAUUSD). The market has been holding a constructive bullish structure, developing higher lows along the rising Support Line. Each time price approached this trendline, buyers reacted strongly, confirming persistent demand. Meanwhile, the $3,960–$3,98
XAUUSD Daily timeframe projectionWhat to expect from Gold till end of the year.....
Exhausted buyers and unloaded positions are responsible for this correction. No pessimism but don't expect a ATH soon... price will retest 4300 area then sweep the low and market will accumulate all along... stay safe!!

GOLD DAILY CHART ROUTE MAPHey everyone,
Please review our Daily Chart Route Map, now featuring updated levels for tracking Golds movement.
We continue to track our refreshed proprietary Goldturn Channel, our unique method for constructing ascending channels. Price action is now testing the swing range and the swing range s

XAUUSD Long: Bullish Rebound Targeting $4,050 LevelHello traders! Gold (XAUUSD) is trading within a constructive bullish structure after rebounding from the $3,930–$3,960 Demand Zone, which aligns with the lower boundary of the Ascending Channel. This zone has acted as a strong accumulation area where buyers stepped in multiple times, confirming act

Gold 4H – Key Liquidity Zones Ahead of US PMI & Fed Commentary🥇 XAUUSD – Weekly Smart Money Outlook | by Ryan_TitanTrader
📈 Market Context
Gold continues to consolidate within a tight 4H range as traders prepare for a week influenced by U.S. PMI releases, Fed speeches, and shifting rate-cut expectations.
Mixed economic signals — including softer labor data bu

Gold Trading Strategy Analysis for Next Week.Gold trading was suspended again on Friday due to the non-farm payrolls report. Friday saw range-bound trading, with the high reaching 4027 and the low 3975, consistent with my predicted range. Based on the closing price, gold has once again risen above 4000, with bulls still eyeing the 4047-4055 le

XAUUSD: Buyers Target $4,080 Resistance ZoneHello everyone, here is my breakdown of the current Gold setup.
Market Analysis
Gold (XAUUSD) has recently formed a constructive bullish structure after rebounding from the 3,930–3,960 Buyer Zone, which aligns with the lower boundary of the Upward Channel. This demand zone has consistently acted

See all futures ideas
EURUSD: Bulls Aim for Recovery Toward 1.1580 ResistanceHello everyone, here is my breakdown of the current Euro setup.
Market Analysis
EURUSD has recently shown signs of recovery after bouncing from the key 1.1480–1.1500 Support Zone, which aligns with the lower boundary of the Support Structure highlighted on the chart. This area has acted as a stro

EUR/USD – H4 Wedge Pattern | Dollar Weakness & Fed Cut Bets🧠 Setup Overview:
EUR/USD is forming a falling wedge pattern on the H4 chart — a potential bullish reversal structure after weeks of downside pressure. The pair is testing the upper wedge trendline, suggesting a possible breakout, but confirmation is still pending. FX:EURUSD
📊 Trading Plan: ✅

USDJPY Eyes 153.000 Support as Hawkish Fed Keeps Dollar Bid!Hey Traders,
In the coming week, we’re monitoring USDJPY for a buying opportunity around the 153.000 zone. The pair remains in a clear uptrend and is currently in a correction phase, approaching a key support and resistance area at 153.000.
Fundamentally, the Fed’s recent hawkish tone emphasizing

NZD/USD: A Trap for Early Buyers? Retail 90% Long1️⃣ Technical Context
NZD/USD is trading around 0.5630, within a descending channel that started in mid-July. After testing the lower boundary of the channel and the demand zone between 0.5570–0.5620, price reacted with a mild technical bounce — yet without any structural reversal confirmation.
The

EUR/USD – Are Buyers Starting to Return?Hello everyone, in recent sessions, EUR/USD has continued its downward trend, retreating from 1.1750 to around 1.1500 — an area that has repeatedly acted as a strong support zone. Upon revisiting this level, the market began showing mild signs of recovery, suggesting that buying pressure may be qui

USD/JPY - Wedge Breakdown |Watch 150.00 & 148.00✅ USD/JPY Analysis – H4 Chart - Rising Wedge Breakdown Potential
Price is currently respecting a Rising Wedge structure, showing signs of exhaustion near the Key Zone (≈154.20–154.70). We’ve seen a break + minor retest, indicating possible bearish continuation if sellers maintain pressure.
A drop

USD/CAD - Sell off ready🧭 Bias: Bearish correction incoming
After a strong bullish leg into higher-timeframe supply, USD/CAD looks primed for a deeper pullback before any continuation move.
🕰 Weekly Outlook
Context : Price just tapped into a weekly supply zone sitting inside the 1.41–1.42 range — exactly where previ

AUD/USD Slips: Heading Towards 0.64400?AUD/USD is currently in a downtrend after failing to break through the resistance at 0.65000. Latest data from the RBA and the weakening of the USD have created resistance for the AUD. With the Federal Reserve not planning to cut interest rates immediately, the stronger USD is putting pressure on th

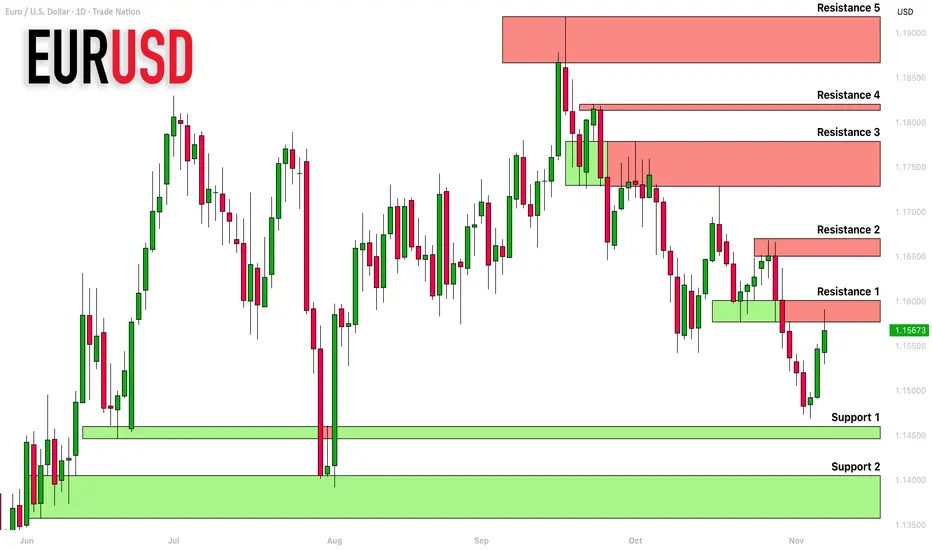
EURUSD: Support & Resistance Analysis For Next Week 🇪🇺🇺🇸
Here is my latest structure analysis and important
supports and resistances for EURUSD for next week.
Consider these structures for pullback/breakout trading.
❤️Please, support my work with like, thank you!❤️
I am part of Trade Nation's Influencer program and receive a monthly fee for using
EURUSD BUY NOWEURUSD, here we can clearly see the reversal. USD is weak, so we can buy for a short-term frame

See all forex ideas
| - | - | - | - | - | - | - | ||
| - | - | - | - | - | - | - | ||
| - | - | - | - | - | - | - | ||
| - | - | - | - | - | - | - | ||
| - | - | - | - | - | - | - | ||
| - | - | - | - | - | - | - | ||
| - | - | - | - | - | - | - | ||
| - | - | - | - | - | - | - |
Trade directly on the supercharts through our supported, fully-verified and user-reviewed brokers.


