Job Growth Takes Off but Traders Stay Put. What’s Happening?Are these jobs in the room with us right now?
📊 A Blockbuster Headline
The delayed January jobs report arrived Wednesday. Nonfarm payrolls ECONOMICS:USNFP showed 130,000 new hires , more than double the 55,000 estimate. On paper, that looked like a strong start to the year.
Wall Street’s re

The best trades require research, then commitment.
Get started for free$0 forever, no credit card needed

Scott "Kidd" PoteetPolaris Dawn astronaut

Where the world does markets
Join 100 million traders and investors taking the future into their own hands.

$TAO Sitting on a Level That Has Never FailedGETTEX:TAO is sitting on a major long-term support level and this isn’t the first time.
If we look at the last three times we touched this support, we bounced strongly.
We may see some drop to form a wick below the support, just as we’ve seen in the last three instances. However, in each case, we

BTC: The "Invisible Wall" at $70k (Why We Flush to $59.8k)The retail narrative is that Bitcoin is "consolidating" at $70k. The On-Chain data says Bitcoin is DISTRIBUTING . We just hit an "Invisible Sell Wall" driven by three massive structural failures. This is not a dip to buy; it is a Rational Deleveraging triggered by a $6.3B supply shock that the ma

Silver Under Pressure – Sellers Are in ControlXAGUSD is currently clearly leaning toward a short-term BEARISH trend, as both recent news and the technical structure fail to support a sustainable bullish move.
From a news perspective , silver is facing pressure from profit-taking after the previous strong rebound , while the U.S. dollar and

S&P 500: Late-Cycle Signals Are BuildingThe S&P 500 is still holding near highs, but under the surface, things are starting to weaken. Both the chart and the economy are sending warning signs that are easy to miss if you only look at price.
Weekly Bearish Divergence
On the weekly chart, price made higher highs, but momentum did not .

EURUSD Buyers in Control After Corrective Move, Eyes on 1.1930Hello traders! Here’s my technical outlook on EURUSD (1H) based on the current chart structure. EURUSD previously traded within a strong bullish environment, supported by a well-defined rising trend line. During this phase, price consistently formed higher highs and higher lows, confirming sustained

Paypal Bottom is in ?! Long from herePayPal Holdings (PYPL) is currently trading at approximately $40.42 (as of the latest close, +1.30% on the session), marking a continuation of the multi-year downtrend from its 2021 peak of ~$310–$340.
The chart applies a Fibonacci retracement drawn from the 2021 high (~$310.16) to the post-peak lo

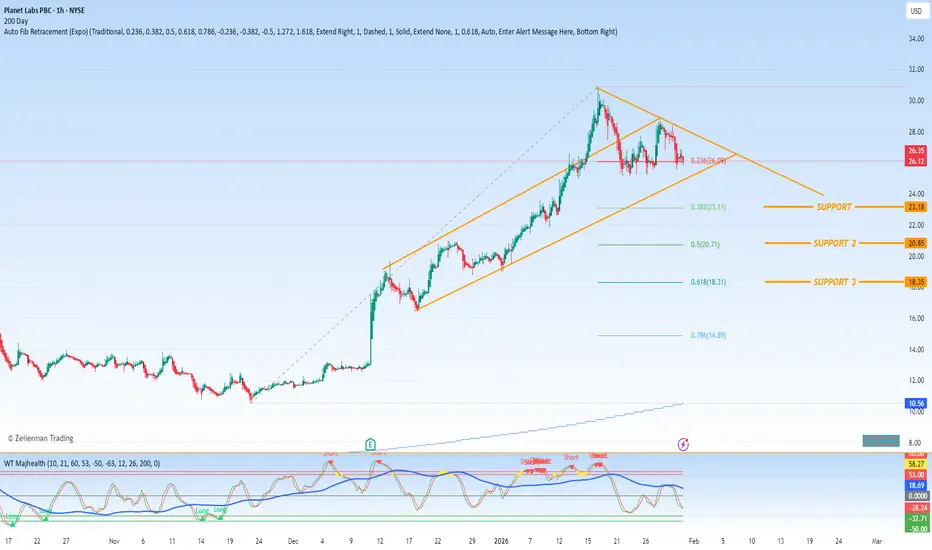
$PL - RACE TO SPACE!This reported merger proposal between SpaceX and xAI, along with the broader industry moves toward orbital AI data centers, represents a bold and high-stakes strategic gambit in the escalating global AI infrastructure race. Here’s a structured analysis of the implications, motivations, and challenge
Bitcoin Back Above $70,000. Here Are Key Levels to Watch NowA trip to $60,000 and back before coffee.
Bitcoin BITSTAMP:BTCUSD spent the end of last week doing what it does best: reminding traders that fire-breathing dragons aren’t in fairytales only.
After a sharp drop to $60,033 on Thursday torched thousands of long positions, the world’s largest crypt

An At Market & Future Trading Opportunity on GOLDWhat’s Really Going On With Gold?
Gold took a sharp hit to close out last week—but let’s keep things in perspective. This market has been on a massive bullish run, and after a move like that, consolidation isn’t a surprise… it’s normal.
Barring any unexpected geopolitical headlines, the most logic

See all editors' picks ideas
Peak Trading Activity Graphs [LuxAlgo]The Peak Trading Activity Graphs displays four graphs that allow traders to see at a glance the times of the highest and lowest volume and volatility for any month, day of the month, day of the week, or hour of the day. By default, it plots the median values of the selected data for each period. T
Pine Script® indicator

Smart Trader, Episode 03, by Ata Sabanci, Candles and TradelinesA volume-based multi-block analysis system designed for educational purposes. This indicator helps traders understand their current market situation through aggregated block analysis, volumetric calculations, trend detection, and an AI-style narrative engine.
━━━━━━━━━━━━━━━━━━━━━━━━━━━━━━━━━━━━━━━
Pine Script® indicator

Asset Drift ModelThis Asset Drift Model is a statistical tool designed to detect whether an asset exhibits a systematic directional tendency in its historical returns. Unlike traditional momentum indicators that react to price movements, this indicator performs a formal hypothesis test to determine if the observed d
Pine Script® indicator

Hyperfork Matrix🔱 Hyperfork Matrix 🔱 A manual Andrews Pitchfork tool with action/reaction propagation lines and lattice matrix functionality. This indicator extends Dr. Alan Andrews' and Patrick Mikula's median line methodology by automating the projection of reaction and action lines at equidistant intervals, cr
Pine Script® indicator

Arbitrage Matrix [LuxAlgo]The Arbitrage Matrix is a follow-up to our Arbitrage Detector that compares the spreads in price and volume between all the major crypto exchanges and forex brokers for any given asset.
It provides traders with a comprehensive view of the entire marketplace, revealing hidden relationships among d
Pine Script® indicator

Wyckoff Schematic by Kingshuk GhoshThe "Wyckoff Schematic" is a Pine Script indicator that automatically detects and visualizes Wyckoff Method accumulation and distribution patterns in real-time. This professional tool helps traders identify smart money movements, phase transitions, and critical market structure points.
Key Features
Pine Script® indicator

Volume Cluster Profile [VCP] (Zeiierman)█ Overview
Volume Cluster Profile (Zeiierman) is a volume profile tool that builds cluster-enhanced volume-by-price maps for both the current market window and prior swing segments.
Instead of treating the profile as a raw histogram only, VCP detects the dominant volume peaks (clusters) insid
Pine Script® indicator

DeeptestDeeptest: Quantitative Backtesting Library for Pine Script
━━━━━━━━━━━━━━━━━━━━━━━━━━━━━━━━━━
█ OVERVIEW
Deeptest is a Pine Script library that provides quantitative analysis tools for strategy backtesting. It calculates over 100 statistical metrics including risk-adjusted return ratios (Sharpe
Pine Script® library

Arbitrage Detector [LuxAlgo]The Arbitrage Detector unveils hidden spreads in the crypto and forex markets. It compares the same asset on the main crypto exchanges and forex brokers and displays both prices and volumes on a dashboard, as well as the maximum spread detected on a histogram divided by four user-selected percenti
Pine Script® indicator

Multi-Distribution Volume Profile (Zeiierman)█ Overview
Multi-Distribution Volume Profile (Zeiierman) is a flexible, structure-first volume profile tool that lets you reshape how volume is distributed across price, from classic uniform profiles to advanced statistical curves like Gaussian, Lognormal, Student-t, and more.
Instead of forcin
Pine Script® indicator

See all indicators and strategies
Community trends
Amazon - This stock is still 100% bullish!🎉Amazon ( NASDAQ:AMZN ) just remains totally bullish:
🔎Analysis summary:
This month alone, Amazon is down about -15%. But looking at the higher timeframe, the underlying uptrend still remains incredibly strong. And even if Amazon drops another -15%, it will retest a significant support and su

Throw out (almost) everything you know about how I trade.Chances are, virtually the only people who will see this idea are followers of mine. And that is just fine with me. You deserve this more than anyone else. But I have to warn those of you who have been following me for a long time - this is NOT my normal trading style. So make sure you are sitti

AGX: Power for AI – Cup & Handle BreakoutThe Setup:
While everyone focuses on the chips (Nvidia) and the data centers (Vertiv), Argan ( NYSE:AGX ) builds the actual power plants that keep the lights on. They are a premier contractor for natural gas and renewable energy plants—critical infrastructure as AI drives electricity demand to recor

NvdaLooks like dead money up here near 195 until earnings... looking for a pullback to 170-175 in the next 2 weeks of before ER
No volume last 2 sessions up here near 194.
4hr RSI showing negative divergence here

HOOD Approaching Capitulation — Opportunity FormingHOOD QuantSignals V4 Weekly 2026-02-11
CORE THESIS: Capitalizing on an extreme oversold technical condition (RSI < 30) paired with blowout Q4 fundamental news and record prediction market volume to drive a mean-reversion move toward $84.
⬢ KATY AI: MULTI-DAY VECTOR
Bias: Bullish | Probability: 65

MP - Still watching for another high into the boxNothing much to add to my analysis. Price will either continue to grind higher to the target box, or B is complete and it is soon to head lower to the low $40's. Currently, I have a three wave move off of the $47.18 bottom. Technically, that could be all she wrote and we could be headed lower from h

MICROSOFT (MSFT) Market update, Weekly Insight.Fundamental Analysis:
As of today, Microsoft shares are valued are at 404.37, the company market cap stands at 3.09T, with a P/E ratio of 25.30 and dividend yield of 84.1%. an announcement was made on Wednesday that top security leader Charlie Bell will take on a new role, and that Hayete Gallot wi


AKAM LongCybersecurity company with bullish market structure
Stock pushing above all moving averages and this gap fill seems like a good opportunity
TP1 100
TP2 104

Microsoft - 4th biggest company, trading at a bargain!Microsoft - Currently the company is trading at the STAGGERING 26.87 P/E ratio!
We are talking about the 4th biggest company in the world trading at bargain prices, which have been achieved due to their hard commitment at the AI sector - our breaking points below:
Strengths Supporting Long-Term Va

See all stocks ideas
Feb 12
GRABGrab Holdings Limited
Actual
0.04
USD
Estimate
0.01
USD
Feb 12
TRIPTripAdvisor, Inc.
Actual
0.04
USD
Estimate
0.15
USD
Feb 12
NVCTNuvectis Pharma, Inc.
Actual
−0.31
USD
Estimate
−0.32
USD
Feb 12
CHKPCheck Point Software Technologies Ltd.
Actual
3.40
USD
Estimate
2.76
USD
Feb 12
PCGPacific Gas & Electric Co.
Actual
0.36
USD
Estimate
0.36
USD
Feb 12
LNCLincoln National Corporation
Actual
2.21
USD
Estimate
1.90
USD
Feb 12
WSTWest Pharmaceutical Services, Inc.
Actual
2.04
USD
Estimate
1.83
USD
Feb 12
GELGenesis Energy, L.P.
Actual
0.04
USD
Estimate
0.28
USD
See more events
Community trends
ETH/USD Decision Points for Next MoveEthereum is currently exhibiting a textbook bullish reversal structure as it stabilizes within a high-confluence demand zone between $1,800 and $1,900. After a period of bearish dominance, the price action is shifting from a sequence of lower lows to a potential Market Structure Shift (MSS), evidenc

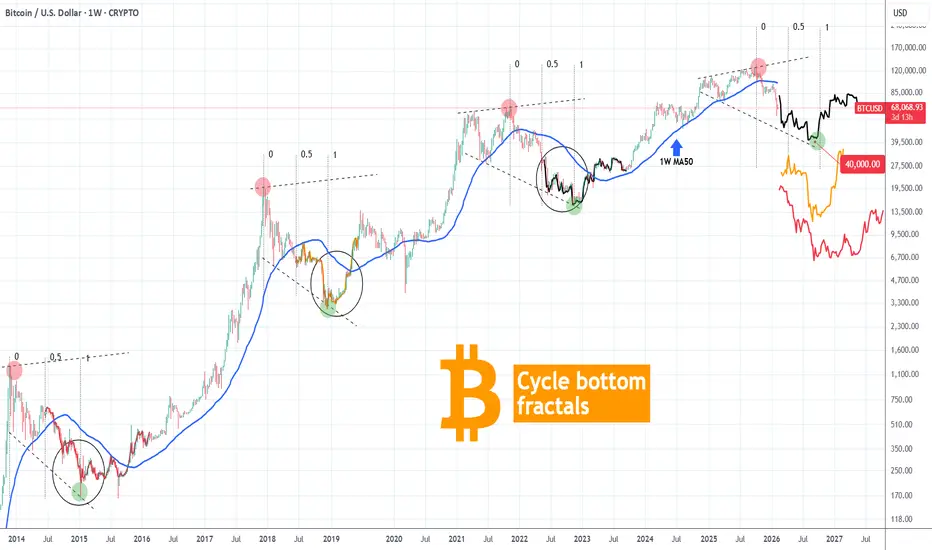
BITCOIN Cycle bottom fractals map the rest of 2026 towards $40k.Bitcoin (BTCUSD) continues to be under heavy pressure despite having the 1W MA200 holding the crash last week. Having long lost its 1W MA50 (blue trend-line), which confirmed the Bear Cycle, we are now approaching its 2nd Phase, which is the bottoming process.
This doesn't mean that the bottom is h
BTC: The "Invisible Wall" at $70k (Why We Flush to $59.8k)The retail narrative is that Bitcoin is "consolidating" at $70k. The On-Chain data says Bitcoin is DISTRIBUTING . We just hit an "Invisible Sell Wall" driven by three massive structural failures. This is not a dip to buy; it is a Rational Deleveraging triggered by a $6.3B supply shock that the ma
BTCUSDT: Bullish Scenario While Above 66.3K SupportHello everyone, here is my breakdown of the current BTCUSDT setup.
Market Analysis
BTCUSDT was previously trading inside a well-defined descending channel, where price consistently respected the falling resistance and support boundaries. This structure was characterized by a sequence of lower hig

Bitcoin - More blood coming! Buy 57k (extremely strong support)Bitcoin is currently in a very sharp decline, because the price dropped in the past 4 months by 53%. A lot of people didn't expect such high volatility because they are even new to the market, or they thought that ETF would reduce the overall volatility of this market. The truth is that the market i

BTCUSDT Short: Bearish Structure Holds - Focus on 65,000 DemandHello traders! Here’s a clear technical breakdown of BTCUSDT (3H) based on the current chart structure. BTCUSDT has been trading within a well-defined descending channel, reflecting sustained bearish pressure and consistent seller control. Throughout this phase, price respected the channel boundarie

BTCUSDTHello Traders! 👋
What are your thoughts on BITCOIN?
After the recent sharp decline, Bitcoin has entered a clear consolidation range. The upper and lower boundaries of this range are marked on the chart.
As long as price remains inside this range, we should not expect a strong directional move. In

$TAO Sitting on a Level That Has Never FailedGETTEX:TAO is sitting on a major long-term support level and this isn’t the first time.
If we look at the last three times we touched this support, we bounced strongly.
We may see some drop to form a wick below the support, just as we’ve seen in the last three instances. However, in each case, we
SOL Rejection at Resistance – Breakdown Toward 70?SOL Rejection at Resistance – Breakdown Toward 70?
SOL is showing clear weakness after failing to reclaim the mid-range resistance around 83–84.
Price rejected the horizontal resistance and continues to respect the descending trendline from the recent highs, confirming short-term bearish structur

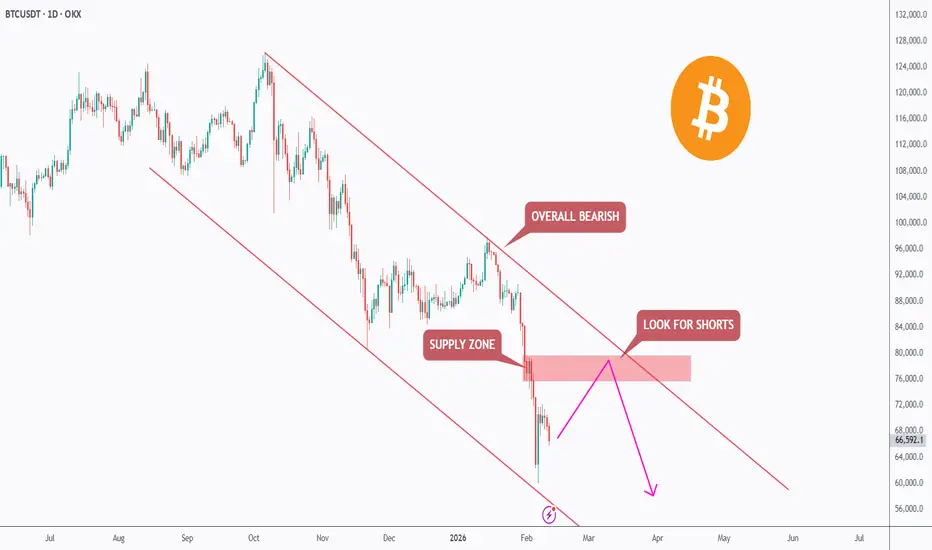
Bitcoin: Rally Into Resistance?Bitcoin remains overall bearish, trading inside a clear falling channel.
Now price is approaching a critical area:
🔴 The upper bound of the falling channel
🔴 A well-defined supply zone marked in red
When a dynamic trendline meets a static supply zone, it creates a high-probability reaction area.
See all crypto ideas
XAU/USD | Gold Breaks $5086, Now Testing Key Zones Again!By analyzing the #Gold chart on the 1-hour timeframe, we can see that after a small pullback yesterday, price made a strong move toward the $5086 resistance. Gold successfully broke this level and rallied up to $5121.
After reaching this important zone, price faced selling pressure and is now tradi
XAUUSD Builds Strength Above Demand - Next Target $5,190Hello traders! Here’s my technical outlook on XAUUSD (3H) based on the current chart structure. Gold is trading within a broader bullish market structure, supported by a well-defined rising trend line that has guided price higher over time. Earlier in the move, price entered a consolidation phase, f

Gold 30-Min Engaged ( Bullish & Bearish Reversal Entry Detected⚡Base : Hanzo Trading Alpha Algorithm
The algorithm calculates volatility displacement vs liquidity recovery, identifying where probability meets imbalance.
It trades only where precision, volume, and manipulation intersect —only logic.
Technical Reasons
/ Direction — LONG / Reversal 5043 Area
/ D

XAUUSD: Range Holding Strong - Upside Expansion PossibleHello everyone, here is my breakdown of the current XAUUSD setup.
Market Analysis
XAUUSD previously experienced a strong bearish impulse, breaking decisively below a key support area and triggering an acceleration to the downside. This sell-off marked a clear loss of bullish control and led to a

Gold Price Analysis – Resistance and Support LevelsThis chart highlights crucial price levels for gold, including Key Resistance Level at 5,440.457, where a breakout or price rejection may occur. The Minor Resistance at 5,112.237 could lead to a potential reversal. The Support Zone around 5,062.548 is being tested, with the expectation for price sta

GOLD Consolidation Both sides Phase Gold remains in a tight consolidation phase, with price action moving sideways as investors wait for a decisive breakout. The metal slipped toward the 5050 area today, trimming gains from the previous session as expectations for aggressive Federal Reserve rate cuts were slightly reduced.
Despite th

Lingrid | GOLD Weakening Price Action Suggests ExhaustionOANDA:XAUUSD has been respecting the upward channel, but recent price action shows signs of exhaustion as the market approaches the upper boundary of the channel. The recent rally has failed to break through the key resistance zone, forming a lower high. This suggests that the bullish momentum is w

GOLD Price Update – Clean & Clear ExplanationGold reflects a period of tight consolidation following a prior directional move. Price action is compressed within a narrow range, suggesting temporary balance between buyers and sellers. Candles show relatively small bodies with limited follow-through, indicating reduced momentum and hesitation in

Elise | XAUUSD · 30M – Demand Hold → Bullish ContinuationOANDA:XAUUSD
Gold swept sell-side liquidity earlier, reacted strongly from the lower demand zone, and transitioned into a controlled bullish structure. Price is now consolidating above a well-defined support base, suggesting absorption rather than distribution. As long as price holds above the dem

GOLD - Consolidation & compression to 5090. A show of strengthFX:XAUUSD fell back to $5018 after the release of NFP data, but the market is actively buying up the decline and heading towards resistance at 5090. Buyers are waiting for new triggers — US unemployment data and geopolitics
The NFP report was strong, but the dollar performed poorly and was una

See all futures ideas
EURUSD Price Update – Clean & Clear ExplanationEUR/USD is trading within a short-term bullish structure on the 30-minute timeframe, supported by a well-respected ascending trendline that has guided price higher over the past sessions. After a strong impulsive rally, the pair entered a consolidation phase, forming higher lows while gradually push

GBPUSD - Daily CLS - Model 1 - Full Range TPHi friends, new range created. As always we are looking for the manipulation in to the key level around the range. Don't forget confirmation switch from manipulation phase to the distribution phase to make the setup valid. Stay patient and enter only after change in order flow. If price reaches 50%

GBP/USD - Rising Channel Pattern (11.02.2026)📝 Description 🔍 Setup OANDA:GBPUSD
GBP/USD is respecting a rising channel structure, with price recently bouncing from the cloud support + channel base confluence (Point D).
Key observations:
✅Clean reaction from Fibonacci zone
✅Higher low formation inside the channel
✅Price reclaiming short-

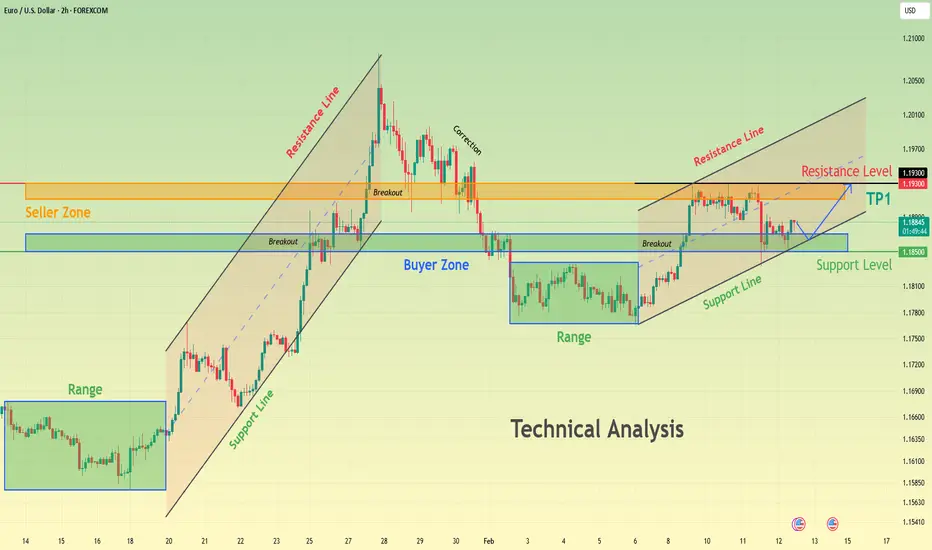
EURUSD Compressing Above Demand - Next Move IncomingHello traders! Here’s my technical outlook on EURUSD (2H) based on the current chart structure. The pair is trading within a broader bullish environment, supported by a clearly defined rising support line that has guided price higher over time. Earlier in the move, EURUSD entered a consolidation pha
#NZDUSD:+1050 Pips Possible Intraday+Swing Buying OpportunityDear traders,
We have a great opportunity with NZDUSD. The price could hit 0.7050 soon. There are two buying options:
1. **Risky Option:** Buy at the red line marked with a blue zone. This is a risky zone but the current price momentum suggests it could work out well.
2. **Safer Option:** If the

EURUSD Short: Corrective Pullback Into Demand Zone 1.1850Hello traders! Here’s a clear technical breakdown of EURUSD (4H) based on the current market structure visible on the chart. EURUSD previously printed a strong impulsive bullish move that topped at a well-defined pivot high, where buying momentum began to weaken and sellers stepped in aggressively.

USDJPY 30Min Engaged ( Bearish & Bullish Entry Detected )⚡Base : Hanzo Trading Alpha Algorithm
The algorithm calculates volatility displacement vs liquidity recovery, identifying where probability meets imbalance.
It trades only where precision, volume, and manipulation intersect —only logic.
✈️ Technical Reasons
/ Direction — LONG / Reversal 153.110 Ar

AUD/NZD on the Way to 1.20 and AboveRecent commentary from the Reserve Bank of New Zealand (RBNZ) and the Reserve Bank of Australia (RBA) continues to point toward widening yield spreads into 2026, with the RBNZ likely to remain on hold while the RBA leans toward renewed tightening. This policy divergence remains a supportive backdrop

EURUSD Euro ANALYSIS ( MUST READ IT )Hello traders
Here's my first idea about EURUSD EURO and what do think about it ? Kindly share your idea about SILVER EURUSD with me in comment section
Price is moving with clear market structure, confirming a valid BOS (Break of Structure) and strong institutional reaction from marked zones.
L

EURUSD - Will it break the resistance?EURUSD is currently trading within a well-defined 4-hour structure, where both support and resistance are clearly mapped by fair value gaps. After a strong recovery from the lows, price has entered a consolidation phase just below a key resistance zone. The market is now reacting precisely to higher

See all forex ideas
Trade directly on Supercharts through our supported, fully-verified, and user-reviewed brokers.


