USDCADBeing a retail trader isn't so bad as long as we can utilise all of the tools in our belt correctly.
(Trendlines)
Support and Resistance

EURAUDOur first analysis has failed. The pair could not break the resistance. we can see the presence of a double top reversal pattern. Wait for the 4 Hr candle to confirm the reversal candlestick pattern from the neckline.

NZDUSDThe pair has finally given us a proper retest of the broken neckline. We can adjust our stops and enjoy the ride.

EURUSDAdjusted entry. Came close to our previous stop. Now we can add more orders on the pull back from the support.

GBPAUDBreakout and retest. The pair did not show much signals over the weekend. Now it has given us a clear view.

EURGBP rejected at a strong resistanceThe pair EURGBP has been rejected at a strong resistance that was established in October 2016. The other traders will be looking at that important resistance to make portfolio changing decisions.

NZDUSD Daily & H4 Comparison Analiysis for next weekA Double Top formation on D1 followed by another Head & Shoulder Price Action Pattern on H4 which gives me Kicker to Trigger the Short option on this pair on the upcoming week.
Also to keep in Mind if not H&S on H4, then a Double Top from the same can also give me a good Sniper entry to go Short.
Depending on the Kicker and will decide my SL level but TP not less then 1:2
Trade Execution can be expected anywhere between Tuesday - Wednesday. So keep watching this one and put it on your To-Do List

Pulse of an asset ala Fibonacci: LRC two spurts of Golden GrowthThis Chart is a an example of a "Golden" Fib series.
This Concept is from "Chapter 5" of my going "book".
This Religion is of the universality of the "Golden Ratio".
.
My "Book" detailing my Methodology with Numerous Examples:
Chapter 1: Introduction and numerous Examples
Chapter 2: Detailed views and Wave Analysis
Chapter 3: The Dreaded 9.618: Murderer of Moves
Chapter 4: Impulse Redux: Return to Birth place
Chapter 5: Golden Growth: Parabolic Expansions
Chapter 6: Give me a ping Vasili: one Ping only
.

GBPUSD Linear reg targeting/ building the cause (reference)For reference.
Please reference Tom Williams or Richard Wykoffs material for a more thorough examonation and description of what creates bull or bear markets.
In the meantime:
The condition/health of the PRIOR trend has a direct impact of the condition/health of the CURRENT trend.
A lot to get into here. But use the above resources for a professional explanation of the logic involved in this.. because its alllll logical. Its not random and its not magic. The answer is in the supply/demand relationship.
V/R.

BankniftyBuy if any green candle or rejection candle in support area... will sold in red area with small Sl and Target


GBPUSD DEMAND LEVEL + FIBONACCIGBPUSD DEMAND LEVEL + FIBONACCI. Excellent week ahead. Looking for a buy in the demand zone!

GBPJPY DEMAND LEVEL + FIBONACCIGBPJPY DEMAND LEVEL + FIBONACCI. Look how the price is reacting to this powerful zone! What a week ahead!!!

Backtesting GUClear rejection in the 61.8 to 78.6 % fibnocci thereby forming the inverted H&S.
+130 pip in profit with no drawback.

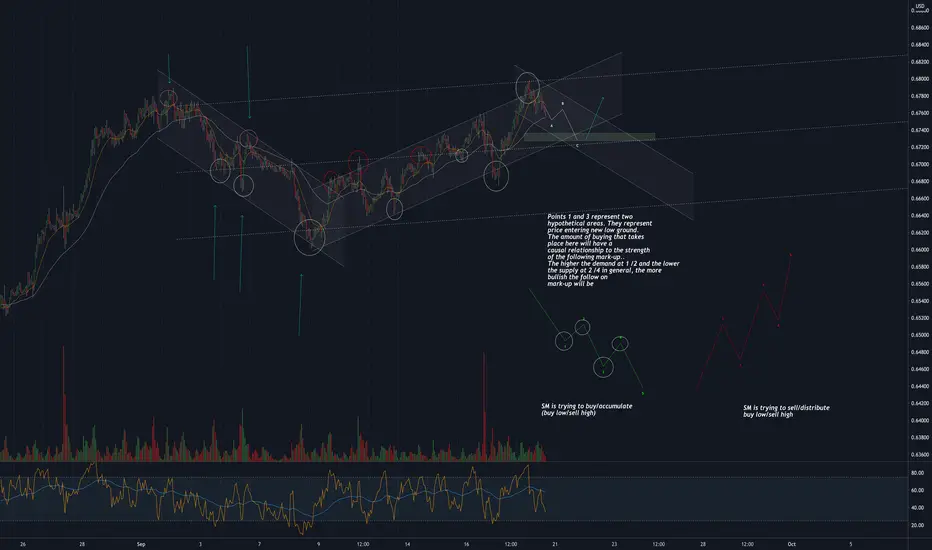
Trend analysis/Building the cause in a mark-down (reference)As part of a thorough trend analysis you can use the 1 hour to determine the condition of the current trend and how it will determine the condition of the following Mark-up or mark-down phase.
(In order to draw anobjective channel i suggest activating the linear regression indicator)
As a visual aid/reference imagine the upper line of the channel as your supply line and the lower line of the channel as your demand line.
Imagine the buyers at the bottom and the sellers at the top.
With each tap off of the demand line, how did the volume change, how large was the presence of buyers?
Same with the supply line
With each tap off of the supply line , how did the volume change, how large was the presence of sellers?
Roughy estimate what side of the equation is higher.. the buyers or the sellers?
RSI is another story . Just know that is the edges that should be of concern with RSI, not the center.