HOW-TO: Use the MTP WPT Script to project Elliott Wave TargetsIn this "How To" video, we take a look at how to use the MTPredictor WPT (Wave Price Targets) Script to project, in advance, possible areas where a manual Elliott Wave count is likely to end.
First, you must have your own idea of an Elliott Wave count that you you wish to use on the chart in question. (How to perform manual Elliott Wave counts is not covered in this help video).
Next, you tell the Script which Elliott Wave you would like to project the end of; then you tell the Script which pivots to use for your own manual Elliott Wave count. The Script then places coloured zones on the chart for the areas where the next anticipated Elliott Wave swing is likely to end. The coloured zones (or Wave Price targets as we call them) are clusters of the relevant Fib ratios from the previous swings. The scripts knows which ratios to use for which swings and then does the calculation to cluster the relevant price levels together for you in easy to see coloured zones.
The Scripts can project the WPT zones for the possible end of Waves, 2, 3, 4, 5 and C.
Please note: this is not a trade recommendation, you should all perform your own Analysis. Losses can and will unfold when Trading, please always use Stops and keep your losses small.
Support and Resistance

WHAT ARE SUPPORT AND RESISTANCE?BITCOIN IS IN DOWNTREND WE ARE SEEING A GREAT SUPPORT AT 30K TO 33K LEVELS. THAT MEANS INVESTORS/TRADERS ARE HEAVILY BUYING AT THIS ZONE.
THIS DOWNTREND STARTED WHEN INVESTORS STARTED TO BOOK PROFITS ON 65K FOLLOWED BY SOME NEGATIVE NEWS.
THIS RESULTED IN RESISTANCE ZONE AT 65K LEVELS.
LIKE IF YOU GET TO LEARN SOMETHING NEW.
PLEASE COMMENT IF YOU ANY DOUBTS ABOUT THIS CONCEPT.
FOLLOW US FOR MORE EDUCATIONAL IDEAS.


Base patterns One of the most powerful zones for trade is the Base Patterns. which can be shown as - Rally Base Rally- Rally Base Drop- Drop Base Drop- Drop Base Rally. In fact, the base between two Sharp movements with good momentum. you can find a good base area and decide for trade long or short!
Good luck

HOW TO SPOT A MARKET REVERSAL: A beginner's guideHappy Friday, ladies and gentlemen. The topic of our first educational post for the day is the following: How to spot a possible market reversal. Of course, there are many strategies and various methods one can implement to identify a reversal in the markets. The method that we will be talking about today is relatively simple and really effective.
We use two methods to determine a possible reversal: Double Top/Double Bottom pattern formations or break of a trendline. As it can be inferred from the chart, both of the cases of a market reversal strategy that we implement can be noticed.
The first one is a Double Bottom Reversal. When the price manages to create a Double Bottom/Double Top on higher timeframes, it means that the price has not been able to break the structure and is on his way to reverse. Looking at the graph, we can observe that the price’s attempts of breaking the 1678-1680 level of support to the downside resulted in being unsuccessful. Therefore, a nice double bottom formation had been formed and the price started moving to the upside from there.
The second approach is even more simple, we just follow the trend. Remember the saying: “Trend is your friend until the bend in the end”? That’s right, if the price manages to break an uptrending or a downtrending trendline, it’s time to reverse for the most part. Looking at the chart, we can see that the price failed to create a new Higher High, and it broke the uptrending trendline to the downside and started dropping massively.
That's it for the topic of "Market Reversals", family! Hope you enjoyed it. If you have any suggestions on what kind of educational posts we should post next, feel free to let us know in the comment section below!
Have a nice day and an amazing upcoming weekend!

What is a Cup and Handle Pattern? GBP/USD Real ExampleGood morning, traders! Today we will make an educational post about a specific behavior in the market in certain circumstances, and we wanted to take advantage of the situation in GBP/USD that is currently happening.
The pattern we are talking about is the CUP AND HANDLE PATTERN . This pattern is widely used in stocks or indices since they are trend instruments by their essence, and it serves to catch a potential rise in price after a correction. The premise for this pattern to be valid is that the asset is in a CLEAR trend, either bullish or bearish, and has initiated a corrective process.
A cup and handle is a technical chart pattern that resembles a cup and handle where the cup is in the shape of a "u," and the handle has a slight downward drift.
There are three key things to consider when forming these patterns:
🔸Length: Generally, cups with longer and more "U" shaped bottoms provide a stronger signal (this case). Avoid cups with sharp "V" bottoms.
🔸Depth: Ideally, the cup should not be overly deep. Avoid overly deep handles, as handles should form in the top half of the cup pattern.
🔸Volume: Volume should decrease as prices decline and remain lower than average in the bowl base; it should then increase when the stock begins to make its move higher, back up to test the previous high.
🔸In addition, it is also an important factor that the handle is a clear corrective pattern and has some point of support or support. In this situation, we see that in the daily chart, the price is touching the uptrend line, and also in the published chart, we see how it is also testing the broken zone of the range. The current reversal point is solid.

Triangle patterns - All you need to knowToday, we will explain the most important concepts behind triangle patterns.
The first thing you have to know is that triangle patterns are composed of 5 waves which we can define using letters "a,b,c,d,e" This concept was created by Ralph Nelson Elliott, one of the fathers of modern technical analysis and mainly known because of the "Elliott Wave Principle."
Most of the times , we are used to observing corrections with Zig-Zag shapes
These are really easy to spot because C always goes below A, and we can say, "NOW is finished." However, with triangle patterns, we need more patience, its not that easy to say "now is ready" because we never have waves that go above or below the other ones; it's a constant compression. That's the reason it is imperative to wait for 5 clear waves.
Another important concept of triangle patterns is that we can start drawing these two lines that will intersect in the future. These two lines will tend to contain the pattern until the breakout or the cancelation of it.
Ok, let's assume that you had the patience to spot a clear triangle pattern. How should I trade them?
ENTRY LEVEL: ALWAYS above "D" but much better above "B." Why? Because at that level, the price would have broken 2 resistances zones which is a strong sign for the bullish thesis.
STOP LEVEL: ALWAYS below A that was the main support of the structure, so we want to exit our position if the price goes below that level
TAKE PROFIT LEVELS: USE fibo extensions on the previous impulse and pay attention to two levels, 1.27 and 1.68
Important concept: Remember that context IS EVERYTHING. You don't want to trade isolated structures; you want to trade a structure and a macro context aligned with the view you have.
Final idea: Here, we have used a Real example on TSLA. We think that the best way to show these theoretical concepts is by looking for real scenarios and testing them. Here we think that the corrective pattern is not finished, and we want to observe a clear ABDE before setting confirmation areas. It's important to know also that technical analysis is not mathematic; it's closer to soft sciences/disciplines. This means that Technical Analysis is not a fundamental science that explains all the movements of the market; that would be nonsense; technical analysis provides us with statistical guidance that can help us project a probabilistic scenario which can happen or not.
Thanks for reading! Feel free to share your vision and ideas in the comment box.

Support & Resistance VS Supply & Demand | ForexBeeSupport and resistance are the zones from where most of the sellers/buyers are willing to place their orders. for example, a round number 1.30000 will also act as an S&R zone due to psychological level.
price bounces from support and resistance zones many times and it always remains valid. More bounces mean a stronger zone.
.
.
Whereas the supply and demand zone is an area where big institutions place their pending orders. when price fills pending order from zone then demand or supply is consumed. it is no longer valid now. it does not work like bouncing, again and again, in support and resistance.
This is the main difference.
Learn more at forexbee

Easy Continuation Setup For AllThis is an example of an easy continuation setup. Works on every timeframe. Please do backtest this technique and don't forget to do multi-timeframe analysis.
Credit goes to Bystra.

How To Trade Bullish Engulfing CandleA bullish engulfing candle occurs after a significant downtrend. Note that the engulfing candle must encompass the real body of the previous candle, but need not surround the shadow.
In order for the Bullish Engulfing signal to be valid, the following conditions must exist:
• The Forex pair must have been in a definite downtrend before this signal occurs. This can be visually seen on the chart.
• The second candle on hourly, 4 hour or daily candle of the signal should be a green (blue on my example) candle opening below the Close of the previous day and closing above the Open of the previous day’s black candle.
I just place enter order at start of next candle after engulfing candle concludes, with a stop loss at below of this candle or on example hourly chart of EURCAD related to ADR, place stop loss at 20 pips for day trade- exit when price action or target hits 40 pips. 1:2 risk reward setup.

Currency Correlations: The unspoken truthHappy Friday, ladies and gents, and welcome on our another educational post for the day. Today, we are gonna talk about positive currency correlations and examine how they impact our trading. But to begin with, what is currency correlation? Currency correlations are a statistical measure of the extent that currency pairs are related in value and will move together. If two currency pairs go up at the same time, this represents a positive correlation, while if one appreciates and the other depreciates, this is a negative correlation.
As it can be clearly inferred from the graph, the charts of EUR/USD and GBP/USD have been chosen to be scrutinised. These two currency pairs are highly correlated and are moving in the same direction. As we can see, 2 major similarities have been identified on the Daily timeframe charts of both currency pairs. However, there are a lot more than just 2. As it can be inferred from Similarity #1, the price managed to leave a long wick in late February 2020 for both pairs. Looking at Similarity #2, we can observe that the price is forming a top for both pairs and preparing to reverse and continue its move to the downside.
Now that we have talked about the basics, let's move on and talk about some problems faced by currency correlations. Most of the time, new traders do not pay attention to this basic concept and make false decisions without noticing. I have seen hundreds if not thousands of traders that ignore the rule of currency correlations and make irrational conclusions like the following: opening Buy positions on EUR/USD and opening Sell positions on GBP/USD. Of course, you can do that as well, depending on the timeframe that you are trading and depending on how long you are planning on keeping the trades open. However, on the longer term trading, you won't be able to succeed. Furthermore, most of the new traders open buy or sell positions for both of the trades, which results in increasing their risks. If you open BUY or SELL positions for both trades at the same time, and the price moves in the opposite direction of your bias, you are gonna lose both of the trades. Again, not in all cases, but 80-90% of the time, as the two pairs are highly correlated.
What can be done to avoid being the victim of the highly correlative pairs and keep it safe? There are two strict rules that we follow, which have always worked for us:
-Open positions for the trade with the better setup
or
-Open positions for both trades but cut the lot sizes by half
So in the first case, we compare the two setups that we have, in our case it's either EUR/USD or GBP/USD. For instance, let's say that EUR/USD gives us more confluences for opening a transaction. Therefore, what we do is, we ignore GBP/USD and trade EUR/USD. For the second case, let's say that we use 1.0 lot size to open transactions. What we can implement, is using 0.5 for each trade and opening positions for both EUR/USD and GBP/USD.
I hope you liked this educational post, family! If you have any suggestions on what we should post next as an educational post, feel free to let us know in the comment section below. Have an awesome upcoming weekend, everyone!

Creating Lines with ShortcutsCreating lines on a chart is one of the most fundamental methods of charting when performing technical analysis . Being able to create these effectively and quickly is a very useful skill to have.
Horizontal, Vertical and Cross lines can all be found on the drawings panel to the left of the chart in the subgroup “Trend Line Tools”. These tools can be added by selecting them from the subgroup and then placing them on the chart.
However, a more efficient method to creating these lines is to utilize the hotkey functions:
Horizontal Line Shortcut:
- Alt+H (PC), or Option+H (MAC)
Vertical Line Hotkey:
- Alt+V (PC), or Option+V (MAC)
Cross Line Hotkey:
- Alt+C (PC), or Option+C (MAC)
Becoming more efficient in your ability to draw lines on your chart will allow for quicker identification of areas of support/resistance and times on your chart.
Be sure to visit our help center to learn more about these tools!
More information on the Horizontal Line tool:
www.tradingview.com
More information on the Vertical Line tool:
www.tradingview.com
More information on the Cross Line tool:
www.tradingview.com

best tool for predicting tops and bottomsi've been talking about margin buying/selling pressure levels a lot lately. why? because they're a simple and effective tool for predicting tops/bottoms and support/resistance levels. if you're trading crypto and you're ignoring these levels, you're putting yourself at a disadvantage.
just take a look at this simple example from bitcoin's recent volatile price action.
the levels are simple to calculate, and most traders probably at least have the 2x/3x levels in mind, but i published public scripts that will plot them on your chart for anyone who is interested. all you need to do is input the support/resistance level. would be better as a drawing tool (i.e. like fib extension, or something like that), but as far as i know there's no way for regular users to develop TV tools (please let me know if there is!).
shout out to CryptoStackers (youtube) for pointing out how well these levels work.

The importance of identifying the trend..!171 days ago when tesla was 599 I asked my folowers to buy with a target price of 750 which was updated to 900 after that 1 TSLA
Today Tesla is green but I don't recommend buying it even though it could go up to 650..!
What is the reason behind it?

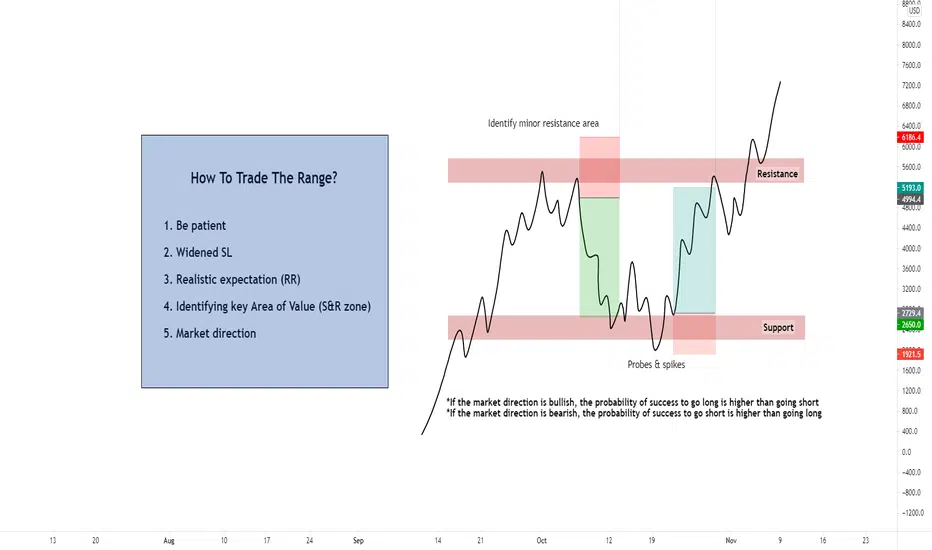
Simplify Your Range Setups - How To Trade It?Hi Traders, today's topic regarding " How to simplify range setups? " If you are someone who's constantly giving back profits during range bound condition, this post is dedicated for you. Majority of traders are able to make money during trending condition, but only to watch huge chunk of their profits peeled off during a choppy/ range bound condition. These are few of the simple steps to improve your ability to trade the range safely.
1. Be patient
Majority find range bound condition difficult to trade due to the lack of patience. There's no way you'll be able to identify a range without giving it time to develop. When the market is experiencing some volatility contraction especially after a strong trend, it is a precursor telling you probably you need to take a step back. Give the market enough time to develop a clear structure, it will improve your decision making process. Avoid having the sense of urgency to get involved.
2. Widened SL
To trade the range safely, you must widen up your Stop Loss to prevent probes & spikes. Unlike any textbook range condition, a range bound condition in the live market contains plenty of fakeout. By widening your SL, it provides some cushion for your range setups to breathe and allow you to have a calm state of mind. Because once you get stopped out with a widened SL, it signals you probably the range condition is coming to an end.
3. Realistic expectation (RR)
Majority tend to ' predict ' the break rather than respect the market. Avoid having some unrealistic expectation if the market itself is presenting a tighter range. If it is a 50 pips range, by having a 100 pips target you are enforcing your personal will & expectation into the market. By doing so, you would always see some of the great range setups turning against you.
4. Identifying key Area of Value (S&R zone)
During a range bound condition, it's vital to spot key S&R zones and ignore the minor ones. The only Area of Value for range setups area is S&R zones, if you're trading a continuation pattern (Eg. flag) within a range, most likely it might fail.
5. Market direction
By identifying the market direction, you are improving the probability of success . Think about this logically, If the market had a prior bullish impulse, the probability of success to go long is higher, because buyers' are in control, the probability of market breaking above the range is greater too, vice versa.
Comment down below what's your worst experience trading the range!
"Trade what you see not what you think." - Warren Buffet
Trade safe as usual.
Do follow my profile for daily fx forecast & educational content.
Fibonacci 101Fibonacci retracements follow a mathematical principle set forth by Leonardo Fibonacci.
To put it simply - each level is a ratio between two other numbers, and there are countless examples of them being respected in the stock market, forex, crypto, commodities - you name it. For this reason, it's an essential tool in the technical trader's toolbox.
There are many uses for this tool:
Finding regions of support or resistance
Helping with stop loss placement
Establishing targets to take profit - especially during price discovery (no existing S/R levels)
Rules of Thumb
While placement of your anchor points is somewhat subjective - a rule of thumb is to stick with glaringly obvious swing points .
Simple is best with this tool - one of the reasons that it works is that other traders (or trading algorithms) are watching the same regions of price as you are. No need to overcomplicate it!
For a bullish retracement (+ targets) - begin your Fibonacci at a swing low, and end it at a swing high.
For a bearish retracement (+ targets) - begin your Fibonacci at a swing high, and end it at a swing low.
Personalizing Your Settings
The way I have my Fibonacci retracement tool configured, it includes some trend-based Fibonacci extensions in the calculations as well. This can be done by opening your Fibonacci settings and adjusting the inputs. The levels I have as inputs are as follows:
0 - This is your starting point
0.236 - The shallowest retracement
0.382 - Shallow retracement
0.5 - While not a Fibonacci number, this is the midpoint of your swing
0.618 - Commonly referred to as the "Golden Pocket" - this is generally a very important region of support/resistance.
0.705 - While not a Fibonacci number, this is the midpoint between the 0.618 and 0.786 - a level that tends to see lots of activity, and is thus included in my settings.
0.786 - This is the deepest retracement before a full retrace.
1 - This is your ending point
-0.27 - While not a Fibonacci number, a very commonly used extension target during price discovery - Target #1.
-0.414 - While not a Fibonacci number, a very commonly used extension target during price discovery - Target #2.
-0.618 - This is your golden ratio - Target #3 during price discovery.
-1 - This is a 100% extension of the distance between your starting & ending point.
etc, etc - you can extend as far as you like!
Where Fibonacci extensions really shine is during price discovery - areas where there are no previous levels of support or resistance (new ATH's).
You can see on this $SPY chart - using our Fib tool on the COVID crash gave us some very accurate upside targets for the subsequent rally into new ATH's.
I hope this introduction to the Fibonacci Retracement tool on TradingView helped you develop a basic understanding of it's applications - make sure to like if you learned something and follow us for more!
Will, OptionsSwing Analyst

Our Favorite Way To Set Take Profit Orders/Levels Typically, most traders have no idea how or where to set their take profit orders on any given trade. Most inexperienced traders will choose a risk/reward ratio and set their take profit based on a specific ratio. For example. The trader defines where their stop loss order will be, then drags their take profit up until it says "Risk/Reward = 3". Determining your take profit order/level based on this provides the trader with no increase in profitability/edge, and we call this gambling.
Generally, the first thing the trader should be doing is setting their stop loss prior to determining the take profit. The stop loss is one of the most important factors to consider that can have a dramatic affect on how profitable your strategy will be. After the stop loss has been determined, assuming we want to go long, the first thing to identify that will aid in determining the take profit price/order is, identifying where key levels of resistance are as well as pivots.
We have found that in the markets, one should never assume the market will break past a specific resistance/pivot. Although it may happen, your take profit should never be at the mercy of the pivot blocking price. With that being said, the trader should ensure their take profit is not beyond the nearest pivot/resistance to increase profitability. For example, if price just broke resistance and is retracing back down for a retest as support, to get the highest profitability/success rate, we recommend to ensure your take profit is slightly below the pivot just above the support, which the price is retracing from. A trader could attempt to take the trade further beyond the first initial pivot/resistance, to increase net profit for the given trade, however, the trader needs to understand that doing this requires close monitoring of the trade to identify rejections at the pivot. Based on our research/back-testing, it is a viable option for traders to try to extend the take profit beyond the first pivot/resistance as long as the trader is monitoring the trade closely. Some of the things that the trader should be looking out for is, a bearish rejection off the first pivot, signifying that price may return to the support/entry price. Based on our research, roughly 39+% of the time, the trader can expect the first pivot/resistance to breakout with high volume and a large candle, which can then be used to extend the take profit if managed properly.
Ensuring that both your take profit and stop loss are placed/managed methodically will greatly increase profitability based on statistics.

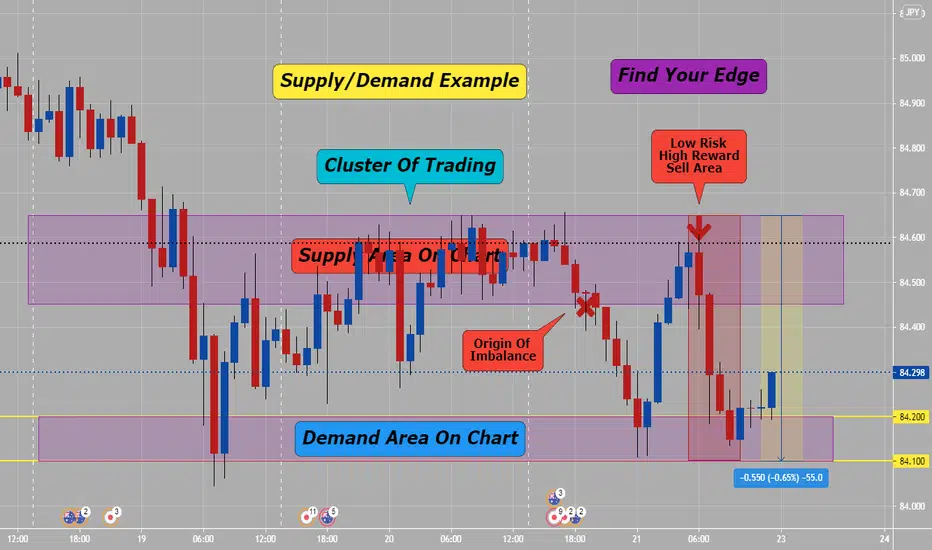
Supply & Demand: Sell Trading ExampleAfter a range or sideways area breakout, retracements in price action are always the best places to enter into any buy or sell trades- they have the lowest risk/highest reward setups and best risk management.
The True resistance/supply is within the range of the cluster of price action. It begins at the origin of the supply/demand imbalance. - for bearish trades
(See chart example of bearish trade coming from supply area)
The True support/demand is within the range of the cluster of price action. It begins at the origin of the supply/demand imbalance. - for bullish trades
This trade had a possible 50 pip potential: How much of that could you have got with right stop loss and risk management of 1%,2% or? whats your plan!!
BTCUSD - 1dIf you notice that in the previous Bitcoin crash, there was a move during which the bearish move did not go above the previous candlestick, in other words, no previous candlestick broke until a long shadow candle (pin bar) was formed and Then a powerful ascending candlestick broke its previous candlestick and then an ascending movement was formed ... such movements are called micro-channel in price action ... and as you can see, a micro-channel is also formed in this fall. And we must wait for the failure of this micro-channel ...

The 4 Hour/50 Pip Stop StrategyEach week on the 4 hour time frame charts: Monday and/or Tuesday will set the low of high for week's price action. If you can use the Fib. Ret tool and look ahead of current price action will retrace, then you can figure where the golden zone of 38.2% to 61.8% of Fib ret tool is:
Rules:
1) Measure low to high of last move on 4 hour chart.
2) Figure where the golden zone of fib ret tool is or between 38.2% to 61.6%
3) Place stop loss of 50 pips from 61.8% price line dropped down 50 pips- this might go further then 38.2% (by that is okay)
4) Trend for week will mostly start of Tuesday, Wednesday and Thursday- so this is a swing trade for a few days.
5) Targets can be as follows: Set 1st target is 1:1 (50 pips stop/50 pip target): 2nd target is 1:2 (50 pips/100 pips) and 3rd target is 1:3 (50 pips/150 pips)
6) Would discontinue or exit target Thursday or early Friday if Target is not hit and not hold it over weekend, but that is your choice.
Example on chart is: 1:3 Risk Reward of 50 pips stop vs. 150 pip target. (Buy Trade)- opposite can happen on (Sell Trade)
* I consider that a great trade set up and profits for three days of price action. You can always bring stop up as price action goes up, but you need to let trade breathe related to being a 4 hour chart.


Bitcoin - Wyckoff Distribution SchematicBINANCE:BTCUSDTPERP
Bitcoin - Wyckoff Distribution
Further details in english:
Link in english
Further details in spanish:
Link in spanish

My experience as a breaokut trader on stocksFirst of all, what is a breakout trader?
It's a type of style in which we look for a clear consolidation period, and we aim to trade after the pattern is broken. Check the main chart on TSLA to get the concept. The main idea of this comes from the Elliott Wave principle, in which consolidations tend to be the beginning of a new motive wave or impulsive wave. Why are we saying "Tend"? Because it's a probabilistic scenario, we do not have certainty about any given trade outcome. (We will speak about this later)
Let speak about the main idea of this
There are 4 types of corrective patterns that you can use to wait for a breakout. We have seen that the best structures to trade are Flat, Zig-Zags and Triangles. Irregulars tend to be confusing situations. now we will check some key ideas that we have learned
Always trade above B and set your stop loss below the structure
By doing this, you will be able to avoid many fake-outs, which will increment your Win Rate. Also, you must look for situations where you have a risk-reward ratio above 1.7
Here you can check an image where trading above B would have saved you from a fake-out.
Context is Everything
Never trade a structure because looks nice. You need to find a beautiful context for every structure you are planning to trade. Take this situation as an idea of a great place to develop a setup.
What can you expect from this type of trading?
You can expect to have a win rate between 45% to 60% depending on your level of accuracy looking for structures. And you can expect an average risk rewards ratio of 1.7 / 2
Thanks for reading!
