PRICE ACTION PATTERNS | Descending Triangle 🔰
Hey traders,
In this video, you will learn a classic price action pattern "Descending Triangle".
Main topics covered:
Structure of the pattern
Bias of the pattern
Triggers
Stop placement
Target selection
Real market example
Let me know in a comment section what pattern do you want to learn in the next video!
❤️Please, support this video with like and comment!❤️
Support and Resistance

⚡️♦️Breakdown of the Big Gold Short♦️⚡️Greetings To You Traders
▫️Let’s break down this superb trade timeframe by timeframe
▫️One of the the most important factor in our lives is Time.
▫️It also proves to be very important In our trades as well
I will break down this trade in the same way I did when I took it on Friday
I use just 4 things in my trading:
1. Recent price Structure ( Supply and Demand)
2. Overall Structure (Support and resistance)
3. Structural moves ( Higher Highs/ Higher Lows ( Uptrend)
4. Structural moves( Lower Highs / Lower Lows ( Downtrend)
▫️First Time frame : Daily
Key factor : Resistance level
Looking at the daily timeframe you could see that price had reached a previous support now turned into resistance
This is a textbook market structure move and is very profitable if traded well
♦️♦️♦️♦️♦️♦️♦️♦️♦️♦️♦️♦️
▫️Second Time Frame : 4 Hour
Key factor : Supply Zone
Looking at the 4 Hour time frame I saw a nice supply zone and all I was waiting for was the wick rejection and entry on smaller TF
♦️♦️♦️♦️♦️♦️♦️♦️♦️♦️♦️♦️
▫️Third time Frame : 1 Hour
Key factor : Structure move ( lower lows )
Look at the 1 hour time frame I observed that the market was now making lower lows
Very typical for price to do so in a down trend and that is when I started loading up my lots
My stops were above structure and I took the plunge
♦️♦️♦️♦️♦️♦️♦️♦️♦️♦️♦️♦️
▪️I hope this breakdown can help you in executing your own trades too and using multi time frame analysis
▪️Be kind and leave a like and a follow : )
God bless you all
Slick✨

FIBONACCI RETRACEMENT & EXTENSION | Trading Basics 📚
Hey traders,
In this video, I will teach you the basics of fib. extension & retracement.
In this lesson we will cover:
Settings for fib.retracement
Settings for fib. extension
Impulse leg & correct drawing
Application in a trending market
Let me know in a comment section if you want to see more lessons like that.
❤️Please, support this video with like and comment!❤️

Gold being resisted despite Inflation.Classic pattern formed in the 15mins tf. looking for sells to the trend line below.
If you want to be a better trader, CHECKOUT ENCYCLOPEDIA OF TRADING.
Train your eyes to see patterns.
I traded this with 0.02 lot size.

Regressive VWAP Breakout StrategyStrategy type: Breakout
Ingredients: Price, Volume, Regression
Prerequisite add-ons (free): Regressive VWAP and Strategy Visualizer
Target market: CME:BTC1! or BITSTAMP:BTCUSD
- Long Entry on Close crossing over Regressive VWAP
- Short Entry on Close crossing under Regressive VWAP
- Optional: exit when price retraces to upper band (LX) or lower band (SX)
The key to this breakout strategy is the Regressive VWAP, which weighs Price and Volume with Regression Analysis, making the slope and its bands more responsive, with a degree of mean reversion.
Below is another example, this time CME_MINI:ES1! .

How to frame your market trendlines here i tried to explain how to retrace your trendilnes from long frametimes to small ones, in order to have some guides during your trading.
so, keep your eyes on my posts.
i will playback some market, in this case, i can convience you about the utility of that.
good luck
NB: these lines should be saved on your chart every time you open it.

My Strategy Works On All Markets and All Time FramesPrice closed above EMA 20, EMA 10, Horizontal Support Resistance, and Trend Line. A pin bar formed on the retest and the pin bar candlestick wick protruded through the support levels. The support levels are EMA 20, EMA 10, Horizontal Support Resistance, and Trend Line.
In this example, there are three higher lows moving into a diagonal resistance level and a horizontal resistance level. Price broke through those two levels and retested those levels with a pin bar. After the break and close above the horizontal and diagonal level; those levels became support.
Entry is the closing price of the pin bar. Target price is the previous swing high.

Geometry: Cycles, Angles, and SymmetryIn this chart, we see Bitcoin.
The harmonics of two are as such:
1, 2, 4, 8, 16, 32, 64
Cycles are merely sequences;
sequences can be arithmetic, geometry, or some other variation ( harmonic for example is 1/n).
is a sequence. If we are looking at the idea of cycles in terms of the time duration between highs, lows, highs to lows, or lows to highs, we could measure out the duration of a high to high using that as the base one unit.
is also a sequence; this is a geometric sequence with the factor being two; likewise as the above scenario, we could take the first measurement, and use it as a base unit.
Explore the different sequences, and explore the relationships of price and time: time from high to high; time from low to low; time from high to high to low to low to high; price from high to high; price from high to low; price from low to low.
Some sequences to start off are
1,2,3,5,8,13,21; n = (n-1) + (n-2)
1,1.414, 1.73, 2, 2.23; n = sqrt(n)
.236,.382,.618,1,1.618,2.618; n = 1.618n
In-exhaustive book list
Law of Vibration - Tony Plummer
Michael Jenkins - Geometry of Stock Market Profits, Chart Reading for Professional Traders, Complete Stock Market Forecasting Course
Scott M. Carney - The Harmonic Trader, Harmonic Trading Volume I, Harmonic Trading Volume II, Harmonic Trading Volume III
H.M. Gartley - Profits in the Stock Market
Bill Wiliams - Trading Chaos, New Trading Dimensions, Trading Chaos 2nd Edition
J.M. Hurst - The Profit Magic of Stock Transaction Timing, Cyclic Analysis: A Dynamic Approach
Disclaimer: Not financial advice, no warranties of merchantability, profitability, or probabilities.

Geometry: Angles, Cycles, and SymmetryThe harmonics of two are as such:
1, 2, 4, 8, 16, 32, 64
Cycles are merely sequences;
sequences can be arithmetic, geometry, or some other variation ( harmonic for example is 1/n).
is a sequence. If we are looking at the idea of cycles in terms of the time duration between highs, lows, highs to lows, or lows to highs, we could measure out the duration of a high to high using that as the base one unit.
is also a sequence; this is a geometric sequence with the factor being two; likewise as the above scenario, we could take the first measurement, and use it as a base unit.
Explore the different sequences, and explore the relationships of price and time: time from high to high; time from low to low; time from high to high to low to low to high; price from high to high; price from high to low; price from low to low.
Some sequences to start off are
1,2,3,5,8,13,21; n = (n-1) + (n-2)
1,1.414, 1.73, 2, 2.23; n = sqrt(n)
.236,.382,.618,1,1.618,2.618; n = 1.618n
In-exhaustive book list
Law of Vibration - Tony Plummer
Michael Jenkins - Geometry of Stock Market Profits, Chart Reading for Professional Traders, Complete Stock Market Forecasting Course
Scott M. Carney - The Harmonic Trader, Harmonic Trading Volume I, Harmonic Trading Volume II, Harmonic Trading Volume III
H.M. Gartley - Profits in the Stock Market
Bill Wiliams - Trading Chaos, New Trading Dimensions, Trading Chaos 2nd Edition
J.M. Hurst - The Profit Magic of Stock Transaction Timing, Cyclic Analysis: A Dynamic Approach
Disclaimer: Not financial advice, no warranties of merchantability, profitability, or probabilities.

Regressive VWAP Band Buffer Strategy on GC 10RRequired add-on (free): NEXT Regressive VWAP
Target market: COMEX:GC1! 10R chart
Strategy Overview:
- Long when price crosses upper band (green)
- Short when price crosses lower band (red)
- Do not initiate trades in the buffer zone (between the bands) - that is our filter
Setting Alerts:
Here is how to set price (close) crossing band alerts: open a chart, attach NEXT Regressive VWAP, and right-click on chart -> Add Alert. Condition: Symbol, e.g. ES (representing the close) >> Crossing >> Regressive VWAP >> Upper ( or Lower) Band >> Once Per Bar Close.

CoRA Ribbons - Two ideas how to use themSince CoRA Waves and Ribbons could help you to identify the trend better and more reliably, this indicator provides a good baseline for your strategy.
The indicator " CoRA Ribbon - Multiple Compound Ratio Weighted Moving Averages " (#revision: lv21) was used in the following screenshots. Information and details on CoRA waves can be found in the description of the indicator.
Let yourself be inspired. Let's start.
These are just two of the many possibilities. I look forward to any further suggestion or idea. Comments and additional screenshots are always welcome.
Even if CoRA Waves lag less than other moving averages, note, as with all other strategies, that one indicator alone is usually not sufficient. Usually further analyzes and the like are required. Therefore, understand the two examples for what they are: A hint that it is worth taking a look and perhaps one or the other known moving average can be exchanged very well with a CoRA Wave or a CoRA Ribbon - in order to get faster entry points.

Volume Profile (Top 3 Reasons To Use Value Area Trading)Top 3 Reasons To Use Value Area Trading (on Volume Profile)
1) Plots on a vertical scale and gives you a specific price level where the most volume has occurred.
2) You gain far more information about price levels and volume.
3) Most importantly: Makes it easier to sport institutional support and resistance levels.
Why is it important to know where 70% of trading volume? Because retailer traders need to know where large institutional or big banks are buying and selling and need to trade with them, not against them.
POC or point of control is the LINE on chart is the largest volume by institutional traders- on the chart. Largest horizontal line.
*IF price action is above point of control- then trade bullish or buy
*IF price action is below point of control- then trade bearish or sell
You can see thin volume outside of the value area, where price action moves quickly thru areas into value areas.
You can use last couple or few days to find volume profiles or value areas to determine where price action might go too.

SUPPORT & RESISTANCE. Explanation For Newbies👨🏫
✅Support and resistance levels are the price areas on the chart where the price has ever changed its direction. This place always attracts traders, because near the levels there are obvious places for setting stop losses and entering into a deal. Also, there are always limited orders of large buyers or sellers near the levels.
❇️We can say that the level is a price area in the market where traders consider the price to be overstated or undervalued, depending on the current market dynamics. Therefore, it is always important to pay attention to the key levels at which support and resistance have reversed roles or there has been a strong rebound in the price.
⚠️What is the support level?
🟢In theory, the support level is an area below the current market price where participants will make purchases and there are high chances to keep this area under pressure from sellers. At the time of the test of the support level, prices are repelled and begin to rise, therefore, the pressure from sellers decreases, since they cannot gain a foothold under the level to continue moving down. We can say that the buyers, in this case, were stronger.
🟢As a rule, such levels can be determined in advance on price charts. These can be both daily and hourly charts. However, experienced traders identify higher time intervals as more important. For example, the support level on the daily chart will be much stronger than the support area on the five-minute timeframe.
🟢On a daily time interval, prices can test support for weeks before bears can push the price lower. On a five-minute chart, sometimes one test is enough to gain a foothold below and move to the next level.
🟢Also, with the breakout of the support level, we can state the completion of the development of the upward movement. If prices are rising, and after the test of the support level, we constantly observe a rebound and a continuation of the rise. In this case, we can talk about the continuation of the upward trend. If at some point we observe a breakout of the support level, then we can think about the end of the upward trend on the chart.
⚠️What is the resistance level?
🔴The resistance level is the opposite of the support area. If the support is below the current market price, then the resistance area is above the current market price. Thus, resistance indicates an area where the pressure from sellers is much higher than the pressure from buyers, prices are repelled and a drop occurs. Therefore, at the moment of testing a strong resistance level, prices quickly push off and begin to move in the opposite direction.
🔴With the development of a downward trend, resistance levels represent a place for conservative selling in the direction of the current trend. Recall that the basic rule is to sell on resistance and buy near the support area. Therefore, if the trend goes down, then a correction occurs, after which prices test resistance. In this case, the buyers' strength runs out and there is a decline in the direction of the current trend.
❗️The ability to correctly draw support and resistance levels is one of the basic skills that every trader should have. Levels are also the basis for trading strategies and the right risk-to-profit ratio.
❤️ Please, support our work with like & comment! ❤️

How To Set Stop Losses And Take Profits using EMA StrategyWait for price to break and close below a level. In this example, price closed below support level and turned resistance. Next, wait for price to retest level as new resistance. The retest in this example formed a candlestick that created a wick which protruded through Horizontal Resistance Level, EMA 20 Resistance Level, and Diagonal Trend Resistance Level.
For short trade opportunity, set stop loss above EMA 20 Price Level and Rejection Candlestick High Price. Set take profit at previous swing low.

A Classic Megaphone Pattern..!What Is a Broadening Formation?
A broadening formation is a price chart pattern identified by technical analysts. It is characterized by increasing price volatility and diagrammed as two diverging trend lines, one rising and one falling. It usually occurs after a significant rise, or fall, in the action of security prices. It is identified on a chart by a series of higher pivot highs and lower pivot lows. The chart below shows an example of a classic broadening formation.
Broadening formations occur when a market is experiencing heightened disagreement among investors over the appropriate price of a security over a short period of time. Buyers become increasingly willing to buy at higher prices, while sellers find even more motivation to take profits.
Broadening formations may also occur during earnings season when companies may report differing quarterly financial results that can cause bouts of optimism or pessimism.
These formations are relatively rare during normal market conditions over the long term since most markets tend to trend in one direction or another over time.
Reference article:
www.investopedia.com

Sea Ltd stock analysis w/ boxes and Volume ProfileHi everyone,
This time I am analyzing NYSE:SE stock movement using volume profile besides my usual boxes setup.
NYSE:SE stock price has shown very persistent up-trend strenght for the past year.
When we have the equity soaring up like NYSE:SE does, it is helpful to use Volume Profile to see a bigger picture.
I added three volume profiles for different timeframes: 9 months, 5 months and 2 months.
What does it show us?
As we can see in the past 9 months the biggest trading volume occured around 273 level. That is where our long-term POC is.
However, a decent volume profile started developing from 308 level and above.
For the last 4 months the highest volume has been seen at 323 level. Both 2 and 4 month profiles have universal volume distribution with same POC level.
That means that higher price level has been accepted and stock is consolidated on a higher time-frame.
What now?
As volume profile is dynamic, I expect long-term POC to migrate to 320 level.
However, for that to happen we will need to see a lot of volume at 320, which is 7% lower than the current price.
AND that would be happening at the uptrend support line, which is dangerous.
IF that is broken, we could see a return to 273 POC to repair long-term profile structure.
IF we continue higher from here, we would get unevenely distributed profile, which could be bad in the long-run.
Let me know what you think of NYSE:SE movement and if it is sustainable.
Trade wisely and good luck!
-----------------------------------------------------------------------------------------------------------------
Disclaimer!!!
This is not financial advise.

Technical Analysis. HOW to identify trend,support and resistance📊Technical analysis
Technical analysis is a way to predict the future price movement according to the price chart. The price takes everything into account - this is the main idea of technical analysis . This idea means that we only need to see the price chart to find out where it will go in the future.
The main tools of technical analysis are trend lines , support and resistance lines. So how do you find them on the chart?
📈Downtrend and Uptrend📉
The price is always in motion and when the price shows each new high below the previous one and each new low below the previous one - we say that there is a downtrend now and to make it clearly visible, analysts connect the highs and lows with lines - this is how the downtrend lines are drawn.
To identify an uptrend, the same idea is used, only in a different direction - every time the price forms new highs above the previous ones and new lows above the previous ones, we say that there is an uptrend now.
➖Support and resistance➖
Combining the highs and lows, technical analysts noticed that the price is facing resistance on the one hand and support on the other. These zones prevent the price from going higher or lower, depending on the trend. It is very important to see these zones, because, as a rule, trade is conducted from them.
Also, there are frequent moments when support, after its penetration, becomes resistance.
❗️Remember❗️
It is important to remember that the trend, resistance and support lines are just zones and the price sometimes goes beyond the lines, but then comes back. The price will make false breakouts of resistance or support from time to time. This is normal and it should always be remembered.
It is important that the price rebounds from these zones at least twice, so that there are reasons to draw lines and identify the trend.
🚀Profitable Result🚀
Thanks to these simple methods of technical analysis , a trader can easily determine the trend and avoid stupid money losses, the method will also help in the correct setting of stop orders, which will make your trading more accurate and more profitable.
Trend is your friend, be able to find it.

Smart Money (Volume Spread Analysis) Works In Forex!!!Trading in the shadow of Smart Money. Learn to trade in the same direction. If you are going to play it You better understand it. The Masters & Teachers of the Wyckoff Method & Volume Spread Analysis: Tom Williams and Richard Wyckoff. If you put on your charts just daily charts with the On Balance Volume indicator only (or Tick volume) - might change how you look at and trade Forex. The chart never lies!!!
The “Smart Money”
Trade Large Enough Size To Actually Affect the Price Movement of the Instrument Being Traded and Can Change the Trend of Price But They CANNOT Hide Their Footprints on a Chart When You Learn VOLUME SPREAD ANALYSIS
What Is Volume Spread Analysis?
Most traders are aware of the two widely known approaches used to analyze a market- fundamental analysis and technical analysis.Volume Spread Analysis, however, is a third approach to analyzing a market. It combines the best of both fundamental and technical analysis into a singular approach that answers both questions of 'why' and 'when' simultaneously.Smart Money buy or sell they cannot hide their volume footprint (although they try!!)
At it’s core, Volume Spread Analysis or VSA is a methodology based on the original works and teachings of Richard D Wyckoff, a trader in the early
1900’s. The methodology seeks to establish the “cause” of price movement on a chart. The “cause” is simply the imbalance of supply and demand as the
market trades, resulting in strength or weakness in the market being charted. For the correct analysis of volume, you need to understand that the recorded volume contains only half the knowledge required for a correct analysis. The other half of the knowledge is found when observing the spread (or range) of the price bar and the closing price on that bar. Volume indicates the amount of activity on the price bar and the spread or range of the bar shows what the price actually did, and most importantly where the price finally closed. FYI: Please you tube and/or google VSA more- this will simplify Forex trading.
How Can Volume Spread Analysis Identify These Moves?
Volume = Activity. Interested in volume because it tells consensus of opinion among “Smart Money” Spread and Close in Relation to the background Confirm

Simple Forex (Support & Resistance) #1Support and Resistance
Support occurs when falling prices stop, change direction, and begin to rise. Support is often viewed as a “floor” which is supporting, or holding up, prices.
Resistance is a price level where rising prices stop, change direction, and begin to fall. Resistance is often viewed as a “ceiling” keeping prices from rising higher. If price breaks support or resistance, the price often continues to the next level of support or resistance. Support and resistance levels are not always exact; they are usually a zone covering a small range of prices so levels can be breached, or pierced, without necessarily being broken. As a result, support/resistance levels help identify possible points where price may change directions.
Major vs. Minor Resistance/Support
Minor resistance or support temporarily delays rising or falling prices within a larger market trend while major resistance or support altogether stops either rising or falling prices and larger market trend changes direction. Minor price resistance/support is an artificial horizontal line representing an area, which previously served as price support or resistance, and has now transformed to the other. If price was previously a support level, it is now a resistance level.
Trade the “Bounce”
Buy when the price falls towards support.
Sell when the price rises towards resistance.
Trade the “Break”
Buy when the price breaks up through resistance.
Sell when the price breaks down through support.


How To Enter A Pullback In A Trend
Enter when these confluence factors are present. There is a Trend, Level, and Signal.
Trend:
Up
Confluence Factors at the Support Resistance Level:
Close Price 96.31
EMA 10 Close Price 96.24
50% Fibonacci Retracement Price 96.15
Horizontal Support Price 95.99
EMA 20 Close Price 95.31
Signal:
Rejection Candlestick

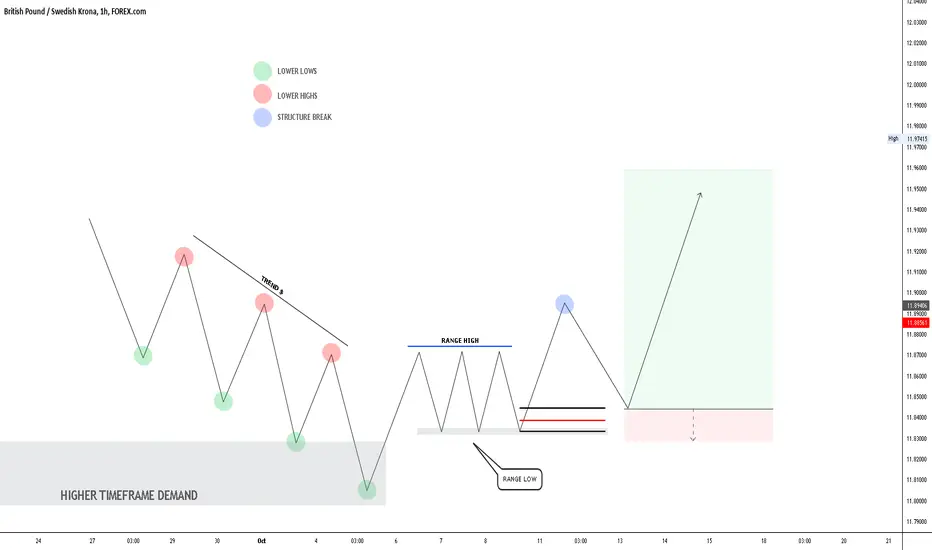
What is a RANGE?Hello Traders,
Here is the most simple & easy explanation about a Range.
In this Lesson I will Show you how to Identify & Trade a RANGE!
These patterns are seen daily in Stocks, Forex and different markets across the Globe.
I hope you will find this information educational & informative.
Your support is appreciated with a follow, like & Comment
Lets dive Right Into it!!
What Is a Range?
Range refers to the difference between the low and high pricesover a specific time period. Range defines the difference between the highest and lowest prices traded for a defined period, such as 4H, day, Week & month. The range is marked on charts, for a single trading period, as the high and low points on a candlestick or bar.
The top of the trading range often provides price resistance, while the bottom of the trading range typically offers price support.
Understanding Trading Ranges
When the Market breaks through or falls below its trading range, it usually means there is momentum (positive or negative) building. A breakout occurs when the price of the Market breaks above a trading range, while a breakdown happens when the price falls below a trading range. Typically, breakouts and breakdowns are more reliable when they are accompanied by a large volume, which suggests widespread participation by traders and investors.
Many traders look at the duration of a trading range. Large trending moves often follow extended range-bound periods. Day traders frequently use the trading range of the first half-hour of the trading session as a reference point for their intraday strategies. For example, a trader might buy a stock if it breaks above its opening trading range.
Ranges and Volatility
Since price volatility is seen as equivalent to risk, a Markets trading range is a good indicator of relative riskiness.
A conservative Trader prefers a Market with smaller price fluctuations compared to Market that are susceptible to significant gyrations. Such an trader may prefer to Trade in more stable Market rather than in more unstable Market.
Trading Range Strategies
Range-bound trading is a trading strategy that seeks to identify and capitalize on a Market trading within price channels. After finding major support and resistance levels and connecting them with horizontal trendlines, a trader can buy a at the lower trendline support (bottom of the channel) and sell it at the upper trendline resistance (top of the channel).
Support and Resistance
If the Market is in a well-established trading range, traders can buy when the price approaches its support and sell when it reaches the level of resistance. Technical indicators, such as the relative strength index (RSI), stochastic oscillator, and the commodity channel index (CCI), can be used to confirm overbought and oversold conditions when price oscillates within a trading range.
For example, a trader could enter a long position when the price is trading at support, and the RSI gives an oversold reading below 30. Alternatively, the trader may decide to open a short position when the RSI moves into overbought territory above 70. A stop-loss order should be placed just outside of the trading range to minimize risk.
Breakouts and Breakdowns
Traders can enter in the direction of a breakout or breakdown from a trading range. To confirm the move is valid, traders should use price action & Structure Break.
For instance, there should be a significant increase in volume on the initial breakout or breakdown as well as several closes outside the trading range ( Structure Break). Instead of chasing the price, traders may want to wait for a retracement / Correction before entering a trade. For example, a buy limit order could be placed just above the top of the trading range, which now acts as a support level.
Thanks for Reading this article, I hope that it was informative and educational As always, If you have any questions / Comment or Concern Please feel free to leave them below.
Thanks to @TradingView for this lovely platform to educate and grow together :)
Hope to see you in the next Educational Post!
Global Fx Education
The Power Of Outside Bar Or Outside Day (Engulfing)Outside Bar/Outside Day (Engulfing): Rules (chart example is a bullish setup)
1) This bullish outside bar/outside day or engulfing candle means new buy or bullish money is coming into Forex pair
2) Price action encompassed the high and lower of previous days price action (chart: Fridays)
3) This candle happened on a Monday- mostly lowest liquidity and volume of the week
4) Next three days (Tues, Weds and Thurs) - gave you possible entries into this future bullish move
5) This Engulfing or outside bar/outside day pattern would have gave you 350 pips (profit/target) with a 100 pip stop loss or 1: 3.5 risk/reward setup.
6) This engulfing or outside bar/outside day pattern broke the price action (critical price level) of 120.000 on chart
This pattern is more reliable on hour, 4 hour or daily- but can be used on lower time frames of lower then hourly IF you see this at resistance and support, price action level of a round number, fib ret of 50% to 61.8%, etc... more confluences at one price and time would put the probability of profit on your side of trade.
Adjust risk management related to time frame you are trading on and ATR of the pair, this will keep 1% to 2% risk per trade the same.
