ETHBTC - A simple approachShowing support is greatly appreciated and keeps up the motivation in continuous ideas and education for the community.
Observe: 0.041895, 0.045950
Two prices that indicate structure, we can now quickly identify that both prices have been important in a direction, volume and liquidity change, thus giving us key identifiers we can label for reference when we analyze a chart.
You can use the "Horizontal Line" tool to analysis almost any security across multiple time frames, it's use is widely forgotten and you can't simplify a chart any less...
Horizontal Line Tool:
- Mark out important prices
- Help show a position, entry, stop
- Plot important alerts
- Simplify Analysis
If you'd like more quick educational posts like this, show us some support
Support and Resistance

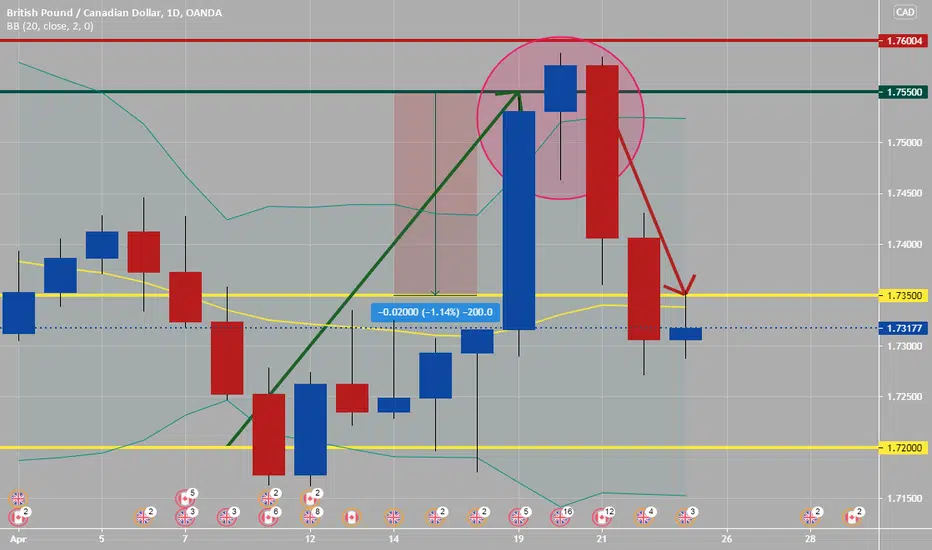
IDF Play - Fading a daily inside barSTATEMENT
This publication aim to explain as detailed as possible the IDF play strategy.
To do so, we will analyse USDCAD chart and the inside bar that was printed on 22-04-2021.
RATIONALE
Why trading the failure of an inside bar? It's commonly known that retail traders will identify an inside bar as a reversal candle. Institutions and big players know how retail traders play these kind of candles and will most likely fade them.
Also, before directly trading this technique, please backtest it through different time period (what could have workd in 2020 might not work anymore in 2021 as it's well known that market behaviour can change) and different currencies (an high strike rate with EURUSD doesn't mean it will work with GPBUSD for example). I would consider it as an edge it win rate is above 60% adn the ratio is in average above 1% ROI.
INSIDE BAR
What's an inside bar? It is a candle in which the high to low range is smaller than the prior candle; i.e., the high is lower than the previous bar's high, and the low is higher than the previous bar's low .
THE PLAY
First of all, we identify an inside bar on the daily time frame:
In this particular trade, our inside bar can also be identified as a Doji candle (another reversal candle), reinforcing the retail trader's sentiment that we are about to witness a trend reversal (meaning that most of them will be placing an order to go long with a stop loss below the wick of the candle).
Additionally, if we check the prior day we notice that price printed an Outside bar (or Engulfing candle), confirming our bias that we are most likely to find opportunities to go short.
Next step is to go down to the hourly time frame and look for a significant leven from which we can short.
So far in below screenshot we have identify a significant support level where price was rejected 6 times. As we would like to find an opportunity to go short, we need to wait for the price to break through this level.
Now, as we have short bias, we need to wait for the price to break through that support level, so we can consider placing an order (sell limit).
With 6 touches on the support level, market is telling us that we have a strong level, having saying that, we won't need any further confluence to look for entry after the breakout.
After breakout is confirmed (1) and there is no an immediate pullback (few candles between breakout and pullback to significant level) we can place our order (in this case, sell limit).
We do not place our stop loss above the latest lower high; we play it safe and place it at 1.25104 (the prior lower high).
Take profit is placed at a weekly level we have identified we do believe can represent a valid target.
THE RESULT

Moving Average/Support/Resistance ExampleHere's a great example on how you can use a moving average to watch for trend reversals and to trigger trades in case you don't like drawing a lot of lines on your chart.
In this example, when the 50 Moving Average (MA) crossed the 200MA in May 2019, it signaled a bearish reversal (known as a bearish cross). Later, in November 2020, it crossed again signaling a bullish cross and an uptrend. If you had shorted the stock, you would've gotten around 60% gain.
Now, if I was in this trade right now, it's near a recent high and just poked over a global (weekly chart) resistance line, so if it fails to stay on top of that, instead of turning into support for a continued uptrend, it may stay as a resistance level and begin a downtrend. Watch for consolidation at it's current level and be ready to change your strategy.

Lesson Learned on Trend ReversalsAs I get further in my trading course, I'm going back and identifying where I did good and what I messed up. Here's one lesson: get out when you have a confirmed trend reversal! I kept hoping it would be a short one, but you know what assuming does... As soon as the trend line turned into resistance, that's a confirmed reversal and where I should have sold my call at a loss but still kept some of the money instead of watching it reduce to $0.

How to Take Advantage of Both Market Directions?Today we will talk about a very common situation that occurs in the vast majority of traders (if not all), especially when we have just started to get into this bussiness.
There is a consistent struggle between convictions, ego, and market views or analysis. This generates that we try to see in our analysis what we want to happen, or what we need to happen, and ultimately this the only thing that generates are psychological issues on the trader.
The best way to remain calm and be able to trade in a cold and consistent way is to plan in advance all the situations that may occur in the scenario we are analyzing, and how we would act in front of them. In this way, we do not allow ambiguities and we will only take positions if what we are waiting for happens. And, covering both directions, we will not feel that we are missing something if the movement is the opposite of what we expect (as it would happen in case of analyzing only in one direction).
In this case we will analyze AUD/JPY to show you how we carry out this analysis:
🔸First, we are going to detail our vision of the daily graph that is the one shown in the publication.
🔸As we can see, the price is in a clear uptrend, and when faced with the Resistance zone it began to consolidate for several weeks.
🔸From there, we didn't see a clear direction. When we detect that there is no type of trend or clear behavior, we stay out of the market and wait for an opportunity to happen where we can establish a clear horizon.
🔸What we propose to trade this pair is that there is a brekaout. It can be in a bullish or bearish direction. In case of being bullish, it must be from the Resistance zone and in case it is bearish it must be from the trend line.
🔸We are going to decrease the timeframe to show exactly what we expect:
🔸In this image we see the 4H chart.
🔸Basically what we detail is that we expect a break and then a retest / corrective structure. This is because it is a security add-on to avoid potential fakeouts (the trade can fail anyway, of course).
🔸Once we see the retest, we will have a new swing or structure to be able to position our entry and stop loss safely, with a favorable risk-benefit ratio.
🔸The targets are: Resistance zone in case of bullish breakout, and Support zone in case of bullish breakout.

How To Trail Stop Loss Effectively | Capture All day's ActionMaximise your Day Trading Profits 5X | Apply this trade management system to hold trades all day without much effort
In this video I'm going to share with you a trade management idea which would allow you to trade and hold the trade from the start to the end of the day trading session.
The Chart I'm using is US30 / DOW30. The Time frame for day trading would be the five minute chart.
The idea is to make entries on the 5 minute chart and then use a few swings to add on.
This can become part of your Trade Plan and you can apply to any time frame or symbol of your choice. It's a great way to maximise your profits using nothing but the data provided by the market itself.
Price Action is surely The King!!! I bow....

Candlestick Patterns (Trader's Should Know) Three Black CrowsThe three black crows candle formation does not happen very frequently in Forex trading, but when it does occur swing traders should be very alert to the crow’s caw.
The candlestick’s metaphor is three crows sitting in a tall tree. On the day the first black crow makes its appearance, formation is most predictive if the first “crow” or dark candlestick closes below the previous candle’s real body. Two more long-bodied consecutive down days then ensue. On each of these days, it appears as if the stock wants to regain its former strength, as the Forex pair opens higher than the close on the previous day.
By the end of each session, however, the sellers regain control and the Forex pair drops to a new closing low. This happens when a bullish trend has been in effect and liquidity or bearish trading is in control for three days, but afterwards the major bullish trends restarts up in the major trend direction.

Candlestick Patterns (Every Trader Should Know) Hangman CandleThe hangman candle, so named because it looks like a person who has been executed with legs swinging beneath, always occurs after an extended uptrend. The hangman occurs because traders, seeing a sell-off in the shares, rush in to grab the stock a bargain price.
In order for the Hanging Man signal to be valid, the following conditions must exist:
• The Forex pair must have been in a definite uptrend before this signal occurs. This can be visually seen on the chart.
• The lower shadow must be at least twice the size of the body.
• The day after the Hanging Man is formed, one should witness continued selling.
• There should be no upper shadow or a very small upper shadow. The color of the body does not matter, but a red body would be more positive than a blue or green body.
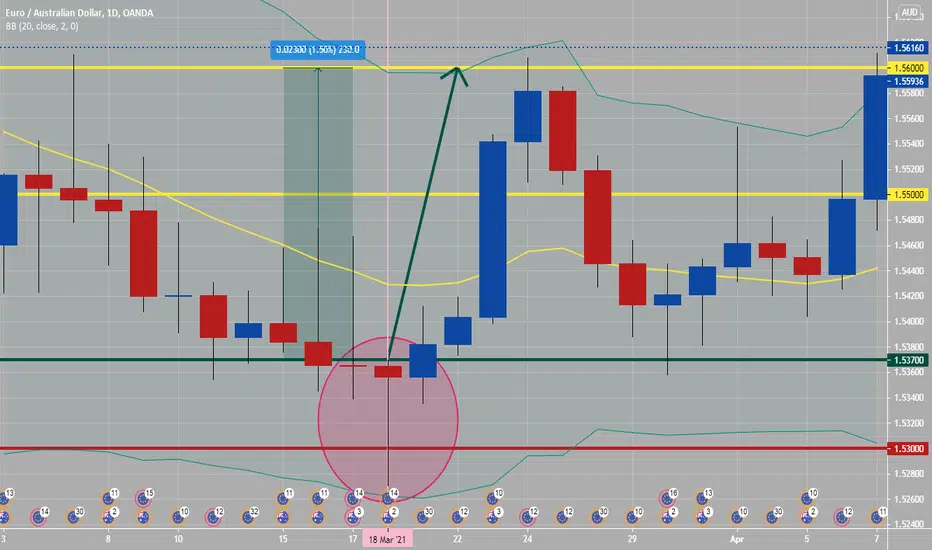
Candlestick Patterns (Every Trader Should Know) Dragonfly DojiA “Dragonfly” doji depicts a day on which prices opened high, sold off, and then returned to the opening price. Dragonflies are fairly infrequent. When they do occur, however, they often resolve bullishly (provided the Forex pair is not already overbought as show by Bollinger bands and indicators such as stochastic).
See daily attached chart of dragon fly candle, which was oversold and located at the lower band of Bollinger bands and at round numbers from 1.53000 to 1.53700. This is a great candlestick to plan for price action to continue to be bullish from, especially if this happened early in week. Noted dragonfly doji happened on a Thursday and lasted for around five days.
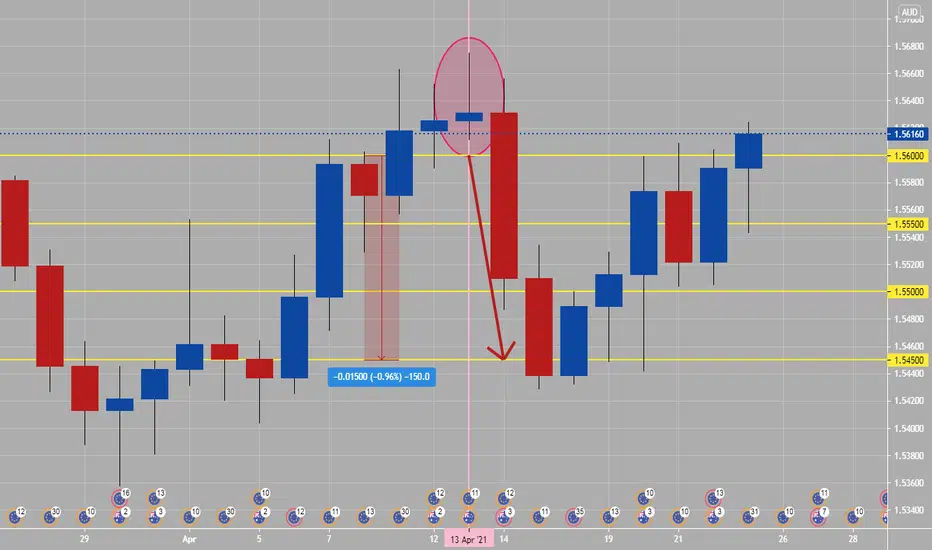
Candlestick Patterns (Every Trader Should Know) Long Legged DojiA “long-legged” doji is a far more dramatic candle. It says that prices moved far higher on the day, but then profit taking kicked in.
Typically, a very large upper shadow is left. A close below the midpoint of the candle shows a lot of weakness.
Here’s an example of a long-legged doji on attached chart (inside of oval circle). Daily candlesticks and patterns are more important then lower time frame ones, related to having one whole days of price action inside of them.
Monday and Tuesday daily candlesticks mostly will set high or low of the week, which rest of week trend will break out or come out of. The noted long legged doji occurred on a Tuesday, then rest of week was sell or bearish.
Creating Lines with ShortcutsCreating lines on a chart is one of the most fundamental methods of charting when performing technical analysis. Being able to create these effectively and quickly is a very useful skill to have.
Horizontal, Vertical and Cross lines can all be found on the drawings panel to the left of the chart in the subgroup “Trend Line Tools”. These tools can be added by selecting them from the subgroup and then placing them on the chart.
However, a more efficient method to creating these lines is to utilize the hotkey functions:
Horizontal Line Shortcut:
- Alt+H (PC), or Option+H (MAC)
Vertical Line Hotkey:
- Alt+V (PC), or Option+V (MAC)
Cross Line Hotkey:
- Alt+C (PC), or Option+C (MAC)
Becoming more efficient in your ability to draw lines on your chart will allow for quicker identification of areas of support/resistance and times on your chart.
Be sure to visit our help center to learn more about these tools!
More information on the Horizontal Line tool:
www.tradingview.com
More information on the Vertical Line tool:
www.tradingview.com
More information on the Cross Line tool:
www.tradingview.com

Optimized strategy is here + Midweek outlook! part 2Continuation of part 1.. final part.
Thank you for watching, enjoy!

Optimized strategy is here + Midweek outlook! part 1 Hello, in this video I go over the optimized strategy and explain my thought process when entering a trade with this smooth like butter method of trading haha.
If you're planning on trading with my strategy, feel free to ask for help and listen closely. There are key details in this video, take notes if you have to, I note in the video what is important and what is minor knowledge! thank you for watching.. please refer to part 2!

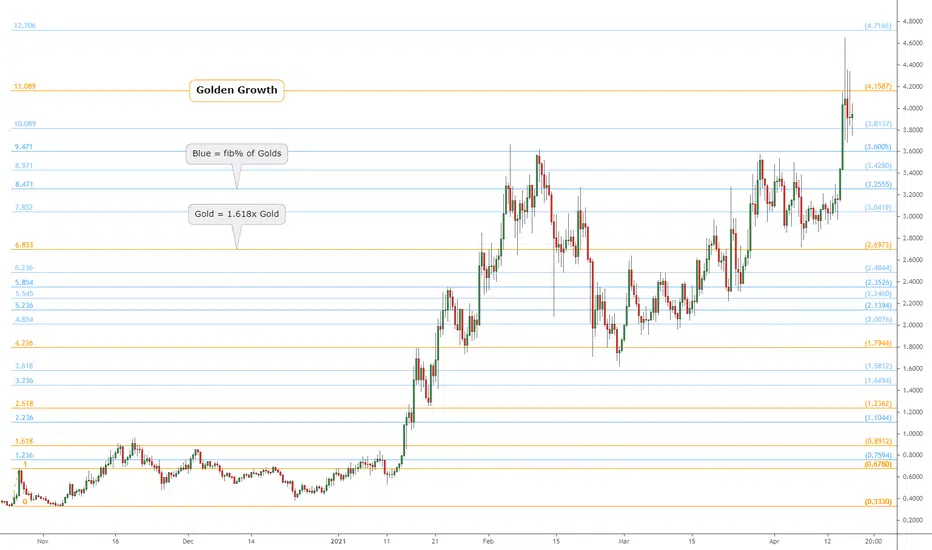
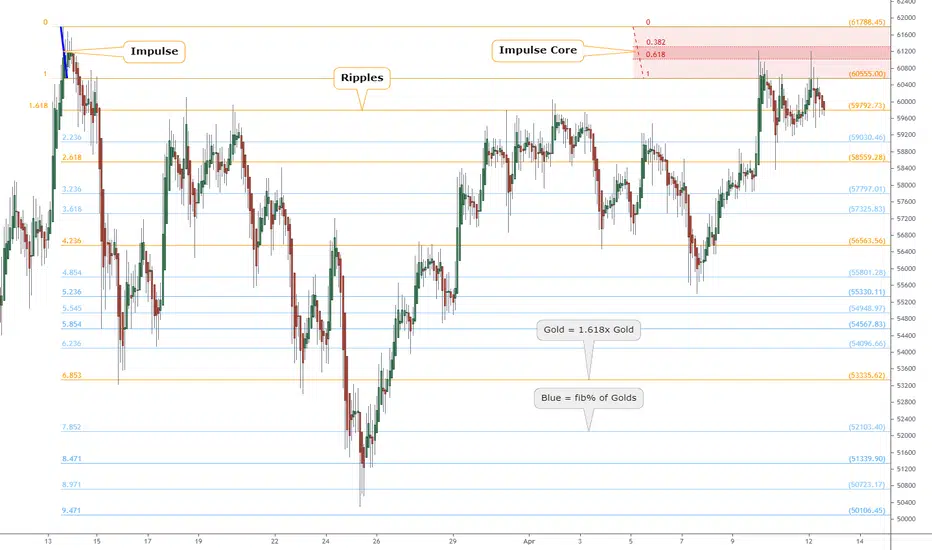
Pulse of an Asset via Fibonacci: CRV Golden Growth but Topped?This Chart is a an example of a "Golden" Fib series.
This Concept is from "Chapter 5" of my going "book".
This Religion is from the church of the "Golden Ratio".
Often, a Golden level marks the End of a Wave.
It is common to overshoot, but then reject from it.
Return to Gold fib and Reject a sign of having topped.
.
I do not use "Fibs" in the "traditional" manner (retracements).
I use Fibs to plot "Ripples" (extensions) created by "Impulses".
Then look for "Confluences" to map the "interference Pattern".
My TV collection of ideas detailing the Concepts:
Chapter 1: Introduction and numerous Examples
Chapter 2: Detailed views and Wave Analysis
Chapter 3: The Dreaded 9.618: Murderer of Moves
Chapter 4: Impulse Redux: Return to Birth place
Chapter 5: Golden Growth: Parabolic Expansions <= Current Example
Chapter 6: Give me a ping Vasili: 'one' Ping only
.
Ichimoku Cloud (TK Cross)On ichimoku Cloud hourly or higher charts- try taking everything off except Kijun-Sen (black line or/base line) and Tenkan-Sen (gold line or/conversion line).
You are left with a naked chart with only two lines on them, see my hourly chart of GBPUAD. You see three possible trades where the Tenkan-Sen and Kijun-Sen cross or TK Cross. This is where you want to enter any new trades, because you are taking advantage of trend, momentum, factual etc...
Last week showed three TK cross setups: 1st trade: bullish- 80 pips, 2nd trade: bearish-300 pips and 3rd trade: bullish 120 pips. With right stop loss and risk management you could have made some pips on these three trades. Good luck in Forex and Life.


fibonacci extensions / retracements - how to and where to applyFibonacci tools are in general a method of technical analysis for determining probable support and resistance levels calculated using ratios (23.6%, 38.2%, 61.8%, and 78.6%) that are derived from Fibonacci sequence (0, 1, 1, 2, 3, 5, 8, 13, 21, …). Fibonacci levels are presented in variety of forums, such as horizontal lines, vertical lines, trend channels , fans , arcs, circles, even a spiral. Fibonacci levels also arise in other ways within technical analysis, for example, one of the best known and widely used Elliott Wave theory
In this article we will have a closer look to Fibonacci Extensions and Fibonacci Retracements
Fibonacci Retracement and Fibonacci Extension levels are in the form of horizontal lines and are calculated in almost similar manner with slight difference. Even tough they look like similar to each other they are quite different and serve for different purpose.
👉 Fibonacci retracement levels indicate how deep a retracement could be, that is, aims to measure the pullbacks within a trend
👉 Fibonacci extension levels indicate how far the next price wave could move following a pullback, that is, aims to measure the impulse waves in the direction of the trend
How to apply Fibonacci Retracement and Fibonacci Extension
These levels should not be relied on exclusively,Reversals can be confirmed with candlesticks, momentum indicators, volume or chart patterns.
Here are the links of educational posts and indicator versions of the Fibonacci Tools that I made, you are kindly invited to check
Auto Fib Channels, besides Auto Fib Channels this study include Auto Fib Retracement, Auto Fib Extension and Auto ZigZag indicator
Auto Pitchfork, is advised due to its similarities with Auto Fib Channels and also it includes Auto Fib Retracement and Auto ZigZag indicator
Auto Fib Speed and Resistance Fans, is an important tool to identify probable support and resistance and especially a powerful tool to identify reversals and retracement levels. The study presents an alternative approach of drawing the fans which enables a visualization quite similar to Gann Box. Auto Fib Retracement and Auto ZigZag indicator is also available
Related educational posts that presents a quick guide of the drawing tools as well as introductions for their automatic indicator versions
how to apply pitchfork and auto pitchfork study :
how to apply fibonacci fans and auto FibFans study :
how to apply fib channels and auto fib channels study :

Pulse of an Asset via Fibonacci: BTC testing ATH Impulse Core"Impulse" is a surge that creates "Ripples", like a pebble into water.
"Impulse Redux" is returning of wave to the original source of energy.
"Impulse Core" is the zone of maximum energy, in the Golden Pocket.
Are the sellers still there? Enough to absorb the buying power?
Reaction at Impulse is worth observing closely to gauge energy.
Rejection is expected on at least first approach if not several.
Part of my ongoing series to collect examples of my Methodology : (click links below)
Chapter 1: Introduction and numerous Examples
Chapter 2: Detailed views and Wave Analysis
Chapter 3: The Dreaded 9.618: Murderer of Moves
Chapter 4: Impulse Redux: Return to Birth place <= Current Example
Chapter 5: Golden Growth: Parabolic Expansions
Chapter 6: Give me a ping Vasili: 'one' Ping only
.
.
Ordered Chaos
every Wave is born from Impulse,
like a Pebble into Water.
every Pebble bears its own Ripples,
gilded of Ratio Golden.
every Ripple behaves as its forerunner,
setting the Pulse.
each line Gains its Gravity .
each line Tried and Tested.
each line Poised to Reflect.
every Asset Class behaves this way.
every Time Frame displays its ripples.
every Brain Chord rings these rhythms.
He who Understands will be Humble.
He who Grasps will observe the Order.
He who Ignores will behold only Chaos.
Ordered Chaos
.
.
.
want to Learn a little More?
can you Spend a few Moments?
click the Links under Related.
Combination Structures TripleHello guys
This is triple combination structures. We have three ABC waves and WXYXZ Wave.
This is seen in consolidation markets.
Follow me for more tutorials.
Cheers :)


SXP BTC Reversal analysis & tutorialSome tips to identify a reversal, minimise risk when choosing where to open a position and identify targets to close the position with less risk and more profit.

MID-DAY Video {Bubbles Dector} How to use it Everything should be self-explanatory in the video, thanks for watching.
Make sure to check out the others for the full strategy!

Trading the RangeBased on months of learning from George1Trader on Twitter, I just wanted to pop this tutorial up to demonstrate what I would define as a great example of BTC trading inside a range.
These ranges can been found on any timeframe, but this one is on High Time Frame to demonstrate why I am currently bullish on BTC. The theory is simple:
1. A range is formed after a large move up or down
2. “Sweeps” of range high/low should be deemed as a liquidity hunt and usually means a move in the opposite direction
3. Locate if there are any consolidations from previous PA outside of the range....this is where liquidity will be resting
4. Dump or pump into consolidation block often demonstrates a major liquidity hunt designed to trap breakout traders
5. Assuming the dump/pump into consolidation block leads to price re-entering the range: trade it!
Important to note, try to avoid the temptation to trade during the deviation....trade once price re-enters the range. Thats your confirmation! Stops would then sit below the deviation, with take profits at range high/low. I usually have a 50% TP set at range high/low in case price decides to continue its move....which is common.
Hope you enjoy!
