AXS, how to trade using KEY LEVELS? FREE education!Key Level. How can a common tool help you to earn more? Let's take Axie Infinity (AXS) as an example!
A key level is a local minimum or maximum. It can be clearly marked after a BIG price movement up or down (points of extremum). Key levels are often the price of 1, 10, 50, 100 dollars, because many traders pay attention to this numbers.
On the chart we have marked two key levels:
1. lower (for longs) - $44.68
2. upper (for shorts) - $72
When to open a trade:
1. on a test of the key level as support or resistance;
2. on false breakdown of the level.
IMPORTANT: IN BOTH CASES, VOLUMES MUST INCREASE! It`s an indicator that a big player opens a trade too!
Using the KEY LEVELS you could earn: +62%, +62%, +38%. Risk to reward for these trades from 1:7 to 1:14(!). It's a good statistic, right?
If you still have questions how to use the key level and what tools can be used to increase your profitability - write in the comments or to the DM.
Friends, push the like button, write a comment, and share with your mates - that would be the best THANK YOU.
P.S. I personally will open entry if the price will show it according to my strategy.
Always make your analysis before a trade.
Support and Resistance

messing around with circles & fibsMainly experimental 👽
Using 20/07 swing low and daily PA prior to that date, start determining the circles levels (roughly 9 11 18 24 28 32 34 38 50 54 56 59 61, totally eyeballed that)
The goal is to see if this circles are still relevant on the other half !
Let's wait couple of years and see how it evolves.

Sneak peak! Sneak peak at our current project. A quick snippet showing how price levels can be caught using our pivot tool to inform trade ideas based on Support/Resistance and Supply/Demand.
The tool is currently in a preliminary form, but we intend to optimise the level output to create a real eye view of the price action. Our goal is to mimic the price levels a trader would naturally spot and use for their trading, while added an element of sophistication to line filtering that is only possible using code.

How to identify a bullish / bearish trend and a trend change:Hi everyone!
I didn't really find anything that interests me in today's EU price action. So instead, I'm posting a tutorial on how to correctly identify a trend. This is very important for all traders as we should ideally be trading with the trend. There's actually this saying that goes, "trend is your friend" I'm sure most of you, if not everyone, already knows that trading with the trend would give you a higher probability in your set ups.
I hope that this short tutorial will help you in some ways in the future. Please do let me know in the comments below what you think and something you might want to add. Thank you and I appreciate it! ♡

BTCvsS&P500! Is volatility the key to SUCCESS?Bitcoin versus the S&P500! Why is volatility so important?
Volatility is always an opportunity for the trader and investor. But what is it?
Volatility is the ability of price to change in % over a period of time. Buying Bitcoin and the S&P500 at the same time close to the lows you would earn +$400 and the S&P500 +$130. The same with short positions. Volatility helps a trader to earn more!
The price of Bitcoin has been very dependent on the S&P500 lately. Bitcoin is down by 52% from its ATH and up by 47%. The S&P500 is down by 14.6% and up by 13%.
Why such different changes in price and how to make money on it? It's all very simple! The total value (capitalization) of the S&P500 is about $40 trillion. The value of all Bitcoins is about $0.9 trillion. Let's imagine that the S&P500 and Bitcoin gained +1 trillion dollars to their value. The S&P500 price would rise by +2.4% ($41 billion) and Bitcoin by more than 100% ($1.9 billion).
I have been in trading for a very long time and I can tell you that your INCOME depend on your skills. If you have a trading strategy, use trading tools, money management and risk management, you can earn more.
Friends, if you still have questions, leave a comment or write to DM!
Friends, press the "like" button and share with your friends - it will be the best THANK YOU.
P.S. Personally, I open an entry if the price shows it according to my strategy.
Always do your analysis before making a trade.

How I Trade Support and ResistanceIn this video made for Best of Us Investors I talk about my most fundamental trading component; trading and investing off Support and Resistance Levels. I also talk about how I combine this with my other fundamental component of 50% Retracement Levels. We look at live examples of NYSE:ZIM and NYSE:KO and look back in history for case studies of NASDAQ:AAPL , NASDAQ:AMZN , and NASDAQ:TSLA to see just how powerful this tool can be for high probability, low drawdown, profitable trades and investment entries!

Bjorgum Key Levels - TradeThis script generates signals based on the work from Bjorgum Key Levels algorithm.
For more information on how these signals generated, please refer to "Bjorgum Key Levels" pine script documentation.

BASIC SUPPORT AND RESISTANCESupport and Resistance is one of the most common tools when trading.
Learning where support and resistance is situated on a chart is the first step to your investing/trading strategy.
Knowing this basic skill can determine whether you buy/long or sell/short or help in your further analysis.
A support level is an area where price has come down to and has respected at least 3 times and then pushed higher. Bounced some might say.
Resistance is a level where price has come up and has been rejected at least 3 times previously.
The higher the time frame the stronger these support and resistance levels will be, I tend to use weekly, daily and the 4 hourly.
When support is broken it becomes resistance, when resistance is broken it becomes support.
Current price action must always be above support and below resistance to make them valid.
If you are having difficulty finding levels I suggest moving to the line chart to cut out some of the noise (wicks).
There is also support and resistance flip which I will cover another day.

Is SHIB in the ACCUMULATION phase? Identifying the WHALES!Shiba Inu (SHIB) is one of the most popular project of 2021. After the accumulation phase, it rose by about 1000%!
Now the token has dropped by 70% of its ATH and has been consolidating for about 2 months. Could this mean the beginning of a new growth phase?
Accumulation phase is the purchase of cryptocurrency by BIG players to sell higher to the retail investor.
There's not a lot of HYPE around this token right now. Retail traders who have lost 20-50% of their money are starting to sell out in a panic. At this time, the BIG players buy the available tokens from the market to sell higher to new traders who will come on the next HYPE. The same situation as it was in 2021!
It is important to say that if Bitcoin starts its drop, then altcoins will drop too.
Is this really the accumulation phase and we close to RENEW the ATH? We will only know after some time, but we already see the signs of accumulation phase on the chart.
Friends, press the "like" button, write comments and share with your friends - it will be the best THANK YOU.
P.S. Personally, I open an entry if the price shows it according to my strategy.
Always do your analysis before making a trade.

AUDJPY support and resistance zonesSupport and resistance are the next two things that are important for successful trading.
These are some imaginary lines. That is some zones depending on how someone draws them on the graph, which show us where the price has stayed the most.
We noticed in this example that the price was constantly coming back and bouncing back.
When we talk about zones or support and resistance, there are two types:
- Major zones
- Minor zones
Major zones are all zones that are drawn above one one hour time frame. ( Respectively timeframe one h, four h, 1Day, 1Week, 1 Month.)
Minor zones are smaller zones, and they are drawn in less than an hour. (Respectively on timeframe 30M, 15M, 5M.)
The only advice I can give you about this is to "practice makes perfect".
How to recognize zones is just a matter of exercise. The more you practice, the easier it will be for you to recognize them.
The characteristic of how I draw them is that I look for wicks from candles and draw them on them. That is, I draw them on candlesticks which is visible on the graphs.
In this example, we can expect the AUDJPY pair to climb to the resistance zone 99.00-104.00.

3 Bar Inside Bar Trading StrategyBullish Example (Chart)
Learn the 3 bar inside bar strategy or harami bar setup.
Always trade during high liquidity and volume times of the session, which is end of Tokyo to end of London (12 hours).
Look for all patterns to trade at resistant and/or support areas, which are at quarter theory lines on charts (see orange lines on charts). You can you tube or google Quarter Theory, for more information.
This is one of the best strategies to scalp, day trade or longer on 15 minute or on higher time frames.

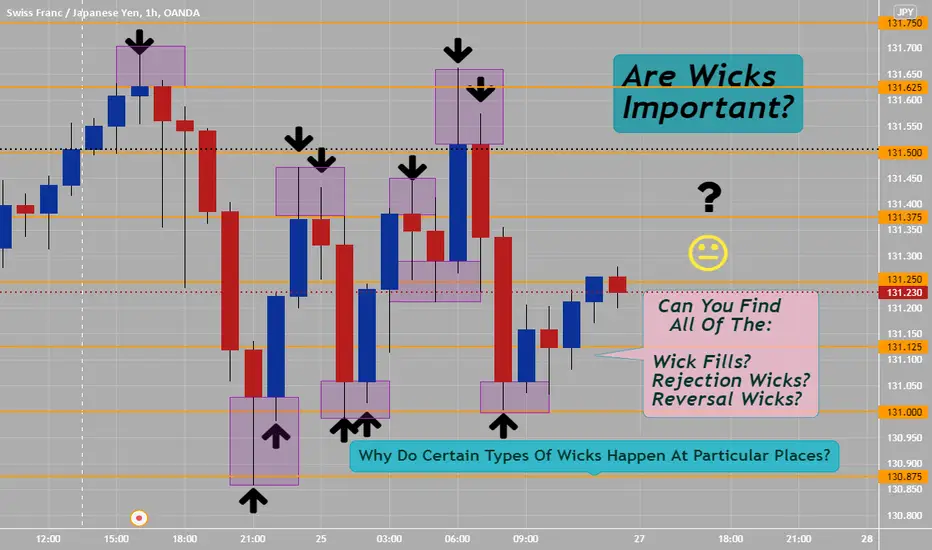
Are Wicks Important? Types Of Wicks: Fill, Rejection & ReversalPlease look at your own charts:
Do you see all of the following?
Wick Fills? These type of wicks happen going with the trend and get filled with further price action on chart.
Rejection Wicks? Mostly happen at key support and resistance zones or key quarter theory psychological numbers, a lot of traders have orders there.
Reversal Wicks? Happen at key areas mostly on 1 hour, 4 hr, daily, weekly and even monthly charts- these are areas with large wicks in past which once price action comes into these areas at key resistance and support areas- will accumulate orders and reverse directions.
See attached 1 hour charts----
How many different types of wicks can you see and/or spot.... you need to see quarter theory psychological numbers in actually real live time when trading Forex. Always start with monthly charts and keep going lower until you are trading with the chart of your choosing. Higher time frames will give you better risk to reward opportunities then under 1 hour...
If you truly understand wicks- you will be a better trader and know if you scalp trade, day trade or position trade when to look for quick wick fill candles to catch some quick pips. These are the easy Forex trades to do, make sure you are trading during high liquidity and volume time periods only.
Is this a good idea to short apple now?AAPL is in a downward trend since January 4th, 2022!'
Although AAPL could go down another 10% in the coming weeks, I believe this is not a good place to short it just before the Quadruple Witch(March 18th).
Education:
If you detect a Downward regression channel try to open a short position in the upper half or at least near the midline..!
The biggest problem with many traders is:
They divide the market to Buy/Sell or Long/Short, but they should know there is "No Trade Zone" as well..!
Best,
Dr . Moshkelgosha M.D
DISCLAIMER
I’m not a certified financial planner/advisor, a certified financial analyst, an economist, a CPA, an accountant, or a lawyer. I’m not a finance professional through formal education. The contents on this site are for informational purposes only and do not constitute financial, accounting, or legal advice. I can’t promise that the information shared on my posts is appropriate for you or anyone else. By using this site, you agree to hold me harmless from any ramifications, financial or otherwise, that occur to you as a result of acting on information found on this site.
* I have a long position.

Longing GRT after Falling Wedge [tutorial] with exampleThis is a Tutorial how to use the falling Wedge pattern as longing condition because its relativ reliable.
The falling Wedge is a reversal pattern which will form during an uptrend, so it will interrupt the prior trend. Which isnt that easy to identify if you dont have any experience.(Tip just use the Indicator from tradingview it will work great and do a lot of work for you ;) )
Another significant feature is the contraction over the elapsing time until mostly continuation of the previous trend, that will be the time we look for confirmation and long this position.
At number 1 you can see the difference between the highest and the lowest point of the wedge which will be the target range of our taking profit after we broke the resistance. The bottum/supportline is the stop lose range.
At number 2 you can see my position based on the numbers from number 1.
number 3 and 4 is just repeated 1 and 2.
if you spend a lot of time infront of your PC you can set the stop lose high so it will become another stop lose and you have garanted profit.
Dont get cocky and set to wild leverages.
This isnt a financally advise!
i dont take responsibilities, so calculate your own risk and do your own research

#Educational #Educational Post For Learning Purpose. How To Draw Order Block. How to Take a Profitable Trade Thank You, Traders, for Your Support Like and Follow.

What really matters in trading! / Pyramid of success in MarketsMany people think that trading is just a technical analysis.
If not! Carefully check the pyramid above and read the description.
If you also have experience with trading success, share it in the comments. Thanks !

80/20 P1The 80/20 Principle is an enormous time-saver. If you spend 10 minutes learning these skills now, it will have an endless return in the future. An example of a great reward: (lifetime saving of time) to risk (5-10 min of reading). The 80/20 Principle is a very effective concept in achieving efficiency. Instead of wasting resources on unimportant tasks, you can focus on core revenue making activities. This principle is one of the essential concepts in modern-day business.
This idea will discusses what the 80/20 Principle means, why it's effective, and how traders can benefit from it. Instead of scanning, I highly recommend reading this entire idea & P2. Information overload is rampant in our modern society. We are not used to focusing on any topic for longer than 30 seconds.
The main point is that the numbers are highly unbalanced. Humans tend to think that each unit of effort, or resource, has (almost) equal importance in achieving success. But the 80/20 Principle clearly explains the numbers are highly skewed. The probability theory explains that it is, “virtually impossible for the 80/20 Principle to occur randomly.”
80/20 PRINCIPLE IN TRADING
Traders can use the 80/20 Principle as well. In fact, there are many ways traders can apply the analysis from the 80/20 Principle. The 80-20 rule not only holds true for the analysis of our P & L account, but also for a wide range of topics.
Number 1: trading performance. Traders can analyze these relationships:
Are the majority of losing trades caused by the same mistake?
Are the majority of losses coming from a few trades?
Are the majority of losses coming from a small number of days?
The same questions can be asked for profits and winning trades as well.
Number 2: individual performance (personal effectiveness). Traders can analyze these relationships:
How much time is spent on each task and how much benefit does it bring?
What are the crucial tasks in my trading that lead to the most results?
What actions are the most beneficial for my results?
Number 3: the market. Traders can analyze these relationships:
80% of the time the market is in the middle of a move (not reversing), whereas 20% of the time the market is forming a top or bottom.
80% of the time the market is not trending, 20% of the time it is trending;
80% of the market moves are noise, 20% of the market moves are an actual signal;
80% of the time the market is in consolidation and 20% of the time it is in an impulse.
Number 4: strategy performance. Traders can analyze these relationships:
Do the majority of the trading opportunities occur at the same points during the strategy?
Are the majority of my wins generated by a minority of the same entry type?
Do the majority of my filters have a very small impact on the performance?
Does a minority of my tools and indicators have the most positive impact on the strategy?
The above questions and ideas are examples. Everyone is highly encouraged to analyze and find connections that benefit them as an individual trader. This is not limited to the above, and many more ideas can be created.
In Trading, it's a fact that most traders trade too much and try to force results by working too hard.
In terms of your trading strategy: Focusing on the above will make you more money - but you'll also reduce the effort you put in. Shift your emphasis to long term trading - and only trade the best signals. By doing this, your workload - and the amount of time you need to spend on your analysis will be reduced.
If you apply the 80 - 20 rule to your trading in the above way, you'll cut the effort you put in. You'll also increase the profits you make - and that's what all traders want! Many people think that the more effort you put in, the better the results you obtain. This is true in many areas of life - but not trading! Here you are paid for being right with your trading signals - that's all.
Also, don't fall for the myth that the more you trade, the better your chance is of having trading success. This is simply not true - because the big trades, with the best ratio of risk to reward don't come around that often.
Focus is the only way anybody can enjoy their tasks, be in the ‘flow’ of things, learn and retain information, and direct their attention to specific, valuable goals.
BINANCE:BTCUSD
👍

Measured Move ToolThis is just a quick tip on creating a measured move tool. If you're like me (having to work things out alone the slow way by trial and error) then you probably messed around with trend lines making a mess of the chart and it always being a faff to work out measured moves, which I use pretty religiously in setting profit targets and goals.
However, no more faffing needed. The Fib Retracement Tool can be re-appropriated as a measured move tool. Simply double click the tool settings and change all of the nonsense measures that come in the pre-sets (I don't use Fib Retracement in my trading). In my adapted Fib Tool I simply change the settings to 0, 0.33, 0.5, 0.66, 1, 2, 3, 4. I also grey out slightly the 0.33 and 0.66. I find 0.33, 0.5 and 0.66 are great for measuring pullbacks.
And that's it. Measured move tool hack complete. Enjoy.

Price Action Trading (Support and Resistance Levels)After price closes above a resistance level, then resistance level becomes support. Next, watch for a price action signal in the form of a pin bar, rejection candlestick, or engulfing bar. Enter at the closing price of the candlestick.
H1
H2
H3

TYPES OF FIBONACCI's & WHEN TO USE THEM 📐📏
Hey traders,
In this article we will discuss two very popular Fibonacci tools:
Fibonacci retracement and extension.
1️⃣Fib.Retracement tool is applied to identify a completion point of a retracement leg within an impulse.
As you know price action has a zig-zag form.
For example, in a bullish trend, the price tends to set a higher high then retrace and set a higher low before going to the next highs.
In a bearish trend, the price tends to set a lower low and retrace to a lower high.
With retracement levels, we are trying to spot the point from where the next impulse in a bullish or bearish trend will initiate based on the last impulse leg.
Fib.levels that we will apply are:
✔️0.382
✔️0.5
✔️0.618
✔️0.786
The retracement levels will be drawn based on XA impulse leg.
From its low to high if the impulse is bullish
and from its high to low if the impulse is bearish.
From one of the above-mentioned levels, a trend-following movement will be expected.
One should apply different techniques to confirm the strength of one of these levels.
2️⃣Fib.Extension tool is applied to identify a completion point of the impulse.
In a bearish trend, the extension levels will indicate a potential level of the next lower low based on the length of the last bearish impulse.
Fib.levels that we will apply are:
✔️1.272
✔️1.414
✔️1.618
The extension levels will be drawn based on XA impulse leg.
From its low to high if the impulse is bullish
and from its high to low if the impulse is bearish.
From one of the above-mentioned levels, a retracement leg will initiate.
One should apply different techniques to confirm the strength of one of these levels.
Of course other ways of application Fib.Retracement and Extension levels exist. However, these two are the most common.
How do you use these levels?
❤️Please, support this idea with like and comment!❤️

FB waited Long positionFB stock repeating July 2018 pattern. Expect price to further decrease until it increases. The difference here is that MACD has already crossed over into bearish territory. Stochastics has moved into oversold territory and weakness in the trend shown by the RSI is looking oversold. RSI signal line of 41 is still in range between 50 and 20. This shows that there is room for the stock to further dip. Either wait for 6 months to get a bullish candle with confirmation candles to enter the trade (approximately July 2022). If taking a long-term position (greater than 1 year) and it's ok to take a temporary drawdown or to dollar cost average, it is a good buy right now. Otherwise, it's better to wait till July and see if the price starts appreciating again as an entry trade.
Risk Disclaimer
*Futures, stocks, exchange traded funds and spot currency trading have large potential rewards, but also large potential risk. You must be aware of the risks and be willing to accept them in order to invest in the futures , stocks, and forex markets.

Market Cycle in Classic Price Action ViewIn all markets buyers and sellers are fighting to find fair price. If price becomes oversold or overbought, the other side of the market will enter and tries to find fair price. Markets are either in Trend or Trading Range . Trend is one sided trading phase and trading range is 2 sided trading phase where both sellers and buyers are active. Trading Range phase will be started if both buyers and sellers thick the the current price is fair.
Trend is where that one side of market is stronger and can move price in its side. We have 2 kinds of trend:
1) Spike(Breakout) 2) Channel which is weaker phase in comparison to Spike.
In classic price action, market cycle is divided to 3 parts. I will explain each part with the signs.
1) Spike(Breakout) Phase:
It's also know as Imbalance. Strongest part of market cycle which one side of the market is very strong and breaks many supports/resistances. This phase will be ended after first actual pullback. Signs are: Consecutive Bars - Gaps between bars - No Pullbacks or Small Pullbacks - Not much overlap between bars
2) Channel Phase:
Another type of trend but weaker than Spike phase. Usually begins after first actual pullback. In the channels, the side that caused the spike is in control of the market. For example if we have bull spike, probability implies that we will have a bull channel after spike phase becomes finished. In both spike and channel phases only take with trend trades. I mean trade in direction of trend and not against it. Signs are: First Pullback - Deeper pullbacks - Higher Highs/Lows in bull - Lower highs/lows in bear / Overlaps between bars
3) Trading Range:
Finally market will find the fair price and that's why we have trading range phase. Every channel will finally be broken from opposite side. First Opposite Breakout of channel, is usually a sign of trading range. In trading range phase both side of the market are trading so you can both buy and sell in trading range. Buy low at bottom of range and sell high at top of range. Signs are: First Breakout of Channel - You see both buy and sell setups - Too many overlaps - Horizontal Movement
Some Examples:
1. EURUSD
2. BTCUSDT
3. XAUUSD

The Power of using NPOCS on your Charts BTC/USDA Naked Point of Control is an untested point of control which is either time based or volume based and exists in the current market structure.
These NPOCS can serve as excellent targets for trades as well as potential areas of support and resistance dependent upon the NPOC's profile distribution.
I have marked this Bitcoin Chart with Daily , Weekly and Monthly NPOCs and using the boxes I have demonstrated how powerful NPOCS can be
when incorporated into a trading strategy for Scalps Daytrades and Swing setups.
I use NPOCS with other confluences mainly Fib levels and order flow and the respect for these levels is well worth noting .
I hope this information helps you define a strategy for your trading as utilizing these correctly will boost your ROI.
Whatever the case thanks for viewing my work and be sure to like and follow .
