📊How to use the VOLUME indicator? Tutorial for traders!The volume indicator is so universal that it is used by most traders, no matter what their trading style. I will talk about the main methods of using this indicator in this idea.
📊What is the volume? A volume indicator is data from the exchange on how much cryptocurrency or shares were traded during a certain period of time. Volumes are displayed in the form of bars. The more bought and sold, the higher the bars on the indicator.
How can I use volumes?
✅Volumes show large trades, which helps to understand the sentiment of the market (bullish or bearish). In this GMT example, you can see how traders bought this coin 4 times and did not "let" the price go lower. After that, you could open a profitable trade on a breakdown of the trend line.
✅Test levels as support. The same principle as in the first example, but here there is a clear test of the level by the price. Volume growth in this case helps you to understand the strength of the buyers and open your trade!
✅False breakout is a situation in the market when the price breaks through a key level for a while and comes back under it. This pattern happens very often in the cryptocurrency market. The volumes grew, which shows a large amount of traded volume, but the price did not go higher and showed weakness, and then Bitcoin fell. Keep this pattern in mind.
✅Divergences. You can see a divergence in the Bitcoin price. Divergence is when the indicator and price values start to be different. As volumes rose, so did the price. After volumes began to fall and the price continued to rise, a divergence formed and Bitcoin fell by 50%. Divergences can be looked for in any cryptocurrency and any timeframe.
✅Indicators. Volumes are a classical indicator, on the basis of which many other well-known indicators are built: VWAP, OBV, etc.
⚙How can I add the volume indicator to the chart? You need to open "Indicators" on the top panel of TradingView and write "Volume" in the search bar. After clicking on the title, it will automatically be added to the chart.
🚩On what timeframes can I use volumes?
Volumes can be used on all timeframes, but it all depends on trading style:
1️⃣ Scalpers watch volumes on lower timeframes: 1m, 5m, 30m. In this way they can identify if the price reacts to a key level, trend line or value zone;
2️⃣ Swing traders use the indicator on timeframes from 1 hour to 1 day. By the same principle as scalpers, you can identify the reaction of other traders to a particular level. For example, Bitcoin has fallen to $50,000 and touched a key level where other traders' buy orders may have been placed. If there were really a lot of bids there, then on the volume indicator, you will see the bars rise as well as price rise. If there was no growth in the bars, it means that most likely the price will fall further.
3️⃣ Long-term traders use the indicator on timeframes from 1 day to 1 week and more. With the help of volumes on higher timeframes, you can identify large liquidation zones on exchanges, important resistance and support levels.
Friends, if you still have questions about how to use the volume indicator, write in the comments. What other methods of using this indicator do you know?
💻Press the "like"👍 button, write comments and share with your friends - it will be the best THANK YOU.
P.S. Personally, I open an entry if the price shows it according to my strategy.
Always do your analysis before making a trade.
Support and Resistance

How did Open Interest tell me: Stay long as BTC Dumped!?!BYBIT:BTCUSD
I was in 3 long trades as Bitcoin dumped on the 26th of May 2022.
I had 2 choices. Close my longs because I saw price dumping below my entry
or
look at what Open interest was telling me to determine if this was a fakeout.
I saw price dropping as OI was dropping. This meant that longs were closing out their positions, which means that when this ended, price could reverse quickly.
Longs were closing out their positions and re-entering as shorts. As soon as this selling dried up, Longs started entering and then suddenly shorts were being liquidated, pushing the price up again.
This is known as a stop run. Hit long stops and then hit short stops. Be aware of this kind of fakeout as it happens again and again!
Learn to trade the retest and why it is important not to short at support and inversely why it is NB not to long at resistance, UNLESS you get a retest of that level!
Not financial advice, DYOR. Papertrade before using real money.
If this educational snipped helped you, please consider giving it a thumbs up and follow for more like this!
Trade Safely and Learn something every day!
Shawn

Why Shorting support & Longing resistance gets traders REKT!INDEX:BTCUSD INDEX:ETHUSD FXOPEN:XAUUSD FRED:SP500 NASDAQ:NDX
I see this time and time again - no matter if you are trading, cryptocurrency, commodities, indices or stocks, the principle remains the same:
Shorting at support and longing at resistance is GENERALLY not a good idea.
I show you examples in the video and explain why.
There is however a good time to short at support - i.e. When it has flipped into resistance after the retest, changing the market structure - and the inverse is true for longs.
If this video helped you, please consider leaving a thumbs up and a comment if you have any questions!
Learn, learn and then learn some more!
Not financial advice. DYOR. Papertrade before using real money

📊How to make a trading strategy?What helps the traders to be successful? That's right, their trading strategies. A trading strategy is a trader's plan for deciding whether or not to open a trade. The purpose of the strategy is to help the trader to make more successful trades, to analyze the mistakes and successes. At a time of uncertainty, these rules help to keep calm and make the right decision. Simply put, it's a set of filters that remove unnecessary noise from the charts and help you make right decision.
💹How to develop a trading strategy? Figure out what you want to trade and what you're best at. Do you like trading false breakouts? Let`s do it! Like to trade patterns? Perfect! Pick your best 20-30 possible trades from the past on the chart, and look for those patterns to repeat on the chart.
As soon as you get a chance to make a trade, remember the rules of your strategy, and if they all match, then do it.
💹What does a trading strategy consist of? This set of rules includes:
1️⃣ The tool you use (patterns, levels, indicators, waves, candlestick analysis, etc.). For example, a squeeze under the trend line, a false breakout of a level, the exit of the indicator into the oversold or overbought zone - all these trading tools can be used in your strategy.
2️⃣ Risk Management. How much money to use in 1 trade, risk per trade. This is a mandatory ingredient of any trading strategy. You can't be 100% right on every trade, so risking all of your capital is not advisable. The average win rate of traders is 50-60%. That means that 5-6 out of 10 trades will be successful - an excellent result. The other 4 trades will be either loss-making or break-even, so it is better to start with a small amount or virtual account on the crypto exchange. In the picture below, you can see what the risk-to-reward ratio and winrate should be.
If you have 50% of successful trades, then at least in each trade you should have RR 1:2 (for 1 risk you receive 2 rewards). To calculate your RR in TradingView, use the "Date and Price Range" section on the left side of the screen and choose "Long Positions" or "Short Position".
✅Example of a trading strategy.
Tools:
🔶false breakout of the key level;
🔶volume indicator.
Description: you marked a key level of $30420 on the chart. After the false breakout you noticed that a large volume appeared on the chart.
Target: the level of highs of $42K.
Risk to reward (RR) 1:5. Good for us? Let's look at the table! The win rate of this strategy is 50% and so RR profitable.
🚩Summary: by opening a trade with a risk of $10, you got $50.
💹Advice for beginners:
1. the trading strategy does not have to be yours. You can take the rules from another strategy and adapt them to you, make your own risk management, rules of entering the trade, in the end, how many trades you make per week or month.
2. start with something simple, like a channel trade and a volume indicator that will show you the reaction of a buyer or seller when it touches the channel boundary. Gradually add filters to remove noise from your charts and increase your win rate. For example, do not open a long on altcoins if Bitcoin is falling. Statistically, 99% of cryptocurrencies repeat Bitcoin's movements, so it is unlikely to be a good trade. Unless you know the secret information, or you have more than 8 years in trading, and you have enough experience.
3. make screenshots of your best and unsuccessful trades, analyze problems and fix them, and try to repeat the best trades more often. A trading journal is best for keeping statistics.
🏁Follow your plan and you will succeed. If you still have questions about how to create your trading strategy, write in the comments. Experienced traders, how did you create your own trading strategy? Share it with the beginners!
💻Friends, press the "like"👍 button, write comments and share with your friends - it will be the best THANK YOU.
P.S. Personally, I open an entry if the price shows it according to my strategy.
Always do your analysis before making a trade.

Price Action Ranges| Range High/Low| Deviations
In this segment we will discuss the concept behind Price Action Ranges; they are periods of oscillation in the market where supply and demand is balanced. Once this occurs, there is a high probability of a price expansion out of the range.
The basic concepts in price action ranges are the following:
- Range High Resistance
- Range Low Support
- Range –Mid
- Deviations
Range High Resistance
- This is an area on the chart where resistance is present, price action tests this area before reversing back down
Range Low Support
- This is an area on the chart where support is present, price action visits this area for a test before reversing back up
Deviations
- Deviations occur out of the region to generate liquidity, it is designed to trap trader before reversing in the opposite direction.

📉How to stay calm during market crashes?🔋Hi friends! Have you saved your deposit to buy crypto? Markets are falling lower and lower every day. In this idea I will give you some tips on how to open successful trades when the market is bleeding and emotions are taking over.
At the crypto market, such massive dumps happen once in 3 years, but the price sometimes falls by 30% and rises by 500-700%. This is called volatility. Crypto market is still quite young, so it is very high here.
I think it`s an advantage because it`s give more opportunities to traders and investors to grow their deposit faster in compare to stock or forex markets. But if you don`t know what to do during market crashes and stay calm at any markets i`ll share with you some tips:
📈Follow the trend. First and foremost rule. You think you can reverse the price direction by yourself? Unless you have more than $1 trillion:) Why would you fight the market when it can help you? If you don`t know what is trend, please, check this idea. It helps you to identify it on lower (1m-1h), middle (1h-1d), higher (1d-1M) timeframes.
📣Join the trading community. Talk to different traders (scalpers, swingers), investors. Share ideas, keep an eye on other people's trading ideas. This way you'll faster understand your mistakes, raise your win rate and look at trading from different points of view. The human mind is built so that you calm down when you shares your thoughts. Do it!
💹Use the trading strategy. Open trades only when the strategy tells you to do so. If you don't know what a trading strategy is or how to make one, post in the comments I'll do an update for you. Simply put, you need to:
1. Create filters to help you identify future price movement.
2. Use risk and money management. To earn in trading you don`t need to open a trade using all your depo.
🚩Personally, I use: trend lines, squeeze under them, mark key levels, volume and horizontal volume indicators, track the market manipulation. There are many trading tools - find your own or borrow someone else's and adapt to yourself and your psychology.
👶If you are new to the market and this is your first experience, trade on a virtual account or try to start with 1% of your capital. If you can't make $200 from $100, how can you make $20,000 from $10,000?
🏁The statistics says that only 1% of traders make profit, 9% trade at breakeven and the other 90% lose money. Be the 1%, learn, read, develop and stay calm!
Friends, press the "like"👍 button, write comments and share with your friends - it will be the best THANK YOU.
P.S. Personally, I open an entry if the price shows it according to my strategy.
Always do your analysis before making a trade.

ow to Apply Trailing Stop | PRICE ACTION TRADING 📚
Hey traders,
In this post, I will share with you my strategy to apply a trailing stop.
Please, note that I am applying a trailing stop only in trend-following trades and only when a trade is opened on a key level. I trade price action patterns, so the following technique will be appropriate primarily for price action traders. Moreover, my entries are strictly on a retest.
1️⃣
Spotting a price action pattern I am always waiting for its neckline breakout. (if we talk about different channels, then by a neckline we mean its trend line)
Once I see a candle close below/above the neckline, I set my sell/buy limit order on a retest.
Stop loss will strictly lie below the lows of the pattern if we buy and above the highs of the pattern if we sell.
2️⃣
Once we are in a trade, you should measure the pattern's range (distance from its high to its low based on wicks) and then project that range from the entry to the direction of the trade.
In the picture, the pattern range and its projection are the underlined blue areas.
Once the price reaches the projection of the pattern's range, you should move your stop loss to entry and make your position risk-free.
Move stop to breakeven in traders' slang.
3️⃣
Then you should let the market go.
📈If you are holding a long position you should let the market retrace and set a higher low and then a new higher high or AT LEAST an equal high. Once these conditions are met you can trail your stop and set it below the last higher low.
📉If you are holding a short position you should let the market retrace and set a lower high and then a new lower low or AT LEAST an equal low. Once these conditions are met you can trail your stop and set it above the last lower high.
Catching a trending market you should trail your stop based on new higher lows / lower highs that the price sets. Occasionally you will catch big winners.
How do you apply a trailing stop?
❤️If you have any questions, please, ask me in the comment section.
Please, support my work with like, thank you!❤️

❗Black Swan by stablecoins. Threat or opportunity for traders?Hi friends! If it heppen to one UST is it heppen to another stablecoins? Next trigger for BTC dump can be caused by stablecoins instability. In this idea i`ll show you some facts about it!
🦢Black Swan. The last Black Swan in all financial markets happened in 2020 because of Covid-19. The crypto market fell by 64%. After the bull market, the Fed Reserve started raising the interest rate, BTC fell by 56%.
What if all the stabelcoins are not secured by anything? If previously the fall of cryptocurrencies was caused by global cataclysms, now we can expect the first black swan only for the cryptocurrency market.
With a EXTREME fear in the market and panic sales of retail traders, BTC could fall to $22k or lower.
📊Stablecoins by Market Capitalization:
1. Tether (USDT) - $83B
2. USD Coin (USDC) - $48.5B
3. Binance USD (BUSD) - $17.1B
4. Dai (DAI) - $6.9B
5. TerraUSD (UST) - $6.9B
Total: $169.4B
❗It`s almost 10% of TOTAL Crypto market Capitalization (169.4/1400).
💱We all know what happened to Luna and UST stabelcoin. US Treasury Secretary Janet Yellen pushes for stablecoin regulation by end of year. Even if the LUNA and UST recover to their previous price, a lot of attention will be focused on other stablecoins as well. On the other hand, this is positive for the crypto market and market players, as crypto security will increase.
✅Friends, if you don`t know what to do when BTC fall by 60-75%, check this idea! I made an educational idea for you when BTC was $39k. It describes 3 ways how you can identify the bottom of the market for BTC and Altcoins!
Friends, where will Bitcoin bottom price? $20-22k or lower? Or BTC already find the dip and go to renew ATH? Share your ideas in comments!
Friends, press the "like"👍 button, write comments and share with your friends - it will be the best THANK YOU.
P.S. Personally, I open an entry if the price shows it according to my strategy.
Always do your analysis before making a trade.

📊How to use Volume indicator to identify the BOTTOM?...and finally buy the right BTC and ALTs dip!😊
Hi friends! Lots of traders buy crypto at the ATH or close to it in hope to make 10x,100x etc. Is it possible and how to do it more succesfull? In this idea i`ll share with you some methods that can realy help you to:
🔶 identify the bottom of the market
🔶 use the volume indicator in right way
🔶 get crypto at a discount
1. Identify the bottom of the market. Already in several ideas I explain you how you can identify the bottom of the market, and traders shared their ideas in the comments also. We will not stop for a long time around all the methods, you can read about them in this idea and in the comments below it.
💹In this idea I will talk about the fundamental method of how to identify the bottom - liquidation . Liquidation is the process when the exchange takes traders' money to cover losses of a long or short. This can happen if you use leverage in trading and do not use risk and money management. 'Cascades of Liquidations' happen when the price falls without any stops by 30-50%. This is a result of not enough buyers in the market to hold the price and as the price drops, more and more leveraged positions get liquidated - it's like a snowball effect🏂 I've seen this in 2018, seen traders who entered the crypto market in the spring of 2020 and most recently in 2021.
2. Use the volume indicator in right way. Why do I use a volume indicator? It's very simple. This is an indicator that shows where a big players open or close their trades. 🚩If a huge liquidations have happened, someone has sold a lot and someone has bought a lot. Why? Just as DOM and Footprint help to identify whale buying or selling orders, so the volumes show the amount of money traded and help to identify liquidations. Also, it can be used at different timeframes to see whales' willingness to buy or sell at key levels, trend lines and other trading instruments. Volume is a real representation of the number of trades.
3. Get crypto at a discount. If you wanted to buy Bitcoin at 60k, why when it drop by 70% you don't want to buy it? Or altcoin, which is down by 95%? A simple example, when you go to the store you want to buy a car with a discount . If there are two identical Lambos🚙 which cost $250,000 and $100,000, why do you want to buy the one that costs more? Ask yourself this question. This is not financial advice, just a comparison of facts and explanation of traders psychology.
✅As we can see on the chart, the last time after such a massive liquidation in 2020-2021, Bitcoin and Ethereum rose by 1100% and 3400%. For example, Binance Coin (BNB) rose by 6460%, Cardano rose by 11400%. Also, after the last liquidations in 2021, there was a good ALTSEASON, when Bitcoin grew by 100%, and all Altcoins by more than 300%.
🏁My personal advice if it`s happen again:
1. Remember about your risks and money management.
2. Use your strategy and don`t panic. You need to just wait for good entry point.
3. Use VOLUME indicator like an additional tool. This indicator can help you to identify the bottom, but not to do all the work for you.
💻Please write in the comments if you still have the questions about the liquidations or Volume indicator! I`ll try to explain you additional tips 🎇
Press the "like"👍 button, write comments and share with your friends - it will be the best THANK YOU.
P.S. Personally, I open an entry if the price shows it according to my strategy.
Always do your analysis before making a trade.

DAY TRADING STRATEGY USING TOP DOWN ANALYSISIn this video i walk you through my day trading strategy from higher time frame to lower time frame.
In the video, you will discover;
How to day trade
How to analyze the market from a higher time frame to a lower time frame
How to pick the best trades that win.
How to mark your support and resistance.
How to follow the trend and many more.

SWING TRADING STRATEGY AND TOP DOWN ANALYSISIn this video i revealed my secret swing trading strategy used in taking profitable trades.
You will learn;
Swing trading strategy
Top down analysis
Multi-time frame analysis
Price Action
Best entry strategy.

HOW TO TRADE MARKET DIFFERENT TYPE OF STRUCTURESHOW TO TRADE MARKET DIFFERENT TYPE OF STRUCTURES:
In this video i explained how to trade different type of market structures like;
- Uptrends
- Downtrend
- Ranging Market
Don't forget to drop your contribution in the comment section.

Understanding MARKET PHASEHope this cheat sheet will help you guys. Chart is self explanatory.
This will explain the movement of price action in each trend.
Moving average as well will help to identify the trend. See description in the chart

Support & Resistance Levels | Trading Basis📚
❗️The concepts of support and resistance are fundamental concepts of technical analysis of financial markets. They are applicable to almost any market, be it stocks, Forex, gold or cryptocurrency.
❗️And although these concepts are easy to understand, in practice they are quite difficult to master, since the definition of levels is completely subjective, and their behavior depends on many conditions. So first of all it is important to learn to distinguish their types. To do this, you will have to familiarize yourself with a lot of graphs, and this guide will help you.
✅What is support and resistance?
🟢At the most basic level, support and resistance are simple concepts. To determine them, the maximum and minimum price indicators are displayed, acting as a kind of barrier. At the same time, the lower values of the chart represent the support level, and the upper values represent the resistance level. In fact, the level of support can be viewed from the point of view of demand, and the level of resistance – from the point of view of supply.
🟢Despite the fact that support and resistance levels are usually denoted by lines, in reality they usually look different. It should be borne in mind that markets are not governed by any physical law that does not allow indicators to go beyond a certain level. Therefore, it is more appropriate to consider support and resistance levels as areas. You can imagine these areas as ranges on the price chart, the approach to which is likely to cause increased activity of traders.
✅How Traders Use Support and Resistance levels
🟢Technical analysts use support and resistance levels to identify areas of interest on the price chart. At these levels, the main trend is likely to change its direction.
🟢Market psychology plays an important role in the formation of support and resistance levels. Traders and investors are guided by price levels that previously caused increased interest and trading activity. These areas will contribute to increased liquidity as many traders will be tracking the same price levels. Often, support and resistance zones create ideal conditions for entry or exit from a position for large traders.
🟢The concepts of support and resistance levels are key to effective risk management. Your trading opportunities may depend on your ability to consistently identify these zones. Usually, after the price reaches the support or resistance area, two possible events are possible. It either bounces off this area, or breaks through it and continues moving in the direction of the trend to the next potential support or resistance area.
🟢It is best to enter a trade when the price is near the support or resistance level, mainly because of its relative proximity to the cancellation point, where a stop loss order is usually placed. In case of a breakthrough of the area and invalidation of the transaction, traders will be able to reduce their losses, because the further the entry is from the supply or demand zone, the further the point of invalidation of the transaction.
🟢At the same time, you need to understand how these levels will change depending on changes in the situation on the chart. As a rule, a breakdown in the support area can turn it into a resistance area. Conversely, a broken resistance area may turn into a support area when it is retested. This pattern is called the support-resistance flip.
⚠️How to draw support levels correctly?
⏺Reduce the timeframe of your charts so that you can see the bigger picture.
⏺Draw the most obvious levels that tend to have the strongest price bounces.
⏺Adjust your levels to get the maximum number of touches.
❤️ Please, support our work with like & comment! ❤️

AMD Reports: Planning for Each ScenarioAMD reports after the close today and is expected to have strong revenues over last quarter. The chart patterns suggest some Pro Traders setting up ahead of the report.
The question is how far can it rise on the retail reaction to the report? Where are the sellers? See the red lines. 124 is the strongest resistance for the short-term trend, but there are potential stalling levels on the way up as well.
Earnings reactions can be a very short-lived event, so prepare to take profits when the pro traders do. They trade against retail.

🚩How to identify the bottom and BUY the crypto in time? 3 tips!🌟How to BUY crypto in time and with the possible highest RETURN? The correct answer is during the capitulations.
🎯Capitulation is when even patient and experienced traders start to panic, but this is the opportunity time (Jan 2015, Nov 2018, Mar 2020, May 2021).
🔶How to buy crypto during the capitulations? Use the dollar cost average (DCA) strategy. This strategy allows you to buy crypto by parts without risking all of your capital.
🔶How to use DCA strategy? This strategy helps to average the BUY price. You can only sell at the top and buy at the bottom by accident. In real life, this strategy helps to average the buy price of a crypto. For example, back in 2019, you bought Bitcoin 3 times at $3,000, $4,000, and $5,000. The average purchase price in this case is $4,000. If the price go lower, you would average the price, if it rose, you already bought at a good price. Also, you can BUY at the weekly candle close during the capitulions. It is important to use the equal parts of the capital to buy (1/10, 1/20 etc.). Another simple example is shown on the chart😉
🔶How you can identify a capitulation?
1. Look at the volumes and record liquidations as shown on the chart. The liquidation of 50-100k Bitcoins is the best indicator.
2. Look at the percentage of drop from the highs. Historically, a price drop by 65-80% has been the bottom of the market.
3. Use the indicators that show the bottom of the market. Read this idea about the 🔋Greenwich indicator. It shows both the top and bottom of the market. So when BUY signals (green diamonds) appear, you can use this indicator to buy crypto by parts.
🔶Why does the DCA strategy work? Bitcoin, like U.S. stock markets, is in a long-term Uptrend. After buying Bitcoin in 2017 at its ATH ($18-19k), investors are now still at +100% profit. And as long as this trend is not broken this strategy will work. For example, the U.S. stock market has been in uptrend for over 80-90 years.
💻Please write in the comments if you still have questions about the DCA strategy or how else you can identify the bottom. What methods do you use for that? 🎇
Press the "like"👍 button, write comments and share with your friends - it will be the best THANK YOU.
P.S. Personally, I open an entry if the price shows it according to my strategy.
Always do your analysis before making a trade.

Power of Having Multiple Confluences in TradingThe more confluences you have, the more confident you are in the fact that your technical setup will play out according to the plan. Confluences come in different shapes and styles, whether it is combining some Moving Averages and Bollinger Bands with price action, or having your grandma flip a coin a decide the faith of Bitcoin.
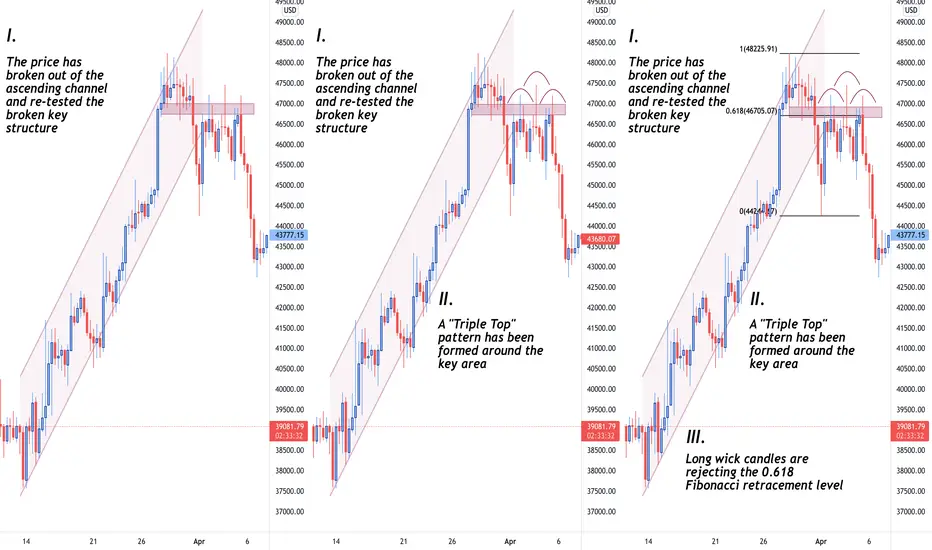
On the graphical illustration that you can see on the screen, 3 confluences have been utilised to back up our idea and they are the following:
1) "Break + retest" formation
2) "Triple Top" pattern
3) Fibonacci retracement tool
It can be noticed from the left hand side of the screen, that the price has nicely broken out of the ascending channel and re-tested the local key structure. Moving to the next step, it can be emphasised that a nice "Triple Top" pattern has been formed. Lastly, we add another confluence to back up a possible scenario that we have eyes on by using the 61.8% Fibonacci retracement level, which is referred to as the "Golden Zone". Taking a look at the chart, we can clearly observe that long candle wicks are nicely rejecting this very zone.
All in all, combining multiple confluences give us enough confluence to back up our sentiment. However, nothing is 100% guaranteed in the markets, meaning that it is not promised that your trade will play out perfectly no matter how many confluences you have. Thus, be risk-tolerant, patient, and cold-blooded!
Have a great upcoming weekend, everyone!
🎯BTC: Real Life wedge trading! Tutorial for traders!🌟 The picture of the wedge pattern is beautiful, but you have to understand how to trade in Real Life! In this idea I will try to teach you how to enter the trade and what to look for. The descending wedge is a bullish pattern. On the chart you can see how it works on Bitcoin. Over the past year, it has worked well in 3 out of 3 trades.
🎓What is the wedge? Wedge is the price consolidation in downtrend or uptrend. So if it`s UPTREND, the price making higher highs and higher lows. The whales in this case sell higher and higher. Ascending (uptrend) wedge is bearish pattern. So If it`s downtrend the price making lower highs and lower lows. The big players try to hunt trader stop losses to get the liquidity for their LONG positions.
🚩Let`s start from the May-July 2021 wedge! In addition to the descending wedge, there are several triggers to open a long:
1. false breakout (liquidity collection) of the $30K key level. A lot of stop losses were collected, a lot of traders were liquidated. The whales were happy. Additionally, pay attention to volumes as well as liquidation volumes.
2. squeeze under the upper boundary of the wedge and test it as support. Here you can open a trade during the squeeze under the trendline and after test it as support. It`s better to check at lower timeframe.
All this added up to a long two-month consolidation with stops losses hunting and Bitcoin DUMP by 50-55%. Many traders simply lost faith and closed positions at a loss.
The price rose by 50-60%, but if you had closed the trade on the next Dump, you would have a profit at least +30-35%.
🚩Next is the Sep 2021 wedge! In this case we didn't see big liquidations, the whales had enough liquidity, and everyone who shorted on this 23% drop became the fuel🔥 for further growth. Additional triggers:
1. a trend change. The price trend changed from a downtrend to a small consolidation and then started to create higher highs and lows.
2. squeezing under the local trend line on lower timeframes. If you switch to the 1 hour timeframe this is clearly visible.
3. test of the global and local trend line as support and growth without pullbacks (strength of the bulls).
We close the deal as soon as the target is reached. If you continued to hold the trade for more than 10 days, the profit would be at least +30%.
🚩 Will the fourth wedge break up(4/4)? During this Apr 2021 wedge, we have not seen the huge liquidations yet. Also, we haven't seen bullish strength, squeezes under trend lines or levels. Therefore, we should wait for our entry point and don`t open trades without the confirmation of the trading strategy. I'll share with you my local ideas later.
🌐Globally, the market has been in a $30-67k consolidation for more than 1.5 years. Sooner or later the price will choose the trend and maybe even in the next few weeks.
🔥Trading is the combination of trading tools, using filters and non-standard methods, which I try to explain in my training ideas.
Friends, press the "like"👍 button, write comments and share with your friends - it will be the best THANK YOU.
P.S. Personally, I open an entry if the price shows it according to my strategy.
Always do your analysis before making a trade.

🎯BTC & $US index: the secret combo for traders!📊Bitcoin is rising while the dollar is falling and vice versa. Today I will use the simple examples to show the pattern that helps to identify the trend of Bitcoin for many years.
The instruments that we need:
🔶Bitcoin is the #1 cryptocurrency, the first and foremost crypto-asset, our favorite grandpa. Bitcoin's movement is copied by 99% of all crypto, it is the main indicator of the crypto market.
🔶DXY - U.S. Dollar Index. It was created in 1974 and shows the ratio of the US dollar to the basket of six other major currencies: euro, yena, pound sterling, Canadian dollar, Swedish krona and Swiss franc. The index essentially shows how strong the U.S. dollar is.
💡I've taken a few cycles as an example to make it easy to understand this principle. For the example, I don't take data up to 2017. At that time Bitcoin was with the small capitalization and a big HYPE. You're not interested in perfect examples, but in real experience and usage, aren't you?
So, the first cycle of 2017-2018 shows us that:
1. as soon as the index started to fall🐻, Bitcoin had an active bull run.
2. when the index hit lows it was almost Bitcoin's tops.
The second cycle of 2018-2020, Bitcoin spent in a huge consolidation and two corrections of -70%🐻 What was the index doing this time? Of course it was rising! Only after the last fall of Bitcoin in 2020, it was able to recover and continue its rise to the new ATH!
In the third cycle of 2020-2021 Bitcoin was able to grow to $63-67 thousand due to the unprecedented weakness of the dollar. Now Bitcoin is in consolidation and even the mass adoption and hype around crypto is not help BTC to renew ATH.
🏁The dollar was weakening amid huge inflation and Bitcoin was rising, but when the FED began raising the interest rate and investors began to transfer money from Europe to the United States, the index began a new bull run. You saw an example of what happens during an index bull run. Therefore, we should expect an active phase of Bitcoin growth at the moment when the FED rate hike ends (the end of August) and geopolitical issues will be solved😉
Friends, press the "like"👍 button, write comments and share with your friends - it will be the best THANK YOU.
P.S. Personally, I open an entry if the price shows it according to my strategy.
Always do your analysis before making a trade.

What is Technical Analysis?Technical Analysis demystified:
In this video, I defined what technical analysis is.
Summarized the history behind candlesticks and many more.
This is Technical Analysis defined by me with simplicity.
Very simple and easy to understand.

BTC: Real Life mirror level trading! Tutorial for Beginners!💡A mirror level is a level that price tests as support and resistance several times. It helps to open long or short trades on a test of the level. Usually the mirror levels are numbers like 100, 1000, 50,000, which traders pay attention to. It can also be previous ATHs, important global levels that can be easily identified. Price bounces off of them because a large number of traders pay attention to it.
I have marked 2 global mirror levels for you:
1. $10101
2. $41950
On the chart I have marked tests of these levels. Also, on the chart you can see several short (+63%) and long (+59.7%) trades.
Now I give you 2 tips on how to open a trade using the mirror level:
🔶open a trade with a pending stop order. When the price is testing the level as support you can put a stop order to buy, and when it's resistance you can put a stop order to sell
🔶open the trade after the close of the candle. Once you are sure that the level has held the price as support or resistance you can open a trade
📑Based on the statistics, you can see that longs are more profitable. This is because Bitcoin and cryptocurrencies are growing 80% of the time. But you can calculate the statistics by yourself and consolidate your new knowledge!
🎓Also you can read the basic desription about Real Life channel trading in this educational idea!
✉Friends, if you still have questions about using the mirror level, write the comments or to the DM!
Press the "like"💟 button and share with your friends - it will be the best THANK YOU.
P.S. Personally, I open an entry if the price shows it according to my strategy.
Always do your analysis before making a trade.

GMT Repeat Same history as AXS infinity. GMT Repeat Same history as AXS infinity did.
AXS highest price was $166 per coin at that time Market cap was 9.75B of USD. Huge number
GMT current price is $3.16 with a market cap of 2B of USD. That means if this coin repat same history it could make an additional 5x. To reach a 10B market cap.
I think We can trade this coin during significant pullbacks because so many people bought a LOT of coins during IEO.
at $ 0.01 per coin rased $ 4,200,000. That means every dollars is made 321.98x ( +32,098.1% ) of profit.
PRIVATE sale. Price per coin was $ 0.005. Raise $ 5,000,000. Current RIO 643.96x ( +64,296.1% )
Friends, it's huge numbers. That means when the lock-up period will end part of people will sell their coins to the market.
that's why when u trade ALWAYS use STOP Losses. And book your profit as i mentioned in a video.

BTC: Real Life channel trading! 3 tips for beginners95% of beginners don't understand why patterns don't work as it shown in the books. That's why losses, stress, and worries appear. The point is that only practice and personal experience will help you understand how to use it correctly.
I will give you a few secrets how to trade in the channel successfully:
1. after testing the borders of the channel, wait for a false breakout or liquidity collection. At point 3 and point 5, there was a large collection of liquidity, after which you can open a LONG. You can see the result by yourself (+28%).
2. Pay attention to the key levels and value zones - combine instruments.
2.1. At point 4 there is a large value zone of $46-47k, which became a resistance. Combined with the upper boundary of the channel, it was a strong resistance zone, which means price is sure to bounce off. We saw a 20% drop!
2.2. At point 5, there was a large value zone of $37.5-40k from which the price also bounced off. The lower boundary of the channel+value zone was a major support for price. Not bad?
3. The middle of the channel. On the chart, we can see that it is often tested as resistance/support. An additional opportunity to open a trade.
Be crafty, use trading tools in combination with each other and you will notice results immediately.
Friends, press the "like" button, write comments and share with your friends - it will be the best THANK YOU.
P.S. Personally, I open an entry if the price shows it according to my strategy.
Always do your analysis before making a trade.
