The Ichimoku Cloud (Ichimoku Kinko Hyo) - WTF is itSo, the Ichimoku Cloud (Ichimoku Kinko Hyo) - WTF is it??? At first the Ichimoku Cloud can look a bit daunting, but after reading this, hopefully it will put you at ease & you will realise that it is a really neat and powerful indicator that shows you Momentum, Trend, Support and Resistance . Note that you can use the Ichimoku Cloud for all timeframes, but it may not work on monthly or yearly charts if there is not enough previous data.
The Ichimoku Cloud ( Ichimoku Kinko Hyo) is made up of 5 indicators, The Conversion Line (Tenkan Sen), The Base Line (Kijun Sen), Leading Span A (Senkou Span A), Leading Span B (Senkou Span B) and the Lagging Span (Chikou Span).
On TradingView the default settings for the Ichimoku Cloud are:
Conversion Line Periods = 9
The Base Line Line Periods = 26
Lagging Span 2 Periods = 52: Is actually the Leading Span B
Displacement = 26: Is actually the Lagging Span
For the Crypto market, these default settings are no good and we need to adjust the settings because Crypto is 24hrs a day, 7days a week, 365 days a year. Crypto never closes “unless an exchange or broker gets worried” 😜.
Using the TradingView’s system, the Crypto settings need to be changed to:
Conversion Line Periods = 20
The Base Line Line Periods = 60
Lagging Span 2 Periods = 120: Is actually the Leading Span B
Displacement = 30: Is actually the Lagging Span
Some people have posted online saying the displacement should be 60 for Crypto, but that is incorrect. 60 gives too much distance from the Cloud (Kumo) and you cannot get accurate readings for Resistance and Support, so 30 is perfect for Crypto needs.
Using the Crypto Settings, The Conversion Line (Tenkan Sen) is a Midpoint of the previous 20 Period Highs and 20 Period Lows. The Base Line (Kijun Sen) is a Midpoint of the previous 60 Period Highs and 60 Period Lows. So they are not SMAs or EMAs. What is neat is that if you change timeframes then you will get the 20 & 60 Period Midpoints for whatever timeframe you are in, so it is a very useful tool to see if there is a possible cascade effect happening on lower timeframes that may cascade on to higher timeframes. If the Conversion Line (Tenkan Sen) crosses under the Base Line (Kijun Sen), that is a Sell Signal or varying strength depending on where it crosses in relation to the rest of the Ichimoku Cloud Indicator. If the Base Line (Kijun Sen) crosses back under the Conversion Line (Tenkan Sen), then that is considered a buy signal of varying strength depending on where it crosses in relation to the rest of the Ichimoku Cloud Indicator. The Conversion Line (Tenkan Sen) & The Base Line (Kijun Sen) can act as potential Support and Resistance depending on if the current price is above or below either of the indicator lines.
Leading Span A ( Senkou Span A) is a Leading momentum indicator and is already calculated from the Conversion and Base Line values, hence why you only need to add a value for Leading Span B (Senkou Span B) which is 120. The Leading Span B (Senkou Span B) uses double the periods so it will react slower compared to Leading Span A (Senkou Span A). The gap between Leading Span A (Senkou Span A) & Leading Span B (Senkou Span B) is the Cloud (Kumo). If the Cloud (Kumo) is green, that indicates we are in a Bullish Trend for that timeframe. If the Cloud (Kumo) is red, that indicates we are in a Bearish Trend for that timeframe. The area above the cloud is the Bullish Zone & the area below the cloud is the Bearish Zone. Inside the cloud is the Equilibrium Zone, which can be seen as trend-less, uncertainty or trading sideways. A key move to look out for is if the Leading Spans A,B are Crossing/Twisting from either a green cloud into a red cloud or vice versa to indicate a trend reversal. Note the Cloud (Kumo) can be Red or Green while the price action is in the Equilibrium Zone depending on if it dipped down or up into the Cloud (Kumo). Note that because we dip downwards outside of the Cloud (Kumo) that doesn’t mean the Cloud will turn red because we may rebound before the Leading Span A (Senkou Span A) gets a chance to cross Leading Span B (Senkou Span B) and vice versa. If the Cloud (Kumo) is thin then this is a good sign of momentum, when the Cloud (Kumo) starts getting wider, that means momentum is slowing down. The Leading Span A (Senkou Span A) & the Leading Span B (Senkou Span B) can act as potential Support and Resistance depending on if the Price is above or below the Cloud (Kumo), or in the Equilibrium Zone. Note that the Leading Span A (Senkou Span A) & Leading Span B (Senkou Span B) are plotted 30 Periods ahead of the current price.
The Lagging Span (Chikou Span) is a momentum and a 2nd confirmation indicator that enables you to see potential trend changes. Using the Crypto settings, the Lagging Span (Chikou Span) is calculated by shifting the indicator 30 periods behind the last closing price. If the Lagging Span (Chikou Span) indicator is above where the price was at 30 periods ago then that is considered an uptrend for the timeframe you are in. If the Lagging Span (Chikou Span) indicator is below where the price was at 30 periods ago then that is considered a downtrend for the timeframe you are in. A Bullish and Bearish confirmation signal can be seen if the Lagging Span (Chikou Span) indicator crosses up or under that previous 30 period price respectively, but also using the other indicators as conformation. If the Lagging Span (Chikou Span) is inside the previous Price from 30 Periods ago, then that is considered sideways trading, choppy or trend-less.
The Ichimoku Cloud (Ichimoku Kinko Hyo) is designed to be used as a whole and each of the indicators complement one another. It’s best practice to use it with other indicators like, Volume , RSI , VPVR, MACD , ADX or the SMI. This is my first educational post on TradingView, so i'd thought id keep it brief. I’ll update and go into the different confirmation buy/sell levels, and more on each of the indicators at a later date. I hope you have found this educational post helpful 🙏
In fact, reading this thing back, its not really that brief is it 😅👍
Support and Resistance

Understanding how to trade Pennant patterns / Real exampleToday we will show you the theory behind Pennant patterns and apply them to a real example.
CONTINUATION PATTERNS: Ralph Nelson Elliott (who created the Elliott Wave Theory) discovered that there are 4 types of patterns that the resolution of them tend to be in the same direction of the previous impulse once the correction is finished and we have a breakout.
-TRIANGLES
-IRREGULARS
-ZIG-ZAGS
-FLATS
Today we will learn about pennant patterns, which are a type of triangle. Pennant Patterns are made by 5 waves (abcde); you can draw that using the tools you have on trading view on "Patterns."
In general terms, you will be able to draw two converging lines, and the price will start compressing there. It's important to know which is the previous impulse of the pattern to draw the Fibo Extension using that previous impulse. The Fibo Extension will allow you to define targets and are extremely useful when you are at ATH because you can't rely on previous technical movements to define supports or resistances.
HOW TO TRADE THEM?
Entry-level: Always above/below B depending on the direction you are trading. In this case with AMZN, our confirmation level is above B
Stop Level: Always above/below A depending on the direction, you are trading. The easiest way to define your stop level is by setting it above/below the whole structure.
Break-Even level: If the price starts going in the expected direction, you can move your stop loss to your entry-level, once the price reaches the First Fibo Extension
Target: Use the last Fibo extension level. Your minimum risk rewards ratio should always be 1.5, never less than that.
Thanks for reading!

The Crash was anticipatable !!One of the beautiful theories that I've learned and I want to share is the Dow theory Non-Confirmation . Using specific pairs of indexes and reading them in comparison , as a technician that uses momentum oscillators I like to see disproportions and divergences and if we apply what we know to this study we'll find that the Dow Theory Non-Confirmation is all about this logic , we see in this pair of RUSSEL 2000 and S&P 500 that a non confirmation happened just before the crash and happened after it , it's a divergence between tops and bottoms . While the S&P 500 succeeded to create a new high the RUSSELL 2000 shows us a Lower high and an exhaustion this could be a great signal for those who like to short the market or for buyers to keep an eye on their positions . For the second one that happened just after the crash you'd see that the market continued his trend to create historical highs but it was also an opportunity for Investors and Traders ! . What differentiates them ? .
Here a technician can make good of his knowledge and create a complete setup , for me using just classic resistance and support approach we see clearly that while in the first non confirmation case we got a Support broken at RUSSELL 2000 exactly the same time market has just broken an UPtrendline in S&P500 which is a bearish Confirmation for the figure and a complete setup , Other technicians can find other premature signals that's the beauty of technical analysis .
So what about the second non-confirmation setup ? we have exactly the inverse situation we got market that find support on an old high of the RUSSELL 2000 and the S&P500 also on his uptrendline , it was a complete setup to Go long .
I suppose that I didn't give something new for some experienced Traders but it could be useful for other , for me I see Beauty .

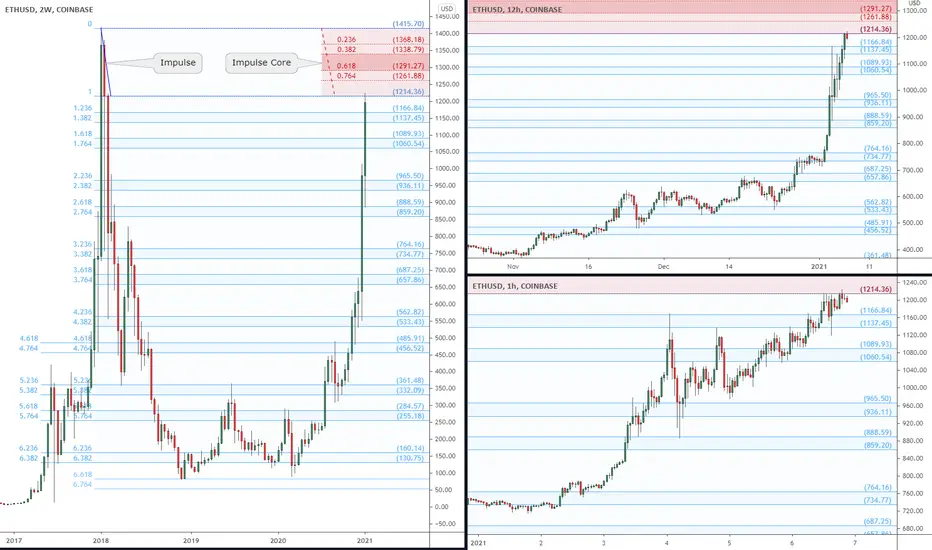
Pulse of an Asset via Fibonacci: ETH at EPOCH Impulse Redux"Impulse" is a surge that creates "Ripples", like a pebble into water.
"Impulse Redux" is returning of wave to the original source of energy.
"Impulse Core" is the zone of maximum energy, in the Golden Pocket.
Plotted above is the Impulse from All Time High in 2017.
That first push down set off a series "Ripples" flowing down.
This fib defined most of the turns since, and now we are back.
Are the sellers still there? Enough to absorb the buying power?
Reaction at Impulse is worth observing closely to gauge energy.
Rejection is expected on at least first approach if not several.
Part of my ongoing series to collect examples of my Methodology : (click links below)
Chapter 1: Introduction and numerous Examples
Chapter 2: Detailed views and Wave Analysis
Chapter 3: The Dreaded 9.618: Murderer of Moves
Chapter 4: Impulse Redux: Return to Birth place <= Current Example
Chapter 5: Golden Growth: Parabolic Expansions
Chapter 6: Give me a ping Vasili: one Ping only
.
.
Ordered Chaos
every Wave is born from Impulse,
like a Pebble into Water.
every Pebble bears its own Ripples,
gilded of Ratio Golden.
every Ripple behaves as its forerunner,
setting the Pulse.
each line Gains its Gravity .
each line Tried and Tested.
each line Poised to Reflect.
every Asset Class behaves this way.
every Time Frame displays its ripples.
every Brain Chord rings these rhythms.
He who Understands will be Humble.
He who Grasps will observe the Order.
He who Ignores will behold only Chaos.
Ordered Chaos
.
.
.
want to Learn a little More?
can you Spend a few Moments?
click the Links under Related.
What is a Symmetrical Triangle?A symmetrical triangle is a chart pattern characterized by two converging trend lines connecting a series of sequential peaks and troughs. These trend lines should be converging at a roughly equal slope. Trend lines that are converging at unequal slopes are referred to as a rising wedge, falling wedge, ascending triangle, or descending triangle.
KEY TAKEAWAYS
Symmetrical triangles occur when a security's price is consolidating in a way that generates two converging trend lines with similar slopes.
The breakout or breakdown targets for a symmetrical triangle is equal to the distance between the initial high and low applied to the breakout or breakdown point.
Many traders use symmetrical triangles in conjunction with other forms of technical analysis that act as a confirmation.

Elliott wave : corrective wave How to use fibonacci retracement and extension
this entire trend was started at 1857 and ends at 1900 with wxy zigzag corrective wave.
wave x is subdivide into abc flat correction which retraced upto 0.382 of wave X at 1870
wave y made 1.382 projection of wave w at 1900.
the entire wxy trend made 50% retracement at 1878.
(retracement after wave y overlap wave x high which made clear that these are corrective wave not the impulsive wave )
how to trade ?
buy at 0.383 retracement of wave X and exit at 1.382 projection
sell at 1.382 projection at 1900 and exit at 0.50 retracement

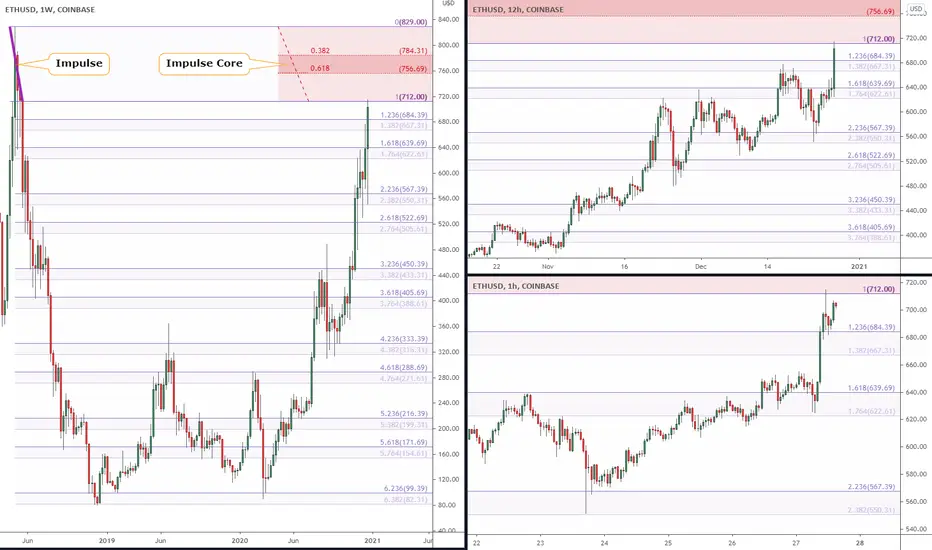
Pulse of an Asset via Fibonacci: Ether at GRAND Impulse Redux"Impulse" is a surge that creates "Ripples", like a pebble into water.
"Impulse Redux" is returning of wave to the original source of energy.
"Impulse Core" is the zone of maximum energy, in the Golden Pocket.
Are the sellers still there? Enough to absorb the buying power?
Reaction at Impulse is worth observing closely to gauge energy.
Rejection is expected on at least first approach if not several.
This particular Impulse was born in May 2018 from the $829 top.
The Ripples of that Impulse have caught EVERY turn since then.
What happens here will have PERMANENT ramifications for ETH.
.
Part of my ongoing series to collect examples of my Methodology : (click links below)
Chapter 1: Introduction and numerous Examples
Chapter 2: Detailed views and Wave Analysis
Chapter 3: The Dreaded 9.618: Murderer of Moves
Chapter 4: Impulse Redux: Return to Birth place <= Current Example
Chapter 5: Golden Growth: Parabolic Expansions
Chapter 6: Give me a ping Vasili: one Ping only
.
.
Ordered Chaos
every Wave is born from Impulse,
like a Pebble into Water.
every Pebble bears its own Ripples,
gilded of Ratio Golden.
every Ripple behaves as its forerunner,
setting the Pulse.
each line Gains its Gravity .
each line Tried and Tested.
each line Poised to Reflect.
every Asset Class behaves this way.
every Time Frame displays its ripples.
every Brain Chord rings these rhythms.
He who Understands will be Humble.
He who Grasps will observe the Order.
He who Ignores will behold only Chaos.
Ordered Chaos
.
.
.
want to Learn a little More?
can you Spend a few Moments?
click the Links under Related.
Trend trading strategy 1.2 Introduction
Hello everyone! Like I said in a previous idea, I will be doing an educational post today about trading strategies. Unlike the previous strategy I talked about, this one is used during uptrends and downtrends, and doesn’t prioritize buying at the beginning of these moves.
——————————————————————————————————————————————————————————————
Rules of the strategy
Uptrend
1. Buy when there is a retrace to a support/resistance after an earlier break of the same support/resistance.
2. Put your stop-loss below the support right under the support the stock/crypto retraced to.
3. Don’t have a set target unless you think the price will reject strongly from a certain level.
4. Sell 50% when a support level formed during the uptrend is broken or there is a break downward of the 50 MA.
5. Sell 100% when another support level formed during the uptrend is broken or there is a break downward of the 100 MA.
This is the best case scenario when using this strategy in an uptrend:
Downtrend
1. Buy when there is a retrace to a support/resistance after an earlier break of the same support/resistance.
2. Put your stop-loss above the resistance right above the resistance the stock/crypto retraced to.
3. Don’t have a set target unless you think the price will reject strongly from a certain level.
4. Sell 50% when a resistance level formed during the uptrend is broken or there is a break upward of the 50 MA.
5. Sell 100% when another resistance level formed during the uptrend is broken or there is a break upward of the 100 MA.
Here is the best case scenario when using this strategy in a downtrend:
——————————————————————————————————————————————————————————————
Apple stock
As you can see on the chart, if we used this strategy back in August/September, we could’ve made 12.5% returns in about 27 days, or less than a month. Thus is the power of buying pullbacks.
——————————————————————————————————————————————————————————————
How does this work?
When your buying pullbacks, your essentially getting into a trend which has temporarily been pushed down by the “bears”, or sellers. Since the overall direction is bullish, or upward, these can be seen as bargains in a “premium” (or high priced) environment. The moving averages and use of support and resistance help confirm the end of a trend and tells you when to get out and get in. (This is pretty much the opposite when talking about downtrends; your looking for premium prices in a bargain environment to short. Support and resistance/moving averages still help however).
——————————————————————————————————————————————————————————————
Final thoughts
This is one of my last posts for the year. I may or may not do another one before 2021, depending on whether I see any long (or short) opportunities in the market. Hopefully everyone learned something while viewing this idea, if not then the majority of people. Happy new year!

Five types of major support and resistance levelsWant to buy the bottom and sell the top? Want to predict major turning points in a security's price? Want to avoid buying too early or selling too late? Then you need to understand support and resistance levels!
I know a lot of people who mostly trade breakouts. That can be a very successful strategy, and I've used it myself to good effect. But if you buy a breakout after it happens, you pay a "breakout premium"-- especially if you're buying option calls or puts. You'll get a much better price on options if you buy them *before* a breakout or *before* a major change in momentum. How do you do that? Know your support and resistance levels!
Once you know how to identify the different types of support and resistance, you can look to see where several different types of support or resistance coincide . Those will be key price points at which different types of investors who rely on different types of indicators will all buy or sell at the same time.

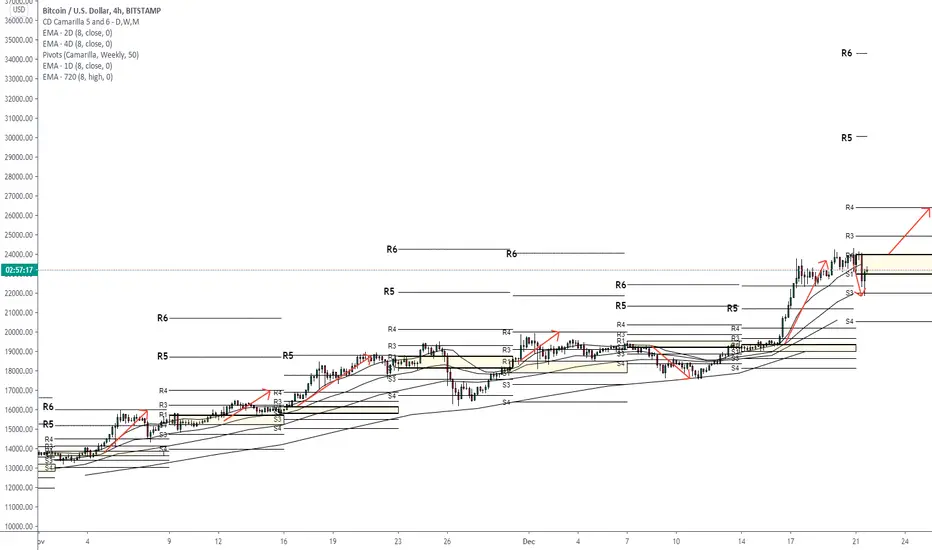
How to use Camarilla Opening Range Hello traders, Here I shall demonstrate you how you can use Camarilla Weekly Opening range S1 to R1 (in tradingview, otherwise Camarilla levels are marked with H1,2,3,4,5,6 (High) and L1,2,3,4,5,6 (for Low).
-------------------------------------------
If day, week or month opens and price start trending ABOVE Camarilla Opening Range you look for LONGS, targetting 1. R3 2. R4 3. R5. R5 Final target after breakout of R4, as price rarely makes it to R6 during a week / month. Usually I never target R6 - this is quite unrealistic target (though it might work in supervolatile instruments as bitcoin).
If day, week or month opens and price start trending BELOW Camarilla Opening Range you look for shorts with targets as above.
-------------------------------------------
You can use Moving averages (best static ones - multitimeframe that do change when you flip charts) to confirm entries.
This system is similiar to Mark Fisher´s Opening Range using the open instead of close (which are typically the same, as candle usually opens where it closed).
This should greatly improve your trading as you will have REALISTIC VOLATILITY BASED TARGETS based on previous close, high and low.
Good luck!
EURGBP - What Is a Pennant?What Is a Pennant?
In technical analysis, a pennant is a type of continuation pattern formed when there is a large movement in a security, known as the flagpole, followed by a consolidation period with converging trend lines—the pennant—followed by a breakout movement in the same direction as the initial large movement, which represents the second half of the flagpole.
Pennants are continuation patterns where a period of consolidation is followed by a breakout used in technical analysis.
It's important to look at the volume in a pennant—the period of consolidation should have lower volume and the breakouts should occur on higher volume.
Most traders use pennants in conjunction with other forms of technical analysis that act as confirmation.
Understanding Pennants
Pennants, which are similar to flags in terms of structure, have converging trend lines during their consolidation period and last from one to three weeks. The volume at each period of the pennant is also important. The initial move must be met with large volume while the pennant should have weakening volume, followed by a large increase in volume during the breakout.
Here's an example of what a pennant looks like:

Price Action Basics: 1 Tool to Rule them AllIn this vid I will explain about Price action Basic Tool.
This tool is exceptional and most used in trading and technical analysis.
This video will help new traders how to analyse chart and find trades according to price action.
Bump Like if you enjoyed the video and find it useful.
Best regards,
Artem Shevelev

How to trade XRP. 3 Best and simpliest trading strategies. My Friend. Here will be the best patterns that work on Crypto and XRP:
1. False break out of key level
- U should wait for a pullback to a strong key level.
- Better when a false breakout happens after 100% of ATR drop.
example
2. Wage patten
This BNB trade is the best example.
We made 3% within 1 day))
3. Squezeeng to a key level
The best example will be on EUR/USD but it also works on Crypto and XRP.
I just showed you 3 best examples of how can buy XRP. Wait for one of these scenarios.
My Friends, if u want to learn how to trade crypto and make money on it write to us about education. Below this video will be a link which u can use for it. Because we closed the last 2 weeks with 80% of the profit. You also can learn how to do it.

HOW TO DRAW SUPPORT AND RESISTANCE LIKE A PROHello everyone, If you like the materials in this video, do not forget to support with a like and follow.
In this video, we are going to learn how to draw support and resistance in a practical way on NZDCAD Daily timeframe.
Hope you will make good use of it!
Rich

Orderzones Explained : A form of Support & ResistanceHello traders!
In this educational idea im going to be going over the 5 different main types of Order Zones on Crypto Charts & how i identify and draw these zones, aswell as what they are used for.
Orderzones are a way of marking on the chart historically significant areas where price had strong reactions to.
The price tends to come back to these areas and have strong reactions, the Order Zones act as a form of Support & Resistance.
For those who are new to Technical Analysis ; "Support" is a area on the chart price and demand (buying pressure) increases from, with "Resistance" being the opposite, with price decreasing and sell orders (Supply of asset) increasing from the latter.
Why do i use Order Zones?
-Reduces risk & increases probability of potential trades
-Trying to trade with; not against larger size traders such as institutions that use similar price levels due to historic signifcance
-Providing clear entry and exit points to calculate Risk:Reward Ratio (R:R)
-Providing reference points to capitalize on historical areas of market volatility
-Allows us to reduce clutter and find key areas as the volatility on Crypto makes it difficult to chart
We have 5 main types:
-Supply Clusters
-Demand Clusters
-Single Candle Supply
-Single Candle Demand
-Orderblocks
Supply Clusters & Demand Clusters
First we must find areas on the chart that look similar to a tightly squeezed together rectangle . Price should then make a "thrust" (major increase, or decrease in value) from this rectangular area. We use the Rectangle Tool to draw a zone across these areas.
In the below image you can click for a in depth explanation of how to use these clusters in your trades.
Single Candle Supply & Single Candle Demand
To draw and identify the Zones first we must find areas on the chart where a strong reversal occurs, at the start of the trend reversal, or at swing points we can find larger then normal "wicks": (wicks are the thin, needle points at the end of the candlesticks ) as you can see in the above and below images.)
Click the below image for a in depth explanation of how to use these zones in your trades.
Orderblocks
Orderblocks are the small square shaped candle bodies, usually found in between significant price moments. They are small "pauses" before the next move. We use the Rectangle Tool to draw a zone across these areas.
In the below image you can click for a in depth explanation of how to use Orderblocks in your trades.
If you take some time to go back over your charts (especially on the Monthly, Weekly & Daily timeframes) and test out some of these Order Zones, you will see more then often price comes back to these areas before reversing like a magnet towards the next closest Order Zone so they become a useful tool in any traders arsenal.
If you found the idea informative show your support by Liking & Commenting thank you!

An up and down channelWelcome Back.
Please support this idea with LIKE if you find it useful.
***
What Is an Ascending Channel?
An ascending channel is the price action contained between upward sloping parallel lines. Higher highs and higher lows characterize this price pattern. Technical analysts construct an ascending channel by drawing a lower trend line that connects the swing lows, and an upper channel line that joins the swing highs.
***
An ascending channel is used in technical analysis to show an uptrend in a security’s price.
It is formed from two positive sloping trend lines drawn above and below a price series depicting resistance and support levels, respectively.
Channels are used commonly in technical analysis to confirm trends and identify breakouts and reversals.
***
A bearish channel is a continuation chart pattern (of a trend). A bearish channel is formed by two parallel bearish lines. The price progresses between these two parallel lines; the upper line is called the "resistance line"; the lower line is called the "support line".
Each of these lines must have been touched at least twice to validate the pattern.
NB: a line is said to be "valid" if the price line touches the support or resistance at least 3 times.
This implies that the bearish channel pattern is considered valid if the price touches the support line at least 3 times and the resistance line twice (or the support line at least twice and the resistance line 3 times).

BTCUSD 05 DEC 2020 (recent Wyckoff phase analysis) Schematic 2Accululation schematic 2. You can see the textbook phase development from a recent re-accumulation into mark-up
Starting on the left you can see the preliminary support/stopping volume/selling climax which is how trading ranges start. A support is established on high volume.
The Automatic rally (AR) is the initial establishment of resistance. It is important here to make note of the supply/sell pressure. If the sell pressure is high here, the market (automation) will read the market as if there are still sellers (supply). In order to minimize the amount of sellers in the market, the CO/SM may stay in this training range for hours, days, weeks... as long as it takes to get you to sell your bags.
You are dealing with automation. It does not need to eat or sleep and has one objective and ONEE OBJECTIVE only... to take your money.
Price will oscillate in this trading range -accumulating- .. buying low. Who sells low? Retail.
SM/CO BUYS LOW and SELLS HIGH.. there is no exception to this. This is a rule you must take on yourself, which is appropriate since that is the objective of professionals.
Phase B-the "supply/demand" phase.. is an area you want to avoid. During this phase you will notice price erradically moving up and down with no ryme or reason. This is a common area for retail to enter and then immediately find that price refuses to move. This can really push your tolerance and patience. This is where you start to wonder if you risked too much.... This is the market shaking out weak hands getting retail to sell their bags.
A lot more to it but a good rule of thumb is to avoid phase B entries at all cost.
Depending on the supply/demand situation you may or may not get a "spring". A spring is a fake out below support that hits high volume driving price back into the trading range. Schematic 2 does not a spring or terminal shake out
For a more thorough/academic explanation please refer to any or all of the free following:
Sources of education:
Richard Wyckoff
Tom Williams Volume spread analysis VSA/ Master the Markets
Pete Faders VSA*
Read the ticker dot com
Wyckoff analytics
Dee Nixon
Avoid buying into weakness/supply/resistance
Avoid selling into strength/demand/support
Avoid entry when price is in middle of a range (phase B)

Supply & Demand Zones Explained #2 : Single Candle Supply DemandSingle Candle Supply & Demand Zones are a form of Supply & Demand Zones and price can commonly find Resistance or Support on them. For those who are new to Technical Analysis ; "Support" is a area on the chart price and demand (buying pressure) increases from, with "Resistance" being the opposite, with price decreasing and sell orders (Supply of asset) increasing from the latter.
This makes them a great tool for finding exit or entry points for trades. The left images show how a Single Candle Supply or Demand Zone is identified and drawn on the Cryptocurrency market charts.
To draw and identify the Zones first we must find areas on the chart where a strong reversal occurs, at the start of the trend reversal, or at swing points we can find larger then normal "wicks": (wicks are the thin, needle points at the end of the candlesticks ) as you can see in the top left of the image.
When price revisits them (as you can see on the bottom image) it tends to react to it; giving traders a opportunity to capitalize on these movement's. They also are a useful tool for gouging Risk & Price targets as when one Zone is "claimed" price tends to head towards the next like a magnet; so they become ideal take profit & SL (Stop Loss) areas.
In this particular image we can see how ETH:BTC clearly had important price reactions to these areas; with the uptrend starting from the original Single Candle Demand Demand Zone marked at the Bottom Left. As the Price Action progressed - the level was "claimed" until we saw a continuation upwards, price then started to decrease in value at the next area. We came back down to the Single Candle Demand Area and now we have seemed to have found Support on it. We can use this live chart to look back in the future and see how Ethereum:BTC reacts to these historically important areas of Supply & Demand while learning.
If you found this idea informative, feel free to share your thoughts/criticisms and hit the like button, thank you traders!

Learn how to create a setup using 5 price action itemsToday we will learn how to create a full setup using 5 Price Action items. This process will be made on the 1H chart and is extremely useful for Swing setups. However, the logic can be applied in any timeframe. This can also be applied to any direction today; we will work with a short setup, but it is the same for a long setup.
1) Daily Resistance zone: If we are working on the 1H chart and the price is about to face a Daily Resistance zone, we should expect a reaction there; WHY? Because The higher the timeframe of a level, the stronger it is, and we should be ready for a reaction there. This should be the first filter to use: The price is about to face a higher degree zone.
2)Define the minor support and resistances of the current trend: If we are waiting for a reaction on the Daily Resistance zone, it is essential to understand the levels we have on the current trend. WHY? Because we will use them to define the next target and the Corrective structure's location to trade.
3)Wait for the breakout of a relevant trendline: In this case, we want to see the price breaking the Ascending trendline; WHY? Because that would be a signal that the Reversal movement on the Daily level is going as expected. The breakout of the Ascending trendline is a key element: Know the conditions are optimal to start thinking on a short setup.
4) Wait for a corrective Structure on the minor Support zone: Corrective Structures are ABC or ABCDE patterns. You should be able to draw edges on that sideways movement. You can define that is ready when you have something like the example you see on the chart.
5) Now, everything is aligned to develop a setup. Your bearish idea is supported with all the previous 4 items; only at that moment you can say I will create a short setup. Define your entry-level below the structure or below "B, set your stop above "C". Define your Target on the next minor support/resistance zone. Pay attention to the risk-reward ratio you have; only take setups with a R/R ratio higher than 1.5
Thanks for reading! We hope this Template can help you with your trading.

Corrective Structures and Fibonacci ExtensionsHere, we will expand the information about the chart.
Corrective Structure: Tell us about an accumulation/distribution process. That means that Institutional funds are trying to buy the maximum amount of an asset. Remember, they have a lot of money. They cant set a buy order as Retail traders do. They need to average their buy on a range (that takes time). The same applies to the selling process. A key aspect of this process is the idea that when they buy, they will move the price; after that, they need to sell a partial amount of the previous purchase to keep the price in range. When the price falls again, they loop the process again. These actions create corrective structures that retail trades can use to understand that this is happening and simply wait for the breakout.
Fibonacci Extensions: Ralph Nelson Elliott stated that, while stock market prices may appear random and unpredictable, they actually follow predictable, natural laws and can be measured and forecast using Fibonacci numbers. ( In this case, Fibo Extenssions provide us with Targets based on proportions with previous movements) Elliott stated that, while stock market prices may appear random and unpredictable, they actually follow predictable, natural laws and can be measured and forecast using Fibonacci numbers.
We hope the information was useful!

Supply & Demand Zones Explained: A form of Support & ResistanceSupply & Demand Clusters are a form of Supply & Demand Zones and price can commonly find Resistance or Support on them. For those who are new to Technical Analysis ; "Support" is a area on the chart price and demand (buying pressure) increases from, with "Resistance" being the opposite, with price decreasing and sell orders (Supply of asset) increasing from the latter.
This makes them a great tool for finding exit or entry points for trades. The above images show how a Supply or Demand cluster is identified and drawn on the Cryptocurrency market charts.
To draw and identify the Zones first we must find areas on the chart that look similar to a tightly squeezed together rectangle. Price should then make a "thrust" (major increase, or decrease in value) from this rectangular area. We use the Rectangle Tool to draw a zone across these areas.
When price revisits them (as you can see on the bottom image) it tends to react to it; giving traders a opportunity to capitalise on these movement's. They also are a useful tool for gouging Risk & Price targets as when one Zone is "claimed" price tends to head towards the next like a magnet; so they become ideal take profit & SL (Stop Loss) areas.
In this particular image we can see how ETH:BTC clearly had important price reactions to these areas; with the uptrend starting from the original Demand Cluster marked at the Bottom Left. As the Price Action progressed - each level was "claimed" until we saw a continuation upwards.

How to Develop a Short Trade using Top-Down AnalysisGood morning traders!
Today we want to show you a practical case of how to apply multiple timeframes for the complete development of a trade. In this case it is BMY stock, and it is a trade that we ourselves will take if what we are expecting happens.
🔸What can we find in this chart?
- First, what we can see is that in the 4H timeframe, the price has been moving in a range of 15-20% since May.
- A few days ago, the price faced the resistance zone that is around $64-66. We consider it a resistance zone since every time the price reaches that level, it encounters a strong supply, which generates its subsequent downward movement.
- Based on this, we decided that once a clear rejection was given, we would look for an opportunity to take a short trade.
🔸Descending to the 15Min chart, we see that after the rejection in the Resistance zone, the price generates a breakout of the Ascending Trendline.
- Added to this behavior, the Support zone is penetrated strongly to the downside, and then the price consolidates forming a corrective structure in a pullback to the Resistance zone (previous support).
- This is our opportunity to look for a short trade.
- The corrective structure offers us a correct and safe R/R ratio.
- The point where we will look for the entry of the trade will be in the breakout of the local low, with a stop loss behind the structure and the resistance zone.
- And finally, the maximum target of the movement is the uptrend line.

How should we trade a Pennant Pattern? Real ExampleToday we have another Academy Post. In this article, we will explain the way we trade pennant patterns on a real setup.
FIRST STEP: Understand the context
-In this case, we have the price inside an ascending channel (that provide us a bullish direction)
-The price is at All-time Highs ( Next Resistance zone, the upper trendline of the channel)
-The price is above a previous Resistance zone (we can deduce Strenght of the price)
SECOND STEP: Creating a Setup
-Now that we have a clear idea about the bullish potential and free path towards the next resistance zone (upper trendline of the channel), we need to develop a setup
-First of all, we need a valid Structure. In this case, a pennant structure to be valid needs an ABCDE formation; the reason is that if we wait for those 5 Waves, we can have a clear idea of the breakout level (The lower and Higher trendline have been tested multiple times, based on that we can set our orders with confidence)
- A setup is composed of 4 items
a) Entry Level: Above B (check the pennant theory)
b) Stop level: Below C
c) Take Profit level: On the 2nd Fibo Extension or in the next resistance zone
d) Break-Even level: First Fibo Extension.
-Only trade if your Risk Reward ratio is above 1.5 ( that means that for every dollar you are risking, you expect to make 1.5)
THIRD STEP: Define your Risk and Follow your rules.
-Only use 1% of your capital on any given trade. That way, you will protect the most important thing as a trader. Your money and your mind
-Follow your rules: The reason you want to have a clear Stop, Take profit, entry, and Break-Even is to act only if the price reaches one of those. otherways, DO NOT TOUCH ANYTHING
-Accept that Stop losses are part of any system: You don't need "90% accuracy"; you need to be right half of the time and a risk-reward ratio above 1.5 to be profitable.
Trade Safe, Thanks for reading!
