When Arctic Storm Meets Government ShutdownNYMEX: Micro Henry Hub Natural Gas Futures ( NYMEX:MNG1! )
A “Perfect Storm” is brewing by weather catastrophe and man-made events.
On Thursday, November 6th, forecaster Atmospheric G2 said that it predicted colder than normal weather over the Eastern US for November 11-15. Driven by the expectati

The best trades require research, then commitment.
Get started for free$0 forever, no credit card needed

Scott "Kidd" PoteetThe unlikely astronaut

Where the world does markets
Join 100 million traders and investors taking the future into their own hands.

ASTS 4H: space internet or orbital dream?AST SpaceMobile (ASTS) is consolidating above the $61–69 zone, right near the 0.618 Fibonacci level of its last major rally. On the 4H chart, momentum shows early reversal signs: falling volume on pullbacks, stochastic turning up, and buyers defending local lows. The bullish setup holds as long as p

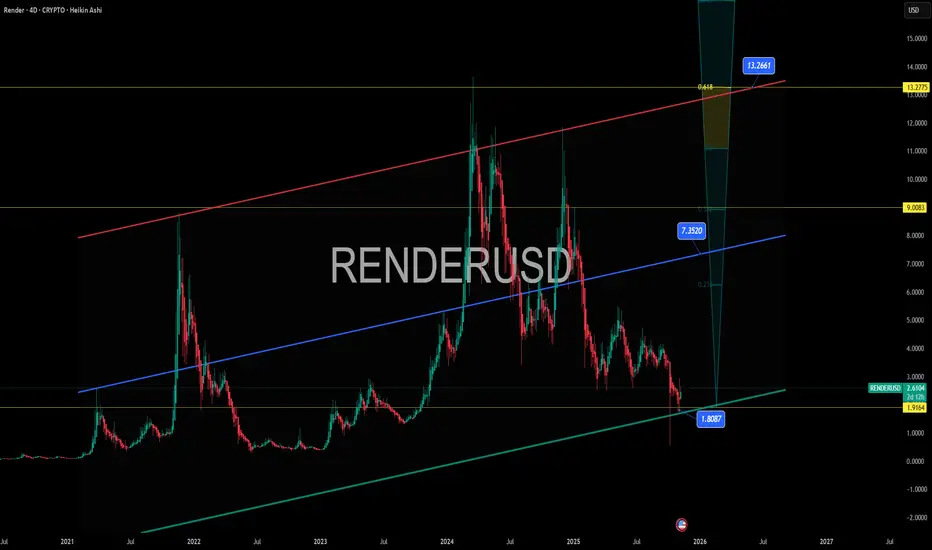
RENDER – Nvidia’s Favorite GPU Coin Testing Demand Zone RENDER – Nvidia’s Favorite GPU Coin Testing Demand Zone 🔍🎯
Render just kissed the $1.91–$2.00 demand zone — the base of the macro channel and a textbook long-term retest level.
This is not just any altcoin. Render powers the Las Vegas Virtual Dome and is the only crypto Nvidia has ever name-drop
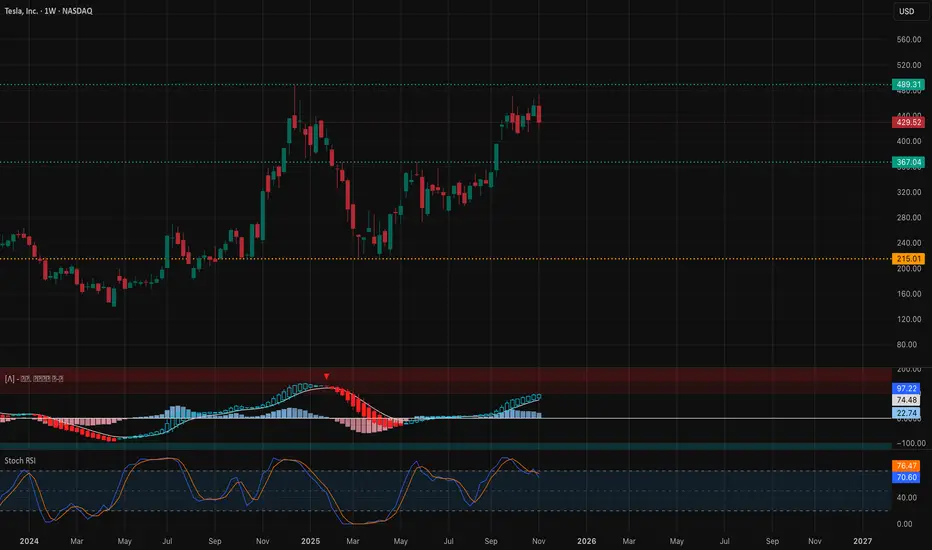
TSLA Setting Up for a Big Move This Week (Nov 10–14)Here’s the full multi-timeframe outlook for TSLA based on SMC structure, channels, BOS/CHoCH shifts, momentum, and the GEX map. Each section is separated so you can attach the matching chart under it.
1. Weekly Timeframe (1W)
Macro Structure
TSLA is still holding its bigger weekly breakout after cl
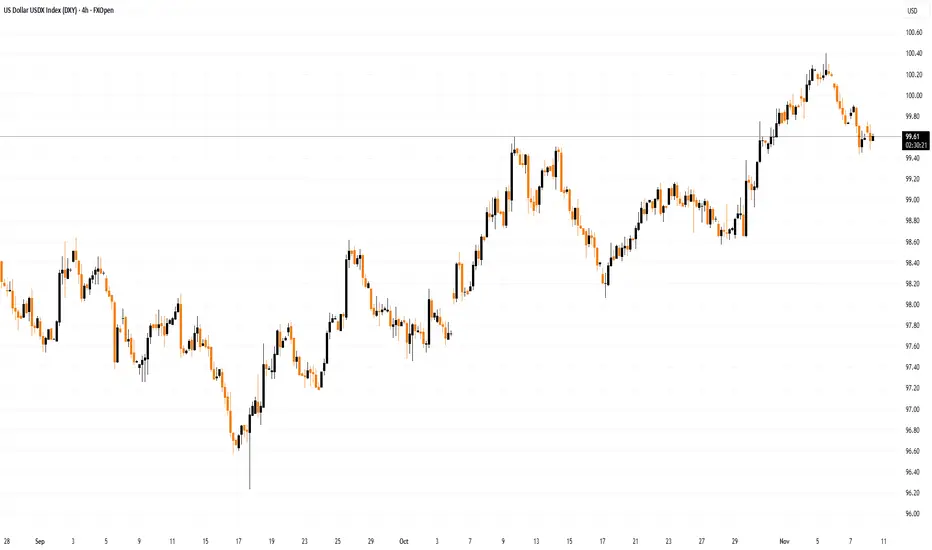
Dollar Index Pulls Back from a Key HighDollar Index Pulls Back from a Key High
As the Dollar Index (DXY) chart shows, the index is currently trading below its 5 November high, which formed after a false bullish breakout (marked by an arrow) above the 1 August peak — a scenario previously outlined in the post “The Dollar Index Near a Ke
US 500 - Has All the Good News Been Priced?After a volatile and nervy 5 days for US stock indices the week ended on a slightly more stable and positive footing.
In relation to the US 500 index this volatility saw it open on Monday November 3rd around 6885, trade down to a low of 6633 early on Friday November 7th, before rallying by over

XAUUSD: Buyers Defend $4,040 — Targeting $4,140 ResistanceHello everyone, here is my breakdown of the current Gold setup.
Market Analysis
XAUUSD has recently confirmed a bullish structure after bouncing strongly from the $4,000–$4,040 Support Zone, an area that coincides with the ascending Trend Line visible on the chart.
This level has repeatedly acted

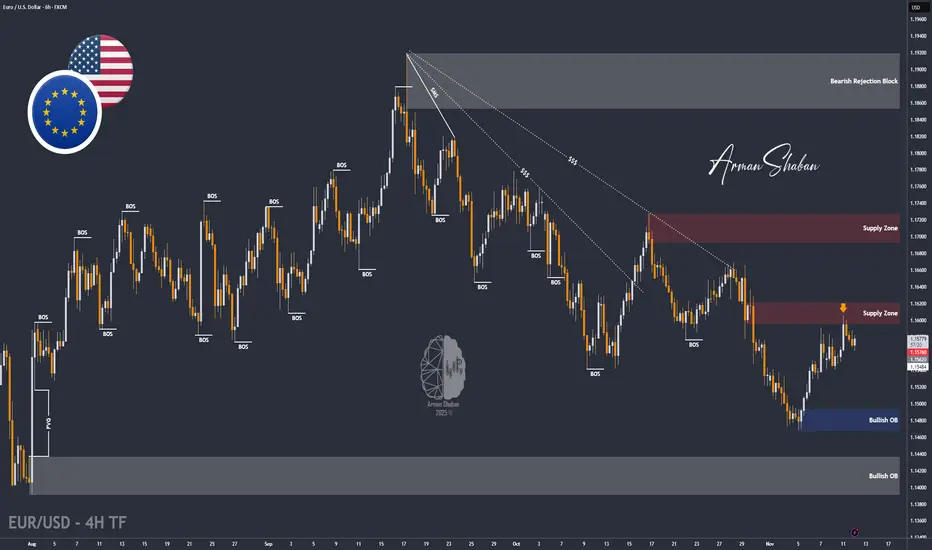
EUR/USD Loses Momentum – Sellers Take Back Control!The market is beginning to show clear signs: the U.S. dollar is regaining strength , while EUR/USD faces strong correction pressure after a short-lived recovery. The latest news from the U.S. indicates that sentiment is shifting in favor of the greenback, as expectations for a government reopenin

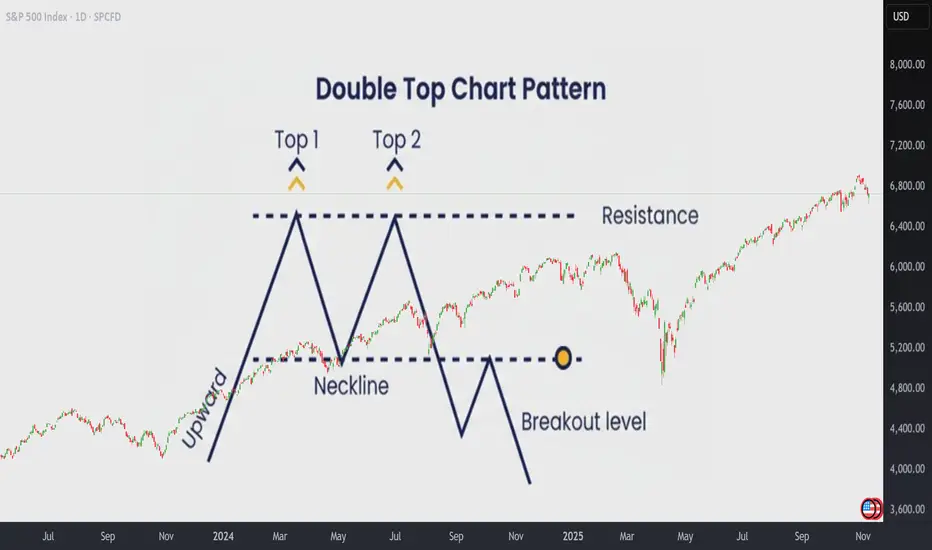
How to Trade the Double Top Pattern Like a ProHow to Trade the Double Top Pattern Like a Pro
The Double Top is one of the most reliable patterns in technical analysis. It often marks the beginning of a resistance zone and signals that bullish momentum is losing strength.
The first top is hard to anticipate, it’s usually just a continuati
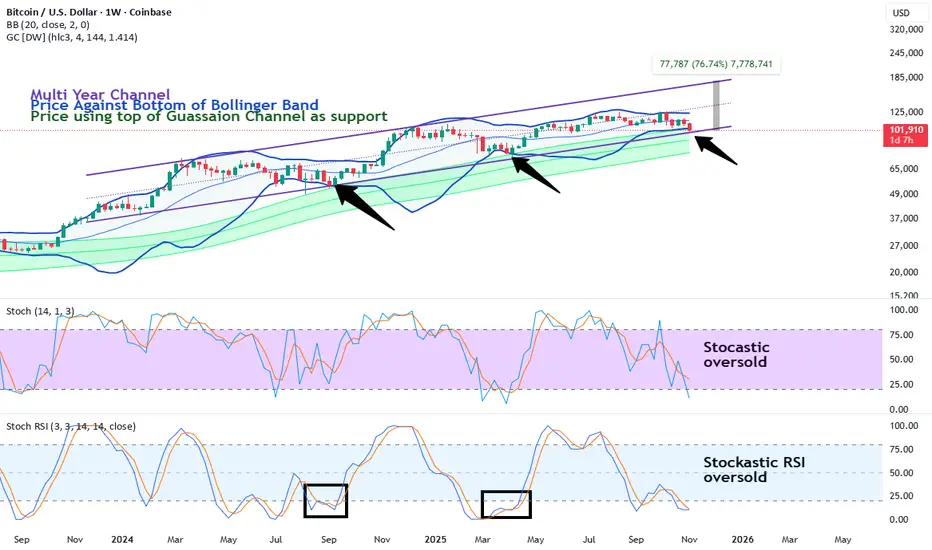
People Panic (again) as bitcoin returns to support (again)Bitcoin has been channeling up for about a year pretty consistently. The basic technical supports are still working. Price hits the weekly Bollinger band bottom, wicks through, builds structure and reverses to a new high. Price has also been bouncing off the top of the weekly gaussian channel. Th
See all editors' picks ideas
PriceFormatLibrary for automatically converting price values to formatted strings
matching the same format that TradingView uses to display open/high/low/close prices on the chart.
█ OVERVIEW
This library is intended for Pine Coders who are authors of scripts that display numbers onto a user's charts. T

LogNormalLibrary "LogNormal"
A collection of functions used to model skewed distributions as log-normal.
Prices are commonly modeled using log-normal distributions (ie. Black-Scholes) because they exhibit multiplicative changes with long tails; skewed exponential growth and high variance. This approach i

Range Oscillator (Zeiierman)█ Overview
Range Oscillator (Zeiierman) is a dynamic market oscillator designed to visualize how far the price is trading relative to its equilibrium range. Instead of relying on traditional overbought/oversold thresholds, it uses adaptive range detection and heatmap coloring to reveal where pri

Volume Surprise [LuxAlgo]The Volume Surprise tool displays the trading volume alongside the expected volume at that time, allowing users to spot unexpected trading activity on the chart easily.
The tool includes an extrapolation of the estimated volume for future periods, allowing forecasting future trading activity.
🔶 U

Smooth Theil-SenI wanted to build a Theil-Sen estimator that could run on more than one bar and produce smoother output than the standard implementation. Theil-Sen regression is a non-parametric method that calculates the median slope between all pairs of points in your dataset, which makes it extremely robust to o

Fair Value Gaps by DGTFair Value Gaps
A refined, multi-timeframe Fair Value Gap (FVG) detection tool that brings institutional imbalance zones to life directly on your chart.
Designed for precision, it visualizes how price delivers into inefficiencies across chart, higher, and lower (intrabar) timeframes — offering a fl

TASC 2025.11 The Points and Line Chart█ OVERVIEW
This script implements the Points and Line Chart described by Mohamed Ashraf Mahfouz and Mohamed Meregy in the November 2025 edition of the TASC Traders' Tips , "Efficient Display of Irregular Time Series”. This novel chart type interprets regular time series chart data to create an ir

Simplified Percentile ClusteringSimplified Percentile Clustering (SPC) is a clustering system for trend regime analysis.
Instead of relying on heavy iterative algorithms such as k-means, SPC takes a deterministic approach: it uses percentiles and running averages to form cluster centers directly from the data, producing smoo

Adaptive Volume Delta Map---
📊 Adaptive Volume Delta Map (AVDM)
What is Adaptive Volume Delta Map (AVDM)?
The Adaptive Volume Delta Map (AVDM) is a smart, multi-timeframe indicator that visualizes buy and sell volume imbalances directly on the chart.
It adapts automatically to the best available data resolution

Dynamic Equity Allocation Model"Cash is Trash"? Not Always. Here's Why Science Beats Guesswork.
Every retail trader knows the frustration: you draw support and resistance lines, you spot patterns, you follow market gurus on social media—and still, when the next bear market hits, your portfolio bleeds red. Meanwhile, institution

See all indicators and strategies
Community trends
TSLA Plunging? The Fake Rebound Before the Real Crash!Tesla (TSLA) is entering a challenging phase as a wave of negative news hits from both fundamental and technical sides. Sales in China — Tesla’s second-largest market — have dropped to their lowest level in three years , sparking fears that real demand for EVs is cooling. At the same time, Elon

PLTR CAUTION!PLTR is at a key critical area, which has already given a warning shot to bulls.
We have a complete rising wedge structure with 3 waves up and a hook that has already cracked! Within it, we also have a head and shoulders at the top, which is bearish. (H&S not a top is usually a continuation patter

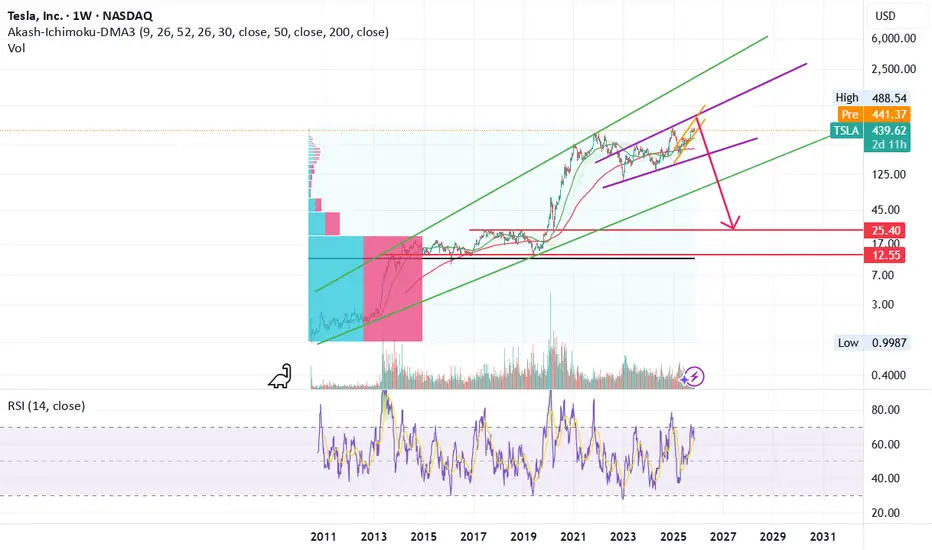
TSLA - Update (Log)It has a date with the top rail of the orange bull flag (500 to 600 USD)
then down down downnnnn
Not financial advice
But I look forward to seeing where this low lands, as that could form the bull channel that looks to the future!
A 10x on APLD ? Applied Digital has confirmed a multi-year symmetrical triangle breakout on the weekly chart, marked by immense volume and a clean breakout above long-term downtrend resistance. The base of the triangle spans several years, with consistent higher lows forming a solid support line.
🔺 Breakout Volume

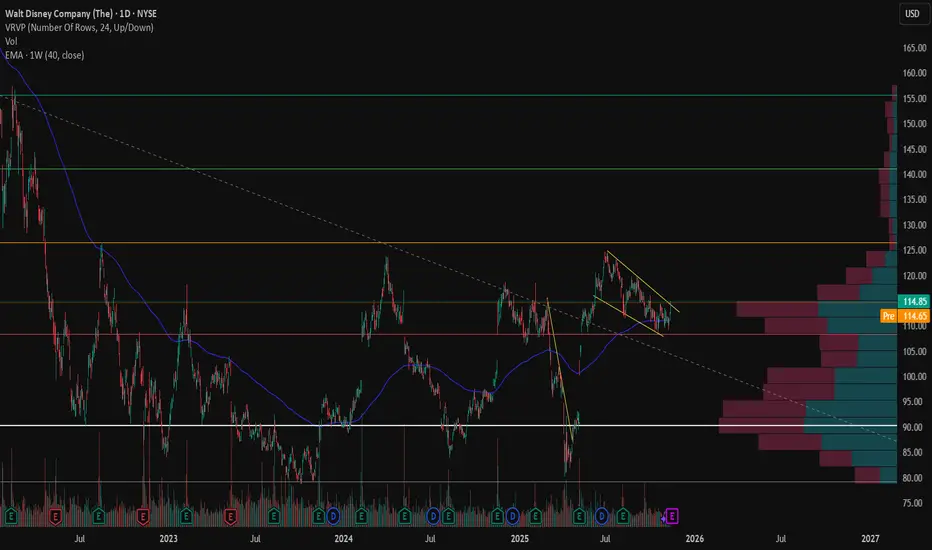
DIS FLAG BREAKOUTBouncing off the 40-week EMA, DIS broke out of a flag, just one day before the Qtr earnings. Pending the Qtr results, this could mean the start of a new leg up.
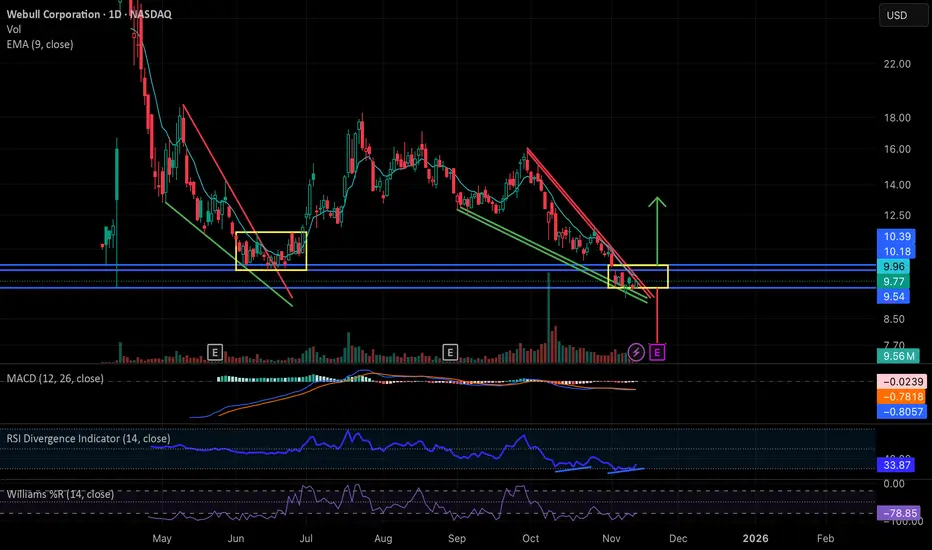
Webull: Falling Wedge Breakout ImminentNASDAQ:BULL has been in a steady decline essentially since the start of the government shutdown, forming a clean falling wedge structure very similar to the setup we saw in May and June. Back then, the wedge resolved with a brief breakout but ultimately moved into a sideways consolidation inside th
NVDA Big Move Loading. TA for Nov. 12–15NVDA at a Critical GEX Compression Zone
NVDA has been moving like a stock caught between two worlds — heavy enough to stay suppressed, but supported enough to avoid a real breakdown. When you zoom out, the candles almost look like they’re waiting for someone to flip a switch.
In reality, NVDA is n

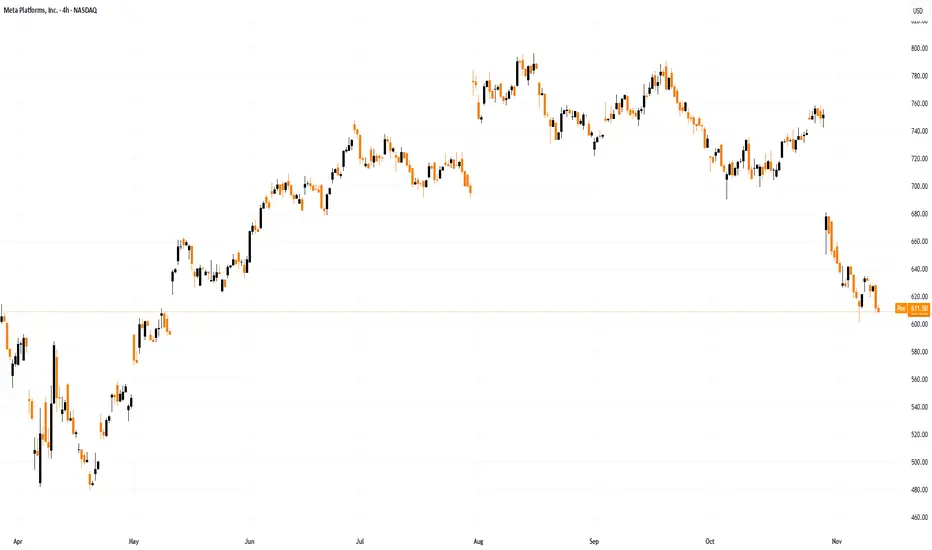
Meta Platforms (META) Shares Fall to Key SupportMeta Platforms (META) Shares Fall to Key Support
In November, Meta Platforms (META) shares have shown bearish momentum following the company’s quarterly report, which included a one-off income tax expense of $15.93 billion (as previously noted).
Investor concerns have been further fuelled by the
Disney Is Up Just 4% YTD. What Its Chart Says Ahead of EarningsWalt Disney Co. NYSE:DIS plans to release fiscal Q4 results this week at a time when the stock has risen just 4% this year and trails the S&P 500 SP:SPX in timeframes ranging from three months to five years. Let's see what the entertainment giant's chart and fundamental analysis say.
Disney's

Amd - Here comes the major reversal!👺Amd ( NASDAQ:AMD ) is reversing right now:
🔎Analysis summary:
Over the course of the past couple of months, we witnessed a very expected rally on Amd of about +250%. But right now, Amd is retesting a major resistance trendline. If we actually see bearish confirmation in the near future, the

See all stocks ideas
Today
MNOVMediciNova, Inc.
Actual
−0.12
USD
Estimate
−0.12
USD
Today
TBNTamboran Resources Corporation
Actual
—
Estimate
−63.56
USD
Today
SPNSSapiens International Corporation N.V.
Actual
0.36
USD
Estimate
0.35
USD
Today
SERSerina Therapeutics, Inc.
Actual
−0.45
USD
Estimate
−0.53
USD
Today
KSCPKnightscope, Inc.
Actual
−0.98
USD
Estimate
−0.80
USD
Today
CSIQCanadian Solar Inc.
Actual
−0.07
USD
Estimate
−0.53
USD
Today
EPCEdgewell Personal Care Company
Actual
0.68
USD
Estimate
0.81
USD
Today
DRIODarioHealth Corp.
Actual
−2.96
USD
Estimate
−4.90
USD
See more events
Community trends
Bitcoin - Will it take the liquidity at $98.000?Bitcoin (BTC) has shown a clear downward price structure in recent days.
After a period of sideways movement and attempts at recovery, selling pressure has once again become dominant, resulting in a sharp decline toward key liquidity zones.
4h Bullish FVG Inversion
BTC has just failed to hold t

Bitcoin – From Break to Battle: Will the Bulls Hold the Line?Bitcoin has broken its four-hour downtrend line, marking a potential shift in momentum after an extended bearish phase. The move has sparked renewed interest from buyers, signaling the first real attempt to reclaim structure after consistent lower highs. Despite this progress, the market remains tra

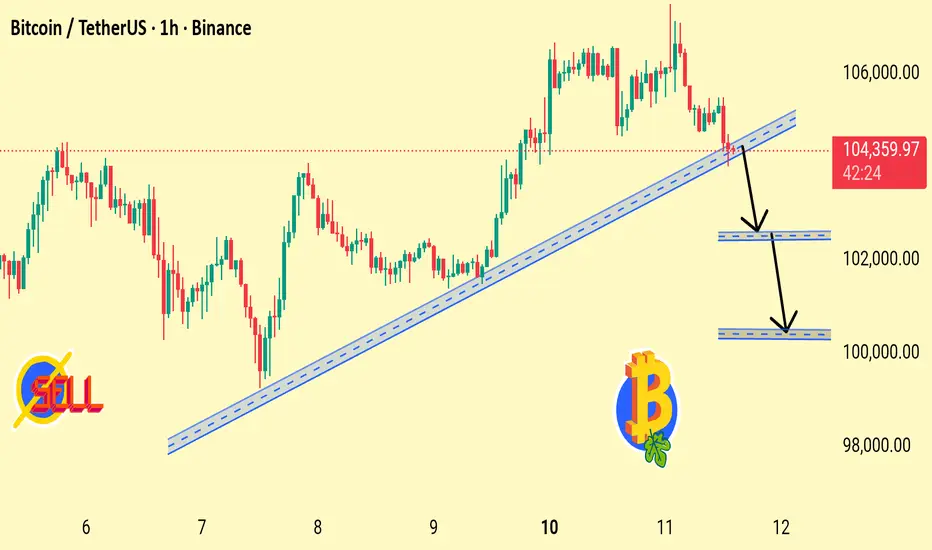
Bitcoin Losing Trendline Support Possible Drop Toward Key DemandBTC has broken below the rising trendline, signaling weakening bullish momentum. Price may retest $102,500 and potentially dip toward the $100,000 support zone if sellers continue to dominate.
1. Trendline Break Detected
BTC has fallen below the rising trendline that supported the uptrend from Nov 7
Bitcoin - New falling wedge! (no one talks about, must see)Bitcoin is forming a brand new falling wedge pattern no one really talks about! This falling wedge pattern is not complete, and it will take another week to see the whole pattern, but what we see now is the first skeleton of the pattern. Of course this is great because we can enter a short position

BTCUSD: Bulls Defend $102K Zone — Eyeing Breakout Toward $107KHello everyone, here is my breakdown of the current Bitcoin setup.
Market Analysis
BTCUSD is trading within a well-defined triangle formation after a period of volatile movements between $102,500 and $107,000. The chart shows that price recently rebounded from the Triangle Support Line, aligning

Bitcoin enters weekly Gaussian channel - November 2025And the Bulls have until November 17th to undo that, or else…
An alarm recently triggered, an alarm that had been completely forgotten about. That alarm has a message written to myself:
“Bitcoin price action enters weekly Gaussian channel. Look left - DO NOT IGNORE”
We look left, and pause, “

BTC BREAKING NEWS OR BREAKING CHARTS?📰 BREAKING NEWS OR BREAKING CHARTS?
TRUMP IMPOSES TARIFFS, CAUSING A BITCOIN BLOODBATH — $20,000 DRAWDOWN IN 2 HOURS!
Bitcoin was sitting comfortably at $121,000, before a sudden macro shock — triggered by newly imposed U.S. tariffs — sent prices spiraling down to $100,000 in a matter of hou

BTCUSD Bulls Aim Higher: Buyers Eye Breakout Toward $107,500Hello traders! Let’s take a look at the current BTCUSD structure. After an extended corrective phase within a descending movement, the market found solid support near the $100,000–$100,200 Buyer Zone, which aligns with both the horizontal Support Level and the lower boundary of the broader structure

Bitcoin Roadmap => Short-termOver the past few days, Bitcoin ( BINANCE:BTCUSDT ) has been reacting quite sharply to recent news, showing some unexpectedly strong moves. So, first and foremost, it's a good idea to keep risk management in mind and be prepared for various scenarios .
At the moment, Bitcoin is approaching a

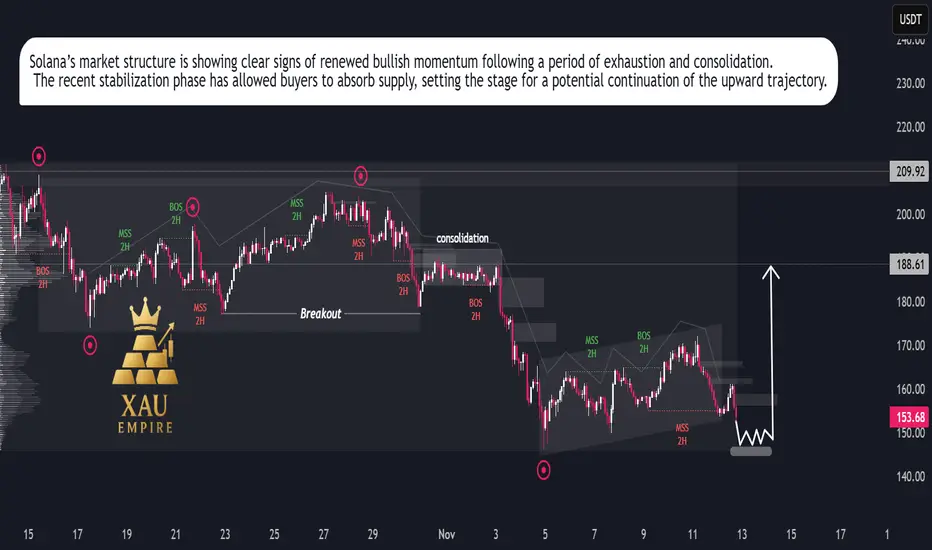
SOL/USDT – Bullish Momentum Rising, Rally Setup in ProgressSolana is showing renewed strength after an extended corrective phase, suggesting that the recent slowdown was a temporary reaccumulation rather than the start of a new downtrend. Price action has begun to stabilize, reflecting growing investor confidence and increasing participation from buyers at
See all crypto ideas
#XAUUSD: Upcoming Massive Swing Sell, Do Not Miss Out! **Overview on Gold – 12/11/2025**🏆
Gold has reversed from a key level, indicating a sustained bullish trend until it reaches the previous higher high zone. A minor correction may occur before bulls regain control and push the price towards our ‘premium selling zone’.
**Key Points and Strategy**🧠📊

Gold: Bullish Momentum Pauses Before the Next Move Gold: Bullish Momentum Pauses Before the Next Move
Gold kicked off the week with an aggressive rally, recovering nearly 50% of the previous drop from 4380 to 3880 in just 24 hours.
Price is now testing a key resistance area around 4130–4150, where we’re seeing a short-term pause in momentum. Thi

Lingrid | GOLD Potential Channel Retest. Long From SupportOANDA:XAUUSD is climbing back above the broken range structure and retested the 4,150 zone while maintaining bullish pressure from the recent breakout. The chart shows price riding along the upward trendline and forming a higher-low structure beneath the descending trendline. A clean hold above 4,1

XAUUSD Retests Resistance — Pullback Toward $4,060 SupportHello traders! Let’s take a look at XAUUSD (Gold). After a prolonged bullish movement within a well-defined ascending channel, price reached a significant Resistance Level near $4,200, where sellers stepped in to regain control. This resistance coincides with the upper boundary of a descending resis

Is Gold Attempting to go back to Previous ATH?Hey Traders, in today's trading session we are monitoring XAUUSD for a buying opportunity around 4,220 zone, Gold is trading in an uptrend and currently is in a correction phase in which it is approaching the trend at 4,220 support and resistance area.
Trade safe, Joe.

GOLD H1 – Awaiting CPI Data for Next Big Move🟡 XAUUSD – Intraday Smart Money Plan | by Ryan_TitanTrader (12/11)
📈 Market Context
Gold remains in a controlled retracement phase after a strong impulsive leg last week. The market is now consolidating within a defined 1H range, showing clear reactions near short-term EMAs as traders await today’s

Gold 30-Min — Volume Buy & Sell Reversals Triggered⚡Base : Hanzo Trading Alpha Algorithm
The algorithm calculates volatility displacement vs liquidity recovery, identifying where probability meets imbalance.
It trades only where precision, volume, and manipulation intersect —only logic.
✈️ Technical Reasons
/ Direction — LONG / Reversal 4178
☄️Bu

GOLD → Consolidation above 4100...FX:XAUUSD consolidates above $4,100 ahead of a key vote in the US House of Representatives on reopening the government. The rise is supported by weak employment data and expectations of Fed policy easing...
Key factors: Losses of more than 11,000 jobs per week until the end of October have hei

XAUUSD (Gold/USD) Buy Signal – 4H Timeframe
Entry: 4,130
Stop Loss: 4,110
Take Profit: 4,170
Risk–Reward Ratio: 1 : 2
Price is currently retesting the 4,125–4,165 resistance zone after a strong bullish run, showing signs of continuation. A confirmed breakout and close above 4,130 indicate strong buying momentum toward 4,170.
The RSI is aro

XAUUSD-GOLD-4H / at a Crossroads: Symmetrical Triangle AnalysisDear Traders,
I’ve prepared a special XAUUSD–gold analysis for you. Gold is currently moving within a symmetrical triangle formation. If gold breaks upward within this triangle and closes a candle, the first target will be the 4160 level. If it breaks downward, the first target will be the 3800 l

See all futures ideas
EURUSDHello Traders! 👋
What are your thoughts on EURUSD?
After a correction and a successful rebound from the support zone and the ascending trendline, EUR/USD has started to recover upward and is now approaching the descending trendline.
At this stage, the price is expected to break above the descending

USDJPY 30-Min — Volume Buy & Sell Reversals Triggered⚡Base : Hanzo Trading Alpha Algorithm
The algorithm calculates volatility displacement vs liquidity recovery, identifying where probability meets imbalance.
It trades only where precision, volume, and manipulation intersect —only logic.
✈️ Technical Reasons
/ Direction — Buy / Reversal 154.150 Are

EUR/USD | EURO Under Pressure Below 1.16, Watch for Further DropBy analyzing the EUR/USD chart on the 6-hour timeframe, we can see that the price climbed to 1.16060 but faced resistance at that supply zone, leading to a pullback.
It’s now trading around 1.15740, and if the price fails to break back above 1.1600, we could see further downside, possibly toward lev
EUR/USD Ready for Lift-Off from Ascending SupportThe EUR/USD pair is testing a strong ascending trendline near 1.1565, signaling a potential bullish rebound. A breakout above 1.1585 could trigger upward momentum toward 1.1620, aligning with the bullish setup shown by the rocket illustration.
1. Ascending Trendline Support
The chart shows a clear

EUR/USD – Falling Wedge Breakout | Bulls Eye Key Resistance ZoneTICKMILL:EURUSD The EUR/USD Pair , Price has been trading within a Wedge Pattern on the H1 chart, forming consistent higher highs and higher lows. Price action is now testing the upper boundary of the Pattern, signalling a possible breakout.
✅Market Context:
1️⃣Strong Upward Structure Inside t

GBP/USD – Head & Shoulders Pattern (13.11.2025)🧠 Setup Overview FX:GBPUSD
GBP/USD is forming a Head & Shoulders pattern on the 1H chart — a classical bullish reversal structure after a prolonged downtrend.
Price is currently holding above the right-shoulder support zone, showing early signs of accumulation. A breakout above the neckline wou

USD/JPY Bullish trend breakdown selling from supply zone USD/JPY Technical Update – 15M Timeframe 📈
Trend: Bullish trend showing signs of a potential pullback.
Price Action:
Triple top formation identified around 154.900 – potential selling zone.
Watch for price reaction from this supply area.
Technical Targets (Support Levels):
1. 154.500
2. 154

GBP/CHF: Bearish Trend ContinuesGBPCHF is currently experiencing a significant bearish trend.
After setting a new low, the market started to consolidate within a narrow parallel channel on the 4-hour chart.
The violation of its resistance level indicates a continuation of this downward movement.
I anticipate a further drop to 1

GBPCHF Sterling Slips as Swiss Franc Regains Safe-Haven StrengthGBPCHF continues to drift lower within a well-defined descending channel, reflecting renewed Swiss franc strength amid cautious global sentiment and persistent pressure on the British pound. The latest rebound toward 1.0600 appears corrective, with sellers likely to step back in as risk appetite fad

GBPUSD: Highly Probable +1400 Pips Trading Setup! Dear Traders,
📌GBPUSD has shown strong bullish momentum, with price action indicating upward pushes. However, caution is advised as temporary pullbacks are possible before sustained rallies resume. The pair’s movement is influenced by the US Dollar Index (DXY), which is showing signs of potential w

See all forex ideas
| - | - | - | - | - | - | - | ||
| - | - | - | - | - | - | - | ||
| - | - | - | - | - | - | - | ||
| - | - | - | - | - | - | - | ||
| - | - | - | - | - | - | - | ||
| - | - | - | - | - | - | - | ||
| - | - | - | - | - | - | - | ||
| - | - | - | - | - | - | - |
Trade directly on the supercharts through our supported, fully-verified and user-reviewed brokers.


