Silver bull will try to throw you off, but long term healthyA pause that could refresh might be warranted in silver and gold.
I am still optimistic for precious metals long term.
Silver is still undervalued based on historical metrics and money supply.
I worry about the rise in metals and what it implies for the broad stock market indices.

The best trades require research, then commitment.
Get started for free$0 forever, no credit card needed

Scott "Kidd" PoteetThe unlikely astronaut

Where the world does markets
Join 100 million traders and investors taking the future into their own hands.

Gold Analysis: Break Above $4,293 Could Trigger a New HighHi guys!
Gold has been moving inside a clear ascending channel, respecting both its upper and lower boundaries. Recently, we saw a double top formation near the upper trendline , which triggered a corrective move down to the $4,190–$4,200 support zone, an area that has already shown strong buying

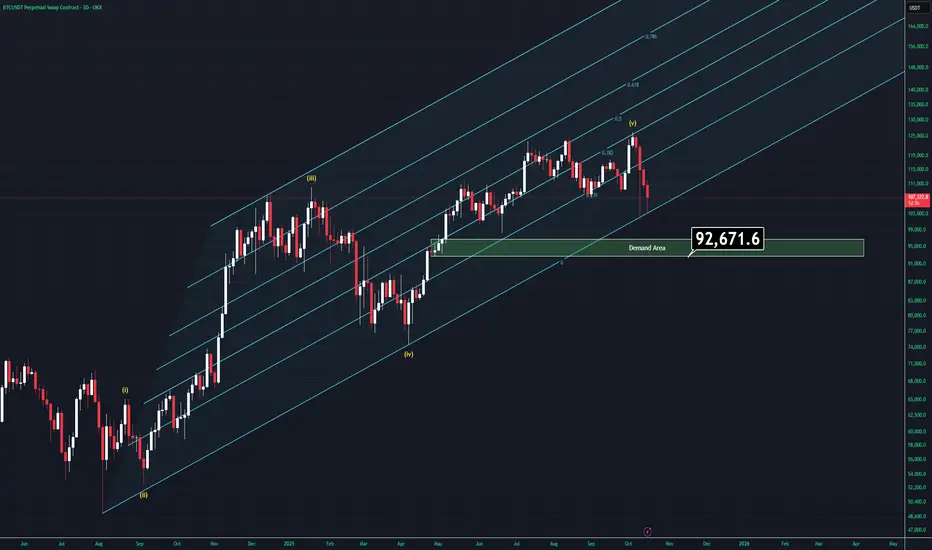
Moment of Fate - BTC Analysis (3D)There are many reasons to go up but also going down is starting to look way more charming than ever right now.
Let's examine what we have;
-FED is about to cut rates for a second time but we'll most likely to see another rate cut in december which is bullish af.
-All companies are keeping buying
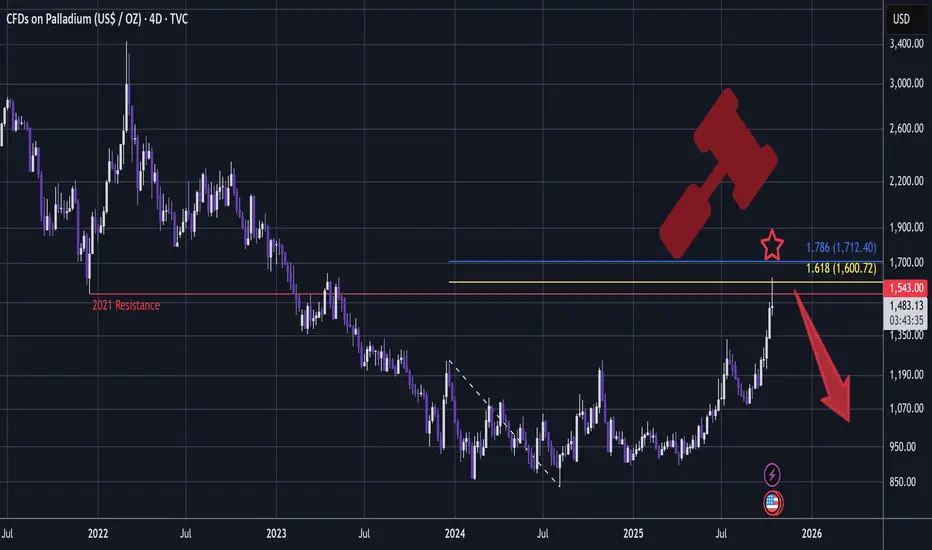
PALLADIUM - Short Setup, Bearish Rotation In MetalsA very bearish setup is developing:
Since the top, there is nowhere on the chart that has a whipsawing candle like this:
A very big Shooting Star!
This setup has my favourite conditions met:
- Whipsawing candle that sweeps liquidity through key resistance (2021)
- Tidy 1.618 Golden Window (1.6
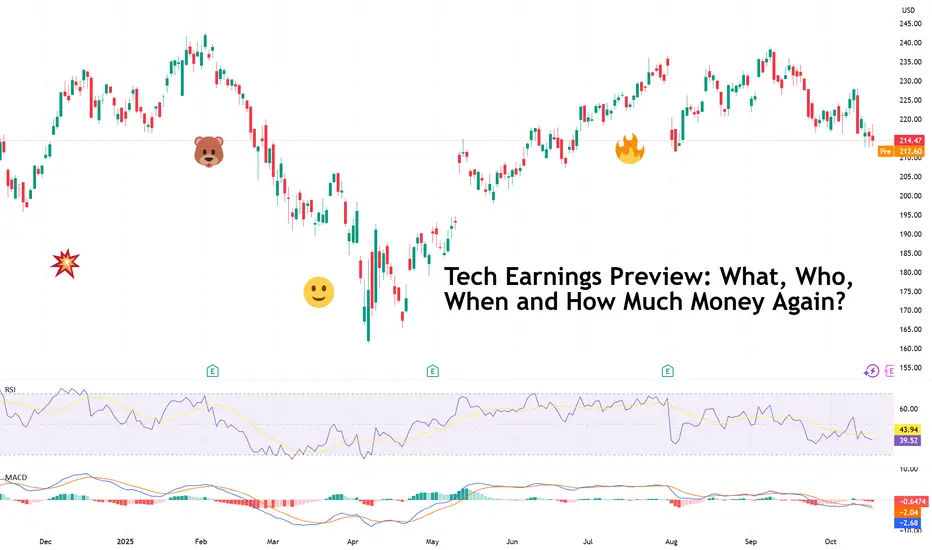
Tech Earnings Preview: What, Who, When and How Much Money Again?“ I don’t know, probably at least around $600 gazillion dollars ,” Zuck, probably if you asked him how much Meta NASDAQ:META will spend over the fiscal year.
It’s earnings season , which means Wall Street’s most expensive hobby — guessing how much the tech giants will make while pretending it’s
Tesla (TSLA) — Momentum Reload or Major Cooldown?The Next $400–$450 Decision Zone!
🧭 Weekly Chart — Big Picture Momentum
Tesla has printed one of the cleanest BOS (Break of Structure) patterns on the weekly timeframe since the post-2023 recovery, confirming that the macro downtrend has flipped into a sustained bullish expansion. The stock ripped

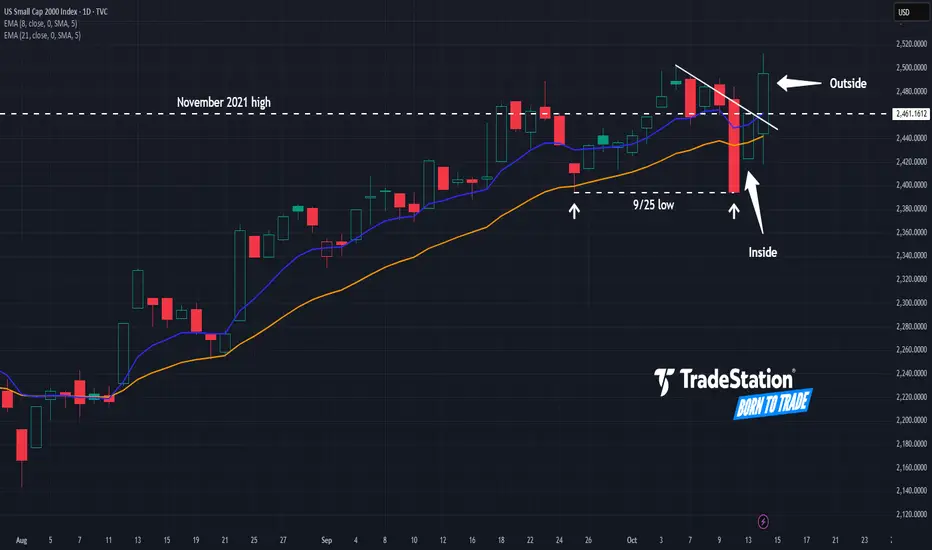
Small Caps: Finally a Breakout?The Russell 2000 has been stuck in a rut for years, but some traders may think the small-cap index has finally achieved escape velocity.
The first pattern on today’s chart is the November 2021 high around 2,460, where prices stalled last November. RUT has gotten above it this month and refused to s
“I Am Become Meme, Destroyer of Short-Sellers”: Gold at $4,200Remember those days where you could short gold and turn a profit? They’re gone. The precious metal is relentlessly pushing higher, breaking every short-seller’s dreams and portfolio.
It’s official — gold has gone full meme. The shiny metal that your grandparents swore by is now trending on Reddit

Gold/Oil Signaling Market Is In A Super Bubble Gold = Fear
Oil = how strong the economy is.
Except for COVID we have never seen such an extreme reading. Yet people are buying up stocks like we will never again be able to produce another stock again as long as we live!
Tulips!
Here are just a few of the factors to consider that make this indic

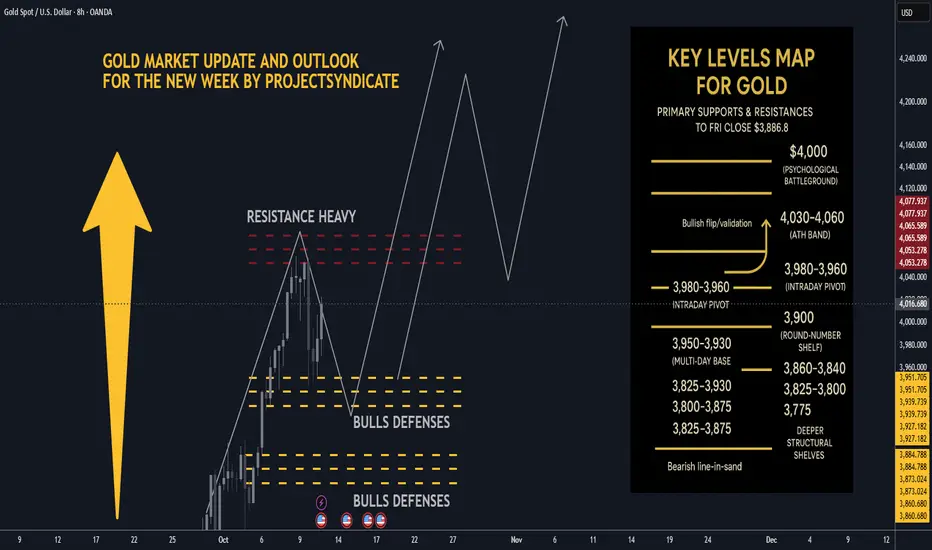
Gold next week: Key S/R Levels and Outlook for Traders🏆 Friday’s Close & Recent ATH:
Gold XAUUSD closed Friday around ~$3,990–$4,020/oz depending on venue most consolidated feeds show prints near $3.99–$4.02k at Friday close. The nearest recent intraday highs printed in the $4,030–$4,060 area across data providers this week, putting $4,000 as the imm
See all editors' picks ideas
Adaptive Volume Delta Map---
📊 Adaptive Volume Delta Map (AVDM)
What is Adaptive Volume Delta Map (AVDM)?
The Adaptive Volume Delta Map (AVDM) is a smart, multi-timeframe indicator that visualizes buy and sell volume imbalances directly on the chart.
It adapts automatically to the best available data resolution

Dynamic Equity Allocation Model"Cash is Trash"? Not Always. Here's Why Science Beats Guesswork.
Every retail trader knows the frustration: you draw support and resistance lines, you spot patterns, you follow market gurus on social media—and still, when the next bear market hits, your portfolio bleeds red. Meanwhile, institution

First Passage Time - Distribution AnalysisThe First Passage Time (FPT) Distribution Analysis indicator is a sophisticated probabilistic tool that answers one of the most critical questions in trading: "How long will it take for price to reach my target, and what are the odds of getting there first?"
Unlike traditional technical indicators

PongExperience PONG! The classic arcade game, now on your charts!
With this indicator, you can finally achieve your lifelong dream of beating the Markets. . . at PONG!
Pong is jam-packed with features! Such as:
2 Paddles
A moving dot
Floating numbers
The idea of a net
This indicator is solel

Options Max Pain Calculator [BackQuant]Options Max Pain Calculator
A visualization tool that models option expiry dynamics by calculating "max pain" levels, displaying synthetic open interest curves, gamma exposure profiles, and pin-risk zones to help identify where market makers have the least payout exposure.
What is Max Pain?
Max

Volume Profile 3D (Zeiierman)█ Overview
Volume Profile 3D (Zeiierman) is a next-generation volume profile that renders market participation as a 3D-style profile directly on your chart. Instead of flat histograms, you get a depth-aware profile with parallax, gradient transparency, and bull/bear separation, so you can see w

RiskMetrics█ OVERVIEW
This library is a tool for Pine programmers that provides functions for calculating risk-adjusted performance metrics on periodic price returns. The calculations used by this library's functions closely mirror those the Broker Emulator uses to calculate strategy performance metrics (

Simple Decesion Matrix Classification Algorithm [SS]Hello everyone,
It has been a while since I posted an indicator, so thought I would share this project I did for fun.
This indicator is an attempt to develop a pseudo Random Forest classification decision matrix model for Pinescript.
This is not a full, robust Random Forest model by any stretch o

Tick CVD [Kioseff Trading]Hello!
This script "Tick CVD" employs live tick data to calculate CVD and volume delta! No tick chart required.
Features
Live price ticks are recorded
CVD calculated using live ticks
Delta calculated using live ticks
Tick-based HMA, WMA, EMA, or SMA for CVD and price
Key tick levels (S

analytics_tablesLibrary "analytics_tables"
📝 Description
This library provides the implementation of several performance-related statistics and metrics, presented in the form of tables.
The metrics shown in the afforementioned tables where developed during the past years of my in-depth analalysis of various str

See all indicators and strategies
Community trends
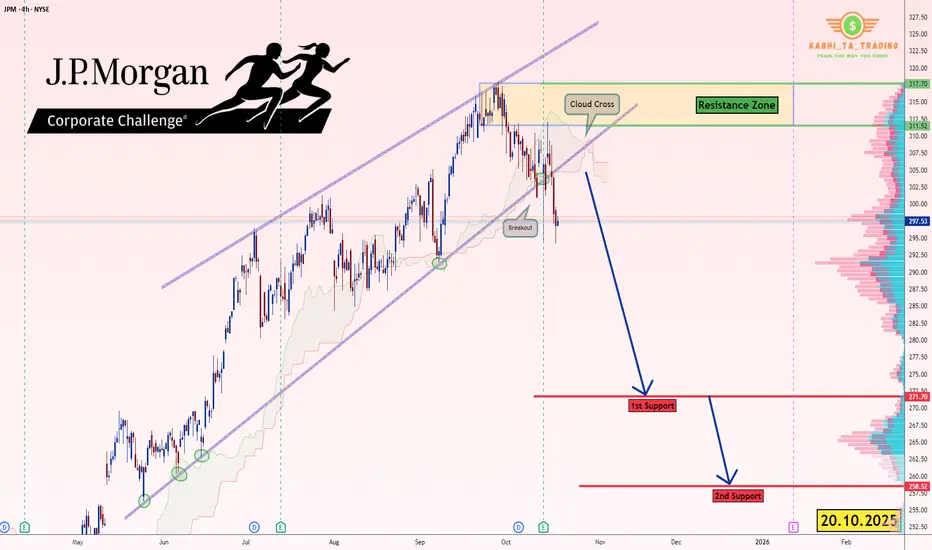
JP Morgan (JPM) - H4 - Breakout Pattern (20.10.2025)📊 Setup Overview:
J.P. Morgan ( NYSE:JPM ), presenting a bearish outlook based on the price action.
📈 Trade Plan:
Bias: Bearish below $310
1st Target: $272 ✅
2nd Target: $258.52 🎯
Resistance Zone: $311 – $318
🧩 Technical Confluence:
1.Price Breaks the Wedge Pattern.
2.Trendline break confirm
RIOT: strong trend pump?Having the narrative of Bitcoin mine company that transform it’s facilities to become AI data center.
PA previous monthly candle closed, broken out of a 2 years consolidation bullish flag to the upside.
If this is turn out to be a start of a strong trend/fomo pumping price action ,
Potential ups

TSLA – Sideways Accumulation Phase Ahead of Major NewsTesla’s stock is currently showing a stable sideways movement around the 430–445 USD range as the market awaits the company’s Q3 earnings report (on October 22).
Recent news reflects cautious investor sentiment , especially after ISS recommended rejecting Elon Musk’s massive compensation packa

Meta - The major triangle rejection!💡Meta ( NASDAQ:META ) will reverse soon:
🔎Analysis summary:
Just a couple of months ago we witnessed a textbook all time high break and retest on Meta. This retest was followed by a major rejection higher and the second retest of the triangle resistance trendline. Therefore, Meta is very like

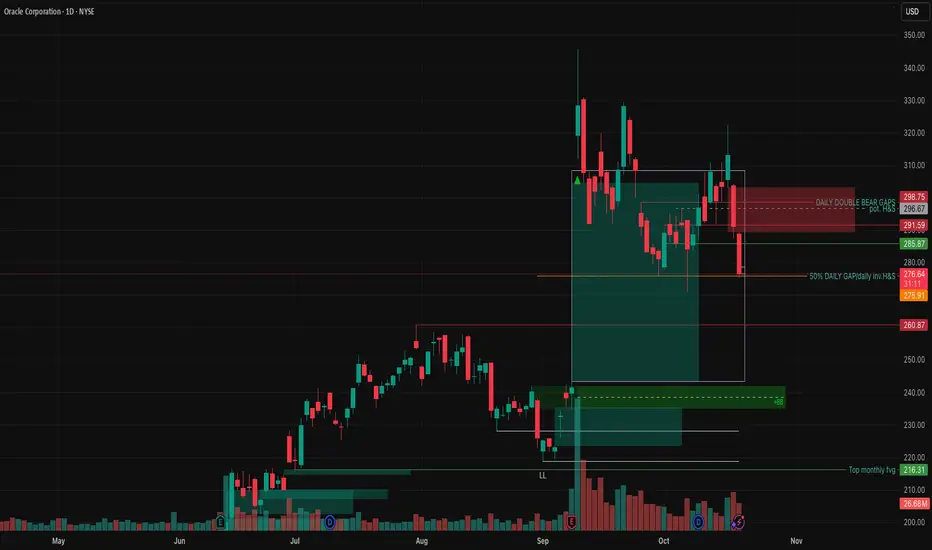
Inverted H&S on ORCL DailyThere is solid support on ORCL in this bottom range for a bounce. Also inverted H&S on top of being 50% of the fair value gap up on the daily that was previously created. NYSE:ORCL
IOT watch $36.60: Golden Genesis fib to hold for key Higher LowIOT correcting since it hit ATH above 60 bucks.
Now testing a proven Golden Genesis at $38.60
Lookng for a clean Break-n-Retest for long entries.

MP MATERIALS LONG / 20.10.25Made the videO, 'cause I'm a lazy typer. Sound on to hear my explanation. Let me know why you agree/disagree with my analysis

Possible break out coming in the next few weeksGot a few support level at play, if these support levels are respected could mean we could have an upside. Ascending wedge is also forming so that could signal some upside as well.

PLTR Retracement x Gaza Reconciliation - Oct 20, 2025 Idea - CY PLTR Retracement x Gaza Reconciliation - Oct 20, 2025 Idea - CY

Breaking: Beyond Meat, Inc. (NYSE: $BYND) Spike 54% Today The price of Beyond Meat, Inc. (NASDAQ: NASDAQ:BYND ) Spike 54% in Monday's premarket trading with the asset gearing a move to the $1 resistant zone.
Technically, there's still room to achieve this fit as the stock is trading below key moving averages.
Similarly, the Relative strength index (RS

See all stocks ideas
Today
ELVElevance Health, Inc.
Actual
6.03
USD
Estimate
4.93
USD
Today
DHRDanaher Corporation
Actual
1.89
USD
Estimate
1.72
USD
Today
PEBOPeoples Bancorp Inc.
Actual
—
Estimate
0.83
USD
Today
MMM3M Company
Actual
2.19
USD
Estimate
2.07
USD
Today
PHMPulteGroup, Inc.
Actual
2.96
USD
Estimate
2.89
USD
Today
ACUAcme
Actual
—
Estimate
0.54
USD
Today
EFXEquifax, Inc.
Actual
—
Estimate
1.94
USD
Today
GMGeneral Motors Company
Actual
—
Estimate
2.29
USD
See more events
Community trends
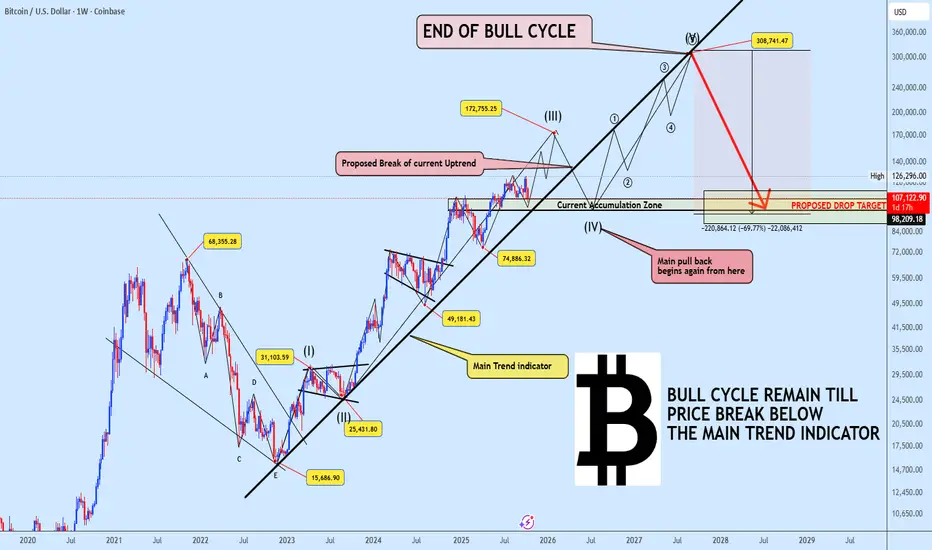
BITCOIN The Super Cycle Still Unfolding Wave 3 in Motion!Bitcoin continues to respect the Main Trend Indicator, keeping the broader super cycle wave (3) intact. Based on our projection, the ongoing bullish leg is expected to complete near $172,000, marking the end of wave (III).
From there, we anticipate a corrective wave (IV) to unfold likely breaking b
Inverse Head & Shoulders on Bitcoin – Breakout or Bull Trap?Right now, Bitcoin ( BINANCE:BTCUSDT ) is moving within its Heavy Support zone($111,980-$105,820) .
Over the past couple of days, it tried twice to break this area but couldn’t. One big reason is that recently, there was news that Japan is considering allowing banks to invest in crypto . Also,

BTCUSD – Three Drives Pattern + RSI DivergenceHi Teams!
Bitcoin has recently completed a three-drive pattern while also showing a clear bearish divergence on the RSI. This confluence has led to a strong rejection from the third drive area, confirming short-term weakness.
The three-drive trendline was broken last night, signaling that the bull

The 3 KEYS to Trading SUCCESSToday we will discuss about the 3 Keys I believe are required for succeeding in trading.
When you enter into the trading field, you quickly understand that it’s not just about charts and setups — it’s about mastering yourself mentally.
There are 3 keys that separate those who last from those

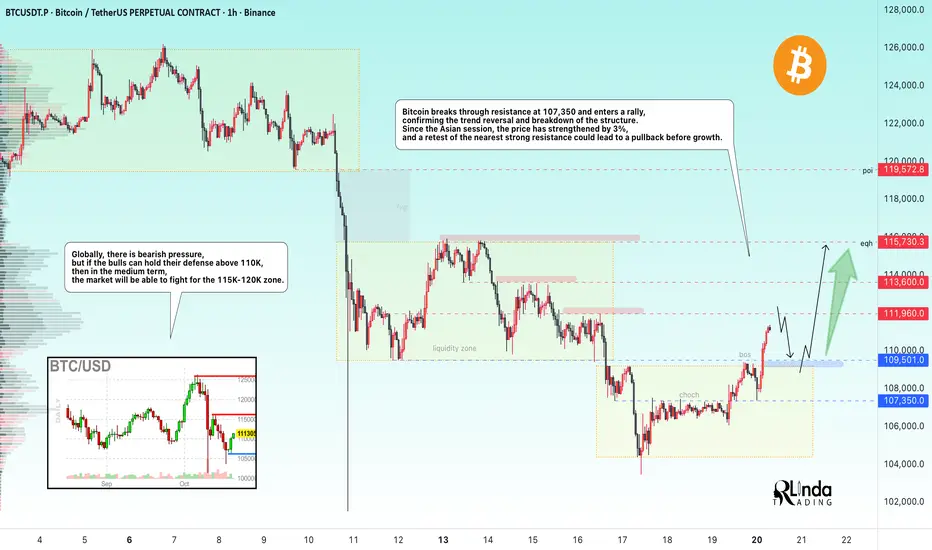
BITCOIN → Trend reversal. Is there a chance for growth?BINANCE:BTCUSDT.P is breaking the trend and local market structure, forming a rally. Giving hope to buyers, we see a strong reaction from the Asian session. Are the bulls returning?
The fundamental background is unstable; if Trump continues to escalate the trade war, the cryptocurrency market
BTC/USDT | BTC Update – Testing the $112K Barrier!By analyzing the #Bitcoin chart on the 12-hour timeframe, we can see that after finding strong support near $103,500 , BTC has continued its recovery and recently reached $111,700 . The key question now is whether the price can break decisively above the $112K resistance zone.
The $103K–$1

BTCUSDT: Short Setup Active Below $110,700Hello everyone, here is my breakdown of the current Bitcoin setup.
Market Analysis
On the 1H timeframe, Bitcoin continues to move inside a descending channel, maintaining a clear bearish structure.
After multiple tests and breakouts, the price is still unable to break through the Resistance Area a

ETH: Another Attempt To Resume Upward MovementETH: Another Attempt To Resume Upward Movement
Ethereum is showing strong bullish momentum after forming a bullish flag pattern on the chart. The price has broken above the flag, confirming the potential for further upside movement.
As long as ETH stays above the breakout zone, the next target le

Lingrid | BTCUSDT Consolidation Period Following CorrectionBINANCE:BTCUSDT remains under heavy pressure after a sharp rebound from 102K met resistance near the 114K–115K zone. The market continues to respect its downward structure within the broad descending channel, suggesting sellers are still in control. A rejection around the trendline could confirm a

Ethereum’s Hidden Fractal Points to $33K by November 2026Most of the space seems to think that the bull market is officially over, that the four-year cycle has come to a close. For most of the cycle, I have thought that way too. 1,064 days is up, and that’s the longest a Bitcoin cycle has ever gone for. So, the idea that the same thing will play out again

See all crypto ideas
Gold Analysis: Break Above $4,293 Could Trigger a New HighHi guys!
Gold has been moving inside a clear ascending channel, respecting both its upper and lower boundaries. Recently, we saw a double top formation near the upper trendline , which triggered a corrective move down to the $4,190–$4,200 support zone, an area that has already shown strong buying
Gold Pullback Could Be the Next Buying OpportunityHello, traders, I want share with you my opinion about Gold. The market for Gold has been trading within a clear bullish structure, forming an ascending channel since breaking out from the earlier range near the 4,050–4,100 zone. The breakout from that consolidation led to strong upward momentum, wi

Gold Extends Its 8-Week Winning Streak👋Hello everyone, what are your thoughts on OANDA:XAUUSD ?
Over the past week, gold prices climbed close to the $4,400 mark before pulling back sharply and closing the week around $4,250, up $223 from the weekly open of $4,022 — nearly a 6% gain, marking the eighth consecutive week of growth. Des
Lingrid | GOLD Weekly Analysis: Pullback From Record HighsThe price perfectly fulfilled my previous weekly idea . OANDA:XAUUSD market continues to navigate through considerable volatility as it pulls back from the recent spike that tested zone below the $4,400 resistance zone. After achieving a new all-time high, the metal is now experiencing natural se

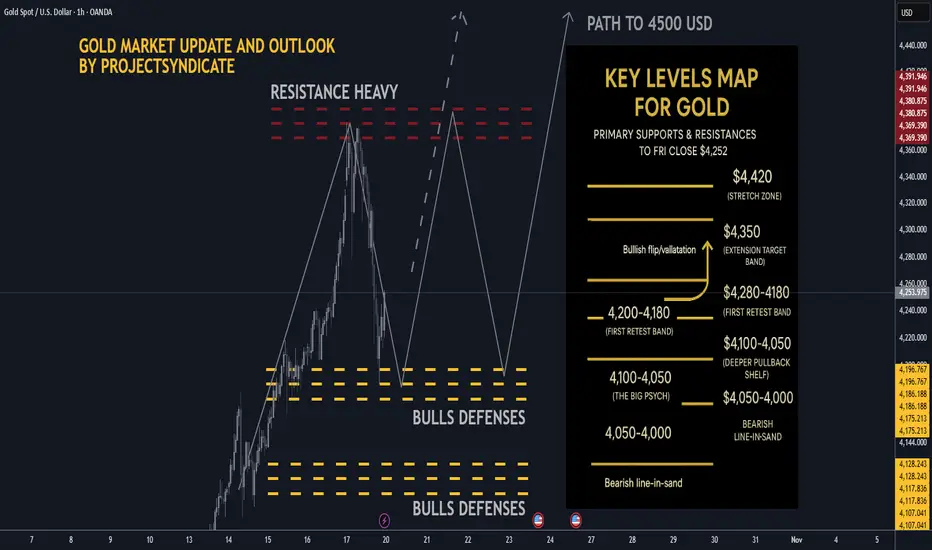
Gold next week: Key S/R Levels and Outlook for Traders🔥 GOLD WEEKLY SNAPSHOT — BY PROJECTSYNDICATE
🏆 High/Close: $4,379 → ~$4,252 — higher close vs. last week’s pullback finish.
📈 Trend: Uptrend intact > $4,000; dip buyers continue to control rhythm.
🛡 Supports: $4,180–$4,140 → $4,100–$4,050 → $4,000 must hold.
🚧 Resistances: $4,260 / $4,300 / $4,3
GOLD 1H CHART ROUTE MAP UPDATE & TRADING PLAN FOR THE WEEKHey Everyone,
Please see our updated 1h chart levels and targets for the coming week.
We are seeing price play between two weighted levels with a gap above at 4275 and a gap below at 4229. We will need to see ema5 cross and lock on either weighted level to determine the next range.
We will see le

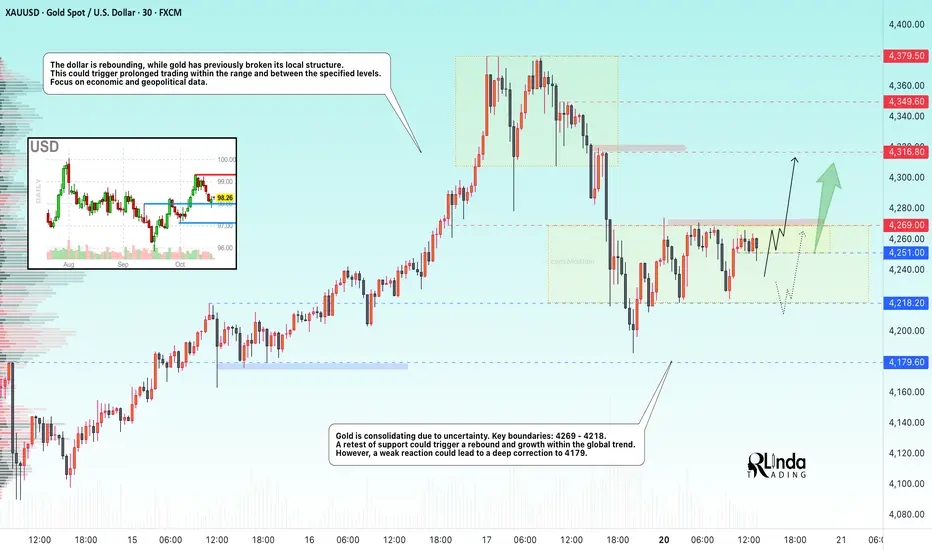
GOLD → Consolidation. 4269 - trigger. Chances for growth?Gold is consolidating due to uncertainty. On Friday, the market broke its local structure, which slightly changed sentiment. Focus on current consolidation.
Key drivers of the week: Trump's threat to impose 100% tariffs on Chinese imports and China's response supported demand for safe havens.
Gold Consolidates Before Next MoveGold Consolidates Before Next Move
Gold is currently showing a short-term correction after reaching the $4,380 area. The price has pulled back as expected near $4180, and remains above this strong key support area.
From the current data we have, the price could rise from the market price where it

THE KOG REPORTTHE KOG REPORT:
In last week’s KOG Report we gave the bias level as bullish above 4003 and the red box we would be looking for to break to then confirm the move into the region we wanted. The move played well from the opening going on to complete all the red box targets together with our algo targ

( HANZO Gold Protocol ) Bullish Reversal DetectedStatus: Active Reversal Protocol
Symbol: Gold
Session: London–New York Overlap (Smart Exit Window)
➕Bias: Bullish Reversal
Goal: Controlled with minimal drawdown
Tactical Edge: Reversal Protocol through liquidity engineering
Confidence Level: ★★★★★ (Smart Money Aligned)
☄️4270 Bullish Reversal
See all futures ideas
NZDUSD I Weekly CLS Range I Model 1 - TP 50% Hi friends, new range created. As always we are looking for the manipulation in to the key level around the range. Don't forget confirmation switch from manipulation phase to the distribution phase to make the setup valid. Stay patient and enter only after change in order flow. If price reaches 50%

USD/CAD: Bearish Reversal Confirmed!?The 📉USDCAD pair has broken and closed below a significant intraday horizontal support level.
The blue area, which is underlined, is also the neckline of a cup and handle pattern.
This violation suggests the potential for a continued downward movement.
The subsequent support level is anticipated

GBPUSD 1H Analysis: Bearish Pressure Builds After Break 📊 GBPUSD – 1 Hour Analysis (SELL)
Technical Outlook:
Bullish momentum is fading, and selling pressure is building after the recent break.
My trade plan is on the SELL side; target level: 1.33564 📉
Fundamental Analysis:
On the U.S. side, the strong dollar narrative and the Fed’s data‑driven

GBP/USD - Fundamental Drive Ahead! (21.10.2025)🧠 Setup Overview:
GBP/USD has broken below its rising trendline after testing the 1.3470 resistance zone multiple times. The pair is under fundamental selling pressure, fueled by risk aversion and renewed U.S. dollar strength.
Fundamental Drivers:
1️⃣ U.S. markets gained as President Trump decided

EURUSD – Structure Analysis (4H Chart)EURUSD – Structure Analysis (4H Chart)
On the EURUSD chart you can find a well-defined structure analysis with key support and resistance areas highlighted.
At the moment, the pair is trading near 1.1650, positioned between a support zone at 1.1630 and a resistance zone around 1.1720.
If price h

USDJPY – Yen Weakens as Japan Forms New Coalition👋Hello everyone, what are your thoughts on FX:USDJPY ?
At the start of the new week, USDJPY is showing interesting movements following news that Japan’s ruling Liberal Democratic Party (LDP) and the Japan Innovation Party have agreed to form a coalition government. This development paves the way

Euro will likely Continue its Decline to 1.1560 pointsHello traders, I want share with you my opinion about Euro. The market for the Euro has seen a significant shift in its structure, following a 'fake breakout' above the 1.1780 Resistance Level which led to a new ATH near 1.1920. This reversal initiated a new bearish phase, with the price action for

GBPJPY Eyes 202.900 Resistance as Correction Meets Downtrend!Hey Traders, in tomorrow’s trading session we are monitoring GBPJPY for a potential selling opportunity around the 202.900 zone. The pair remains within a broader downtrend and is currently in a corrective phase, approaching a key resistance area near 202.900 that aligns with the descending trend st

EUR/USD (Euro vs U.S. Dollar) chart Pattern this is a 4-hour..EUR/USD (Euro vs U.S. Dollar) chart Pattern this is a 4-hour timeframe Ichimoku Cloud, and my marked two target levels labeled “Target Point.”
Here’s the breakdown:
Current price: around 1.1660 – 1.1670
Structure: price has broken above a descending trendline and is holding above the Ichimoku cl

USD/JPY – Buy Entry (H1- Channel Breakout Pattern)
The USD/JPY Pair, Price has been trading within a Channel Breakout Pattern on the H1 chart, forming consistent higher highs and higher lows. Price action is now testing the upper boundary of the Pattern, signalling a possible breakout. FX:USDJPY
✅Market Context:
1️⃣Strong Upward Structure Insi

See all forex ideas
| - | - | - | - | - | - | - | ||
| - | - | - | - | - | - | - | ||
| - | - | - | - | - | - | - | ||
| - | - | - | - | - | - | - | ||
| - | - | - | - | - | - | - | ||
| - | - | - | - | - | - | - | ||
| - | - | - | - | - | - | - | ||
| - | - | - | - | - | - | - |
Trade directly on the supercharts through our supported, fully-verified and user-reviewed brokers.


