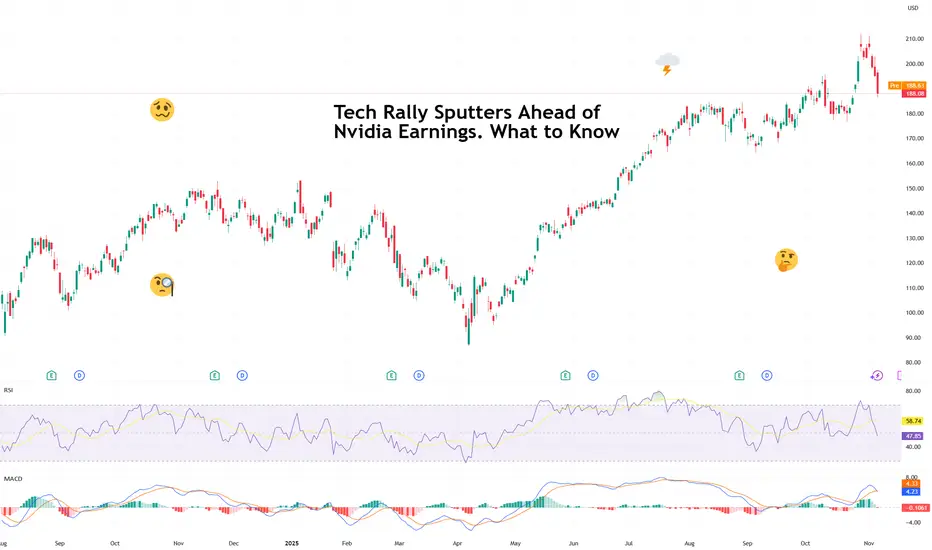
Tech Rally Sputters Ahead of Nvidia Earnings. What to KnowIs the powerful AI sector finally out of breath? With valuations that stretched, some investors fear if we all took it too far.
After months of seemingly unstoppable gains, the tech trade is finally showing signs of fatigue. Stocks are back in the red this week, with technology — the sector that’s

The best trades require research, then commitment.
Get started for free$0 forever, no credit card needed

Scott "Kidd" PoteetThe unlikely astronaut

Where the world does markets
Join 100 million traders and investors taking the future into their own hands.
Nvidia: Acceleration Toward New Highs Nvidia gained strong upward momentum shortly after our last update, surging past the $196.45 mark, which had previously served as resistance. As a result, our prior short-term alternative scenario was triggered, and we have now adjusted the chart accordingly (with minor modifications). We now view t

BITCOIN – LEVELS TO WATCHTraders,
We dumped. Now we are in a controlled recovery. The question is not only “are we going up” but “where will the market make its real decision.” Right now the chart is giving us two very clean checkpoints.
1. What happened
We lost the weekly open and sold off.
Spot was selling too, so

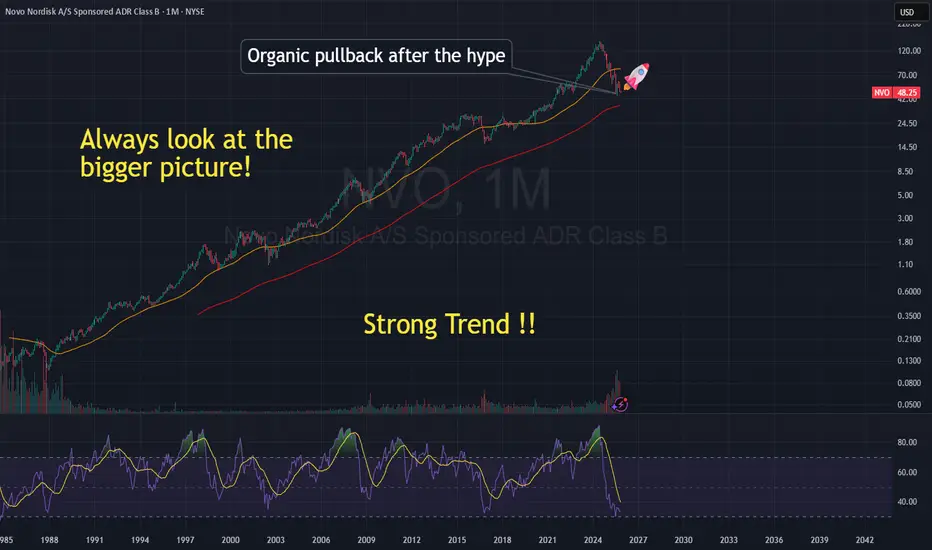
$NVO Last opportunity!🌱 Novo Nordisk: A Healthy Pullback in a Long-Term Growth Story
After years of remarkable growth, Novo Nordisk (NYSE: NVO) has seen its stock cool off — sliding from over 💲130 to around 💲49. At first glance, that might look alarming, but the reality is far more balanced. What we’re seeing is an or
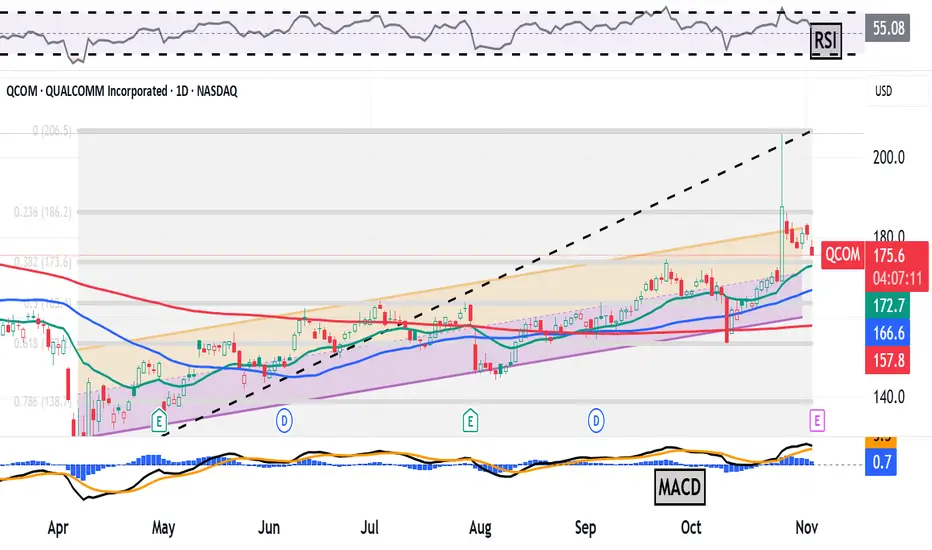
Qualcomm Rose 11% in One Day on AI Plans. What Its Chart SaysSemiconductor designer Qualcomm NASDAQ:QCOM , which is known for providing products to the consumer-electronics industry, rose more than 11% to a 15-month high in a single day last week when it announced a pivot into the world of artificial intelligence. Let's see what QCOM's chart and fundamental
Peak Tech Earnings Wrapped Up: Here Are the Winners and LosersWe're past that time when we all get glued to the dual-monitor setup and watch the titans of tech parade their financials.
Last week was the Super Bowl of earnings season, with Meta NASDAQ:META , Microsoft NASDAQ:MSFT , Alphabet NASDAQ:GOOGL , Apple NASDAQ:AAPL , and Amazon NASDAQ:AMZN all re

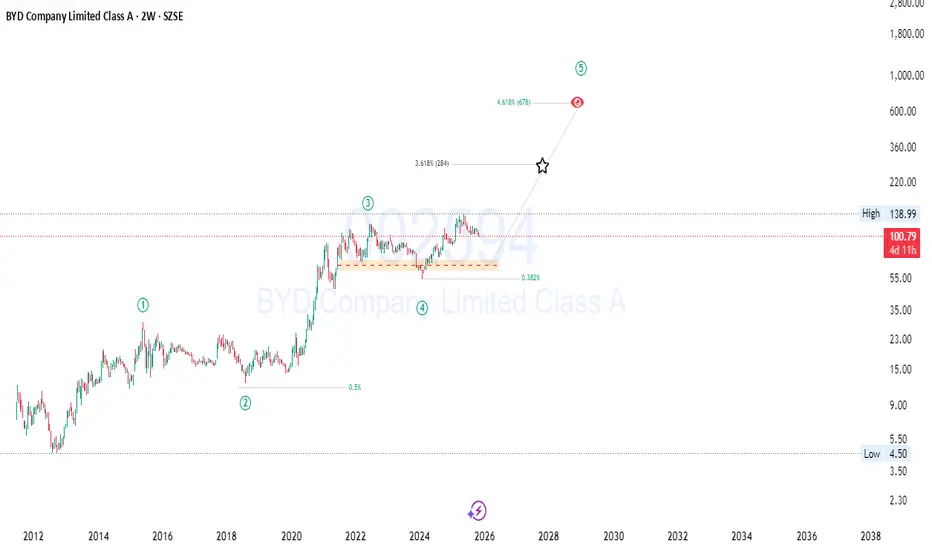
BYD : Smart Money Loading Before a Massive Wave 5 Breakout🚀 BYD Company Limited Class A (SZSE: 002594) — Wave 5 Expansion Setup
Big structure, clean levels, and solid fundamentals… Wave 5 might surprise a lot of people 👇
BYD has been quietly building strength, and the chart now suggests that the next major bullish wave could be setting up. After a
Busy trading week coming up!!The trading week of November 3–7 is considered a pivotal period for international financial markets. A series of high-level economic data including manufacturing and services PMIs, ADP non-farm payrolls, trade balances, and interest rate decisions from major central banks will create a mixed picture

EUR/AUD downside pressure intensifiesEUR/AUD finds itself just above a key zone consisting of horizontal support at 1.7600 and the key 200-day moving average, providing decent two-way trade setups depending on how the near-term price action evolves.
Should we see a break and close beneath both levels, it would allow for shorts to be e

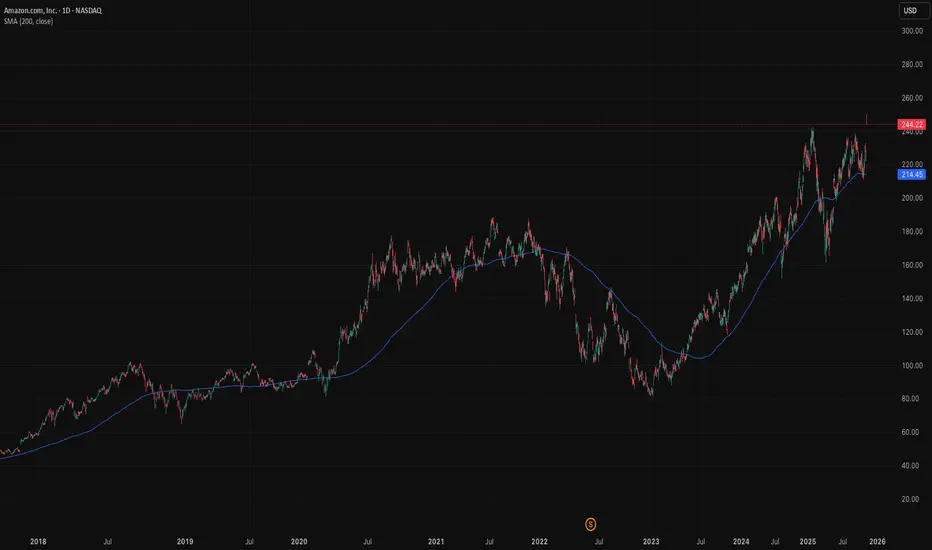
Bullish on Amazon as the tide turns backAmazon’s recent job cuts aren’t a sign of weakness, they’re a strategic recalibration. The company is shifting from broad expansion to focused execution. In the AI era, scale isn’t just about size, it’s about precision.
Amazon has trimmed roles across Alexa, devices, and some corporate functions. T
See all editors' picks ideas
PriceFormatLibrary for automatically converting price values to formatted strings
matching the same format that TradingView uses to display open/high/low/close prices on the chart.
█ OVERVIEW
This library is intended for Pine Coders who are authors of scripts that display numbers onto a user's charts. T

LogNormalLibrary "LogNormal"
A collection of functions used to model skewed distributions as log-normal.
Prices are commonly modeled using log-normal distributions (ie. Black-Scholes) because they exhibit multiplicative changes with long tails; skewed exponential growth and high variance. This approach i

Range Oscillator (Zeiierman)█ Overview
Range Oscillator (Zeiierman) is a dynamic market oscillator designed to visualize how far the price is trading relative to its equilibrium range. Instead of relying on traditional overbought/oversold thresholds, it uses adaptive range detection and heatmap coloring to reveal where pri

Volume Surprise [LuxAlgo]The Volume Surprise tool displays the trading volume alongside the expected volume at that time, allowing users to spot unexpected trading activity on the chart easily.
The tool includes an extrapolation of the estimated volume for future periods, allowing forecasting future trading activity.
🔶 U

Smooth Theil-SenI wanted to build a Theil-Sen estimator that could run on more than one bar and produce smoother output than the standard implementation. Theil-Sen regression is a non-parametric method that calculates the median slope between all pairs of points in your dataset, which makes it extremely robust to o

Fair Value Gaps by DGTFair Value Gaps
A refined, multi-timeframe Fair Value Gap (FVG) detection tool that brings institutional imbalance zones to life directly on your chart.
Designed for precision, it visualizes how price delivers into inefficiencies across chart, higher, and lower (intrabar) timeframes — offering a fl

TASC 2025.11 The Points and Line Chart█ OVERVIEW
This script implements the Points and Line Chart described by Mohamed Ashraf Mahfouz and Mohamed Meregy in the November 2025 edition of the TASC Traders' Tips , "Efficient Display of Irregular Time Series”. This novel chart type interprets regular time series chart data to create an ir

Simplified Percentile ClusteringSimplified Percentile Clustering (SPC) is a clustering system for trend regime analysis.
Instead of relying on heavy iterative algorithms such as k-means, SPC takes a deterministic approach: it uses percentiles and running averages to form cluster centers directly from the data, producing smoo

Adaptive Volume Delta Map---
📊 Adaptive Volume Delta Map (AVDM)
What is Adaptive Volume Delta Map (AVDM)?
The Adaptive Volume Delta Map (AVDM) is a smart, multi-timeframe indicator that visualizes buy and sell volume imbalances directly on the chart.
It adapts automatically to the best available data resolution

Dynamic Equity Allocation Model"Cash is Trash"? Not Always. Here's Why Science Beats Guesswork.
Every retail trader knows the frustration: you draw support and resistance lines, you spot patterns, you follow market gurus on social media—and still, when the next bear market hits, your portfolio bleeds red. Meanwhile, institution

See all indicators and strategies
Community trends
Duolingo - Time to BuyWe are finally long Duolingo at this drop to $210, the Wave of this move in a ascending speakerphone pattern. A strong beat and raise and yet we anticipated this large drop. If $200 is lost, I will get stopped out of this trade.
Follow my linked trade on why I shorted the top all those months ago.

TSLA Triple TopTriple tops = market drop!
As soon as the market tanks, TSLA is in major trouble!
For 5 long years, people have been trying to pump this stock with no good results. Instead, they got a -75% decline and a -66% decline for their efforts.
This stock will fall bidless! All hype with no substance.
Th

Nvidia: Acceleration Toward New Highs Nvidia gained strong upward momentum shortly after our last update, surging past the $196.45 mark, which had previously served as resistance. As a result, our prior short-term alternative scenario was triggered, and we have now adjusted the chart accordingly (with minor modifications). We now view t
Robinhood - The third bearish crackdown!🏹Robinhood ( NASDAQ:HOOD ) will crash quite soon:
🔎Analysis summary:
Since we witnessed a major botton on Robinhood in 2023, this stock has been rallying about +1,600%. But always after a major +250% rally, Robinhood corrected at least -40%. Therefore it is quite likely that we will see anoth

AMC SHORT SETUPThere is a strong support at $2.50—.
Stochastic is deeply oversold so I expect a bounce at the support.
The entry for the short I'm looking at is the box between $2.67 and $2.94, which lines up with the downtrend and the fibonnaci levels.
I like to keep the setups simple and low leverage.
Let

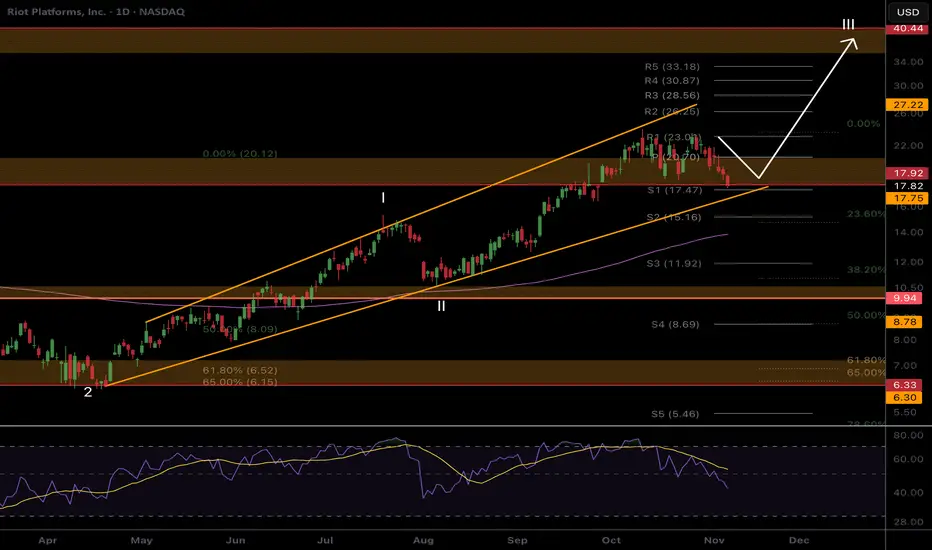
RIOT Respecting the boundariesPrice remains in its uptrend channel demonstrating shallow pullbacks as is characteristic of wave III.
Price is consolidating above support which could lead to a break down below but still within the boundaries of the channel. Daily 200EMA is ascending to meet price and support lines.
Daily RSI ha
TESLA PT-2 TRILLION DOLLAR PAY CHECKI hope everything is clear now. I have exited all positions here and I am not going into news.
Elon is not going to tell me where my money is going
NOTE:NOT TRADING TSLA

D- Best Wave Quantum ^.^^I love D Wave.
It rings the bell of riding 2nd wave under AI hot trend.
Although company is not making profit yet.
Technicals are favoring this stock.
Greenbar bounces back from $16 support
Although there is a downward cross of 60MA and 20MA.
I think market still love D Wave.
It might break previ

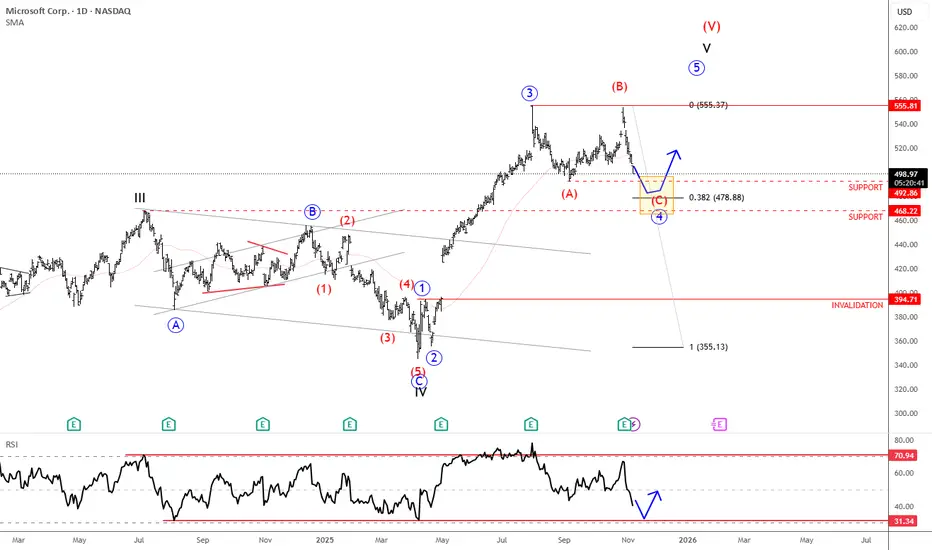
Microsoft Is Finishing Wave 4 CorrectionMicrosoft is in a wave 4 correction, and once it's fully completed, it can extend the rally within wave 5 from a technical point of view and according to Elliott wave theory.
Microsoft is a global technology company founded by Bill Gates and Paul Allen in 1975. It’s best known for its Windows ope
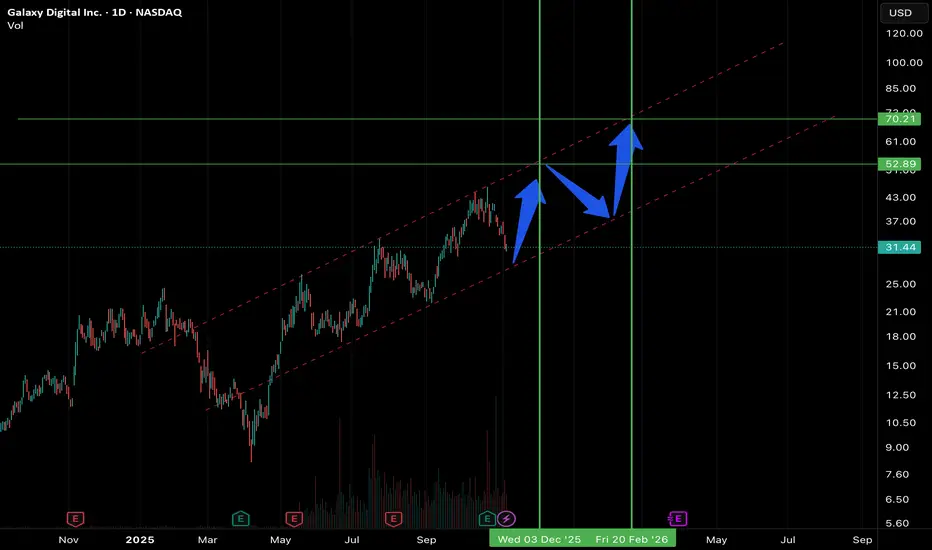
The Future Is Here — #GLXY to the Moon🚀 **The Future Is Here — GLXY to the Moon!** 🌕
Don’t miss the next big wave in digital finance. Galaxy Digital (GLXY) is shaping the future of crypto infrastructure and institutional adoption.
📅 **Price Targets:**
* **Dec 3, 2025:** $52
* **Feb 20, 2026:** $70
💡 Smart investors buy the dip — not
See all stocks ideas
Today
AIRSAirSculpt Technologies, Inc.
Actual
−0.04
USD
Estimate
−0.02
USD
Today
SNWVSANUWAVE Health, Inc.
Actual
0.46
USD
Estimate
0.32
USD
Today
ESNTEssent Group Ltd.
Actual
1.67
USD
Estimate
1.77
USD
Today
CNHCNH Industrial N.V.
Actual
0.08
USD
Estimate
0.13
USD
Today
ANIPANI Pharmaceuticals, Inc.
Actual
2.04
USD
Estimate
1.77
USD
Today
KKRKKR & Co. Inc.
Actual
1.41
USD
Estimate
1.30
USD
Today
DIBS1stdibs.com, Inc.
Actual
−0.10
USD
Estimate
−0.13
USD
Today
DKLDelek Logistics Partners, L.P.
Actual
0.85
USD
Estimate
1.04
USD
See more events
Community trends
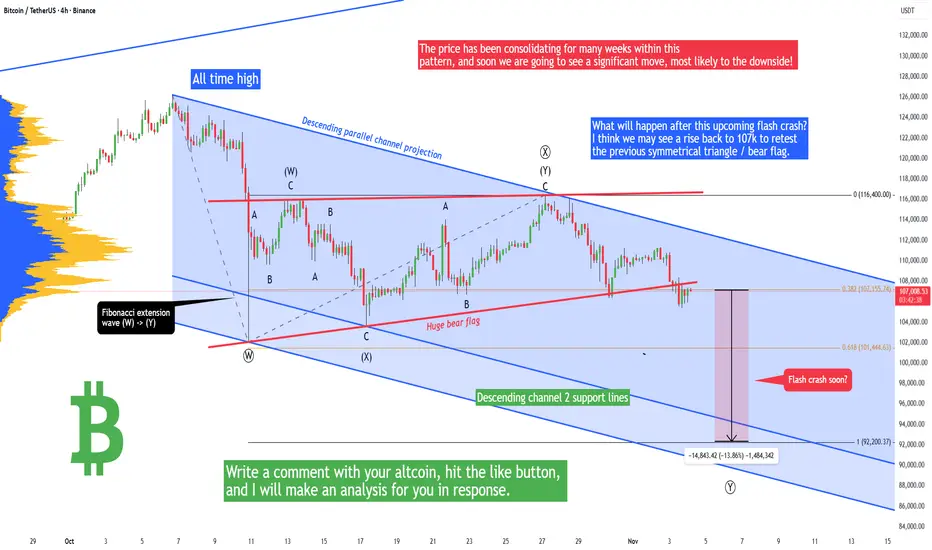
Bitcoin - Warning! Flash crash soon (BEAR FLAG)Bitcoin recently formed a symmetrical triangle, but the bulls made a false breakout above it, which is a huge problem because this symmetrical triangle pretty much transformed into a bearish flag, and that's a very bearish pattern! The price has been consolidating for many weeks within this pattern,
Bitcoin Bulls Target $113K**Bitcoin (BTC/USD) Analysis — November 2025**
Bitcoin has been moving within a controlled downtrend channel, facing continuous lower highs since late October. The market recently went through a **liquidity sweep**, followed by a minor **market structure shift (MSS)** on the 3-hour timeframe. This

BITCOIN – LEVELS TO WATCHTraders,
We dumped. Now we are in a controlled recovery. The question is not only “are we going up” but “where will the market make its real decision.” Right now the chart is giving us two very clean checkpoints.
1. What happened
We lost the weekly open and sold off.
Spot was selling too, so
BITCOIN → The hunt for liquidity before the decline BINANCE:BTCUSDT is testing the 100K area and updating its local minimum to 98,900 as part of another liquidation. The market is weak, and bulls are trying to wait out the panic...
Bitcoin looks weak. After a sharp decline, a pullback is forming, during which the price may test the break-even a

Bitcoin: Testing the Edge of SupportBitcoin: Testing the Edge of Support
Bitcoin continues to face pressure after rejecting the 106,400 resistance zone.
Price is now hovering around a key support area near 103,500, which has acted as both support and resistance multiple times before.
A failed recovery from this zone could open the

BITCOIN 's Bear Cycle has started according to the Dollar.It is one of the oldest charts around. Bitcoin (BTCUSD) vs U.S. Dollar Index (DXY). And perhaps one of the most accurate or to phrase it better, one of the most informative.
As you can see, every time the DXY (black trend-line) bottoms and rebounds (green Arcs), BTC tops and corrects (red Arcs), in

BTCUSD: Falling Wedge Reversal in Play Toward 106KHello everyone, here is my breakdown of the current Bitcoin setup.
Market Analysis
Bitcoin (BTCUSD) has recently shown signs of recovering bullish momentum after rebounding from the 100,600–101,000 Support Zone, which has acted as a key demand region during previous tests. The market experienced

ICPUSDT - many positive indicators!The coin ICP has pumped nearly 160% in just one week, and believe it or not — all that move happened without even breaking out of the accumulation range it’s been forming for over 275 days.
So imagine what will happen once it finally breaks out!
The high volume and bullish indicators on the chart s

Bitcoin - Will History Repeat Itself Again?📈Bitcoin continues to follow a remarkably similar path to its previous market cycles. Each major bullish impulse has been followed by a controlled correction, a fakeout towards the lower trendline, and then a strong rebound toward new highs.
Looking closely at the current structure, BTC seems to be

Does this scenario cross your mind? What if…Does this scenario cross your mind? What if…
CRYPTOCAP:ETH drops below $3,000, maybe $2700, and everyone thinks it’s all over. Then, just as everyone is convinced the bears have won, ETH bounces back, shaking out the sceptics while most people stay on the sidelines. Meanwhile, Tether and the Bitc
See all crypto ideas
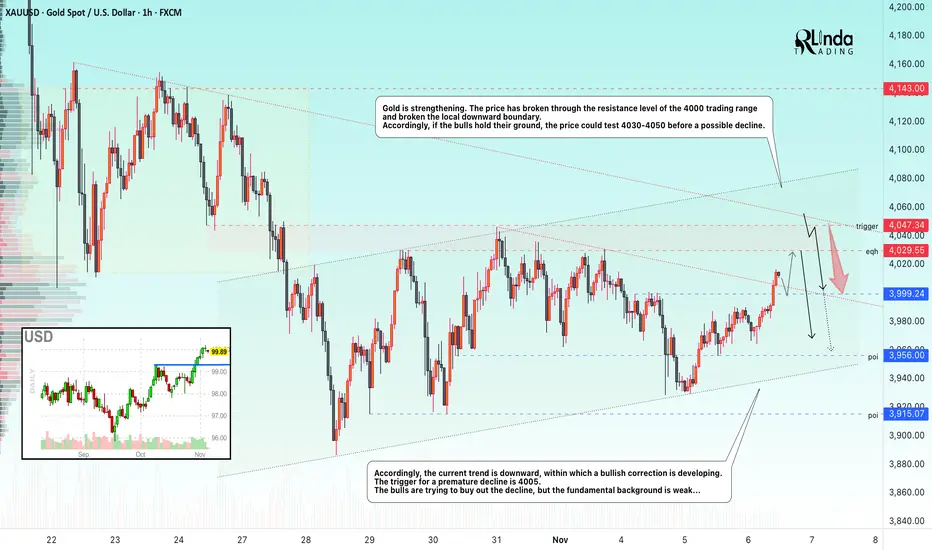
Lingrid | GOLD Market Consolidation Continues After DropOANDA:XAUUSD bounced from the channel base but remains capped under the downward trendline and the 4,080–4,100 supply band. Price action is carving a lower-high sequence within a falling channel after a failed retest, with a choppy mid-range consolidation. Below 4,080, sellers can press for 3,900 w

Gold Forms Higher Low — Potential Upside Toward Resistance LineHello traders, here’s my current outlook on Gold (XAUUSD). Gold has recently transitioned out of a strong bearish phase, where the price moved inside a descending channel and found significant support near the $3,930–$3,950 Buyer Zone. This support zone has proven to be a key reaction level multiple

XAUUSD – Gold Holds Its Momentum, Targeting 4,150 USDAfter a period of volatility, gold is gradually regaining its upward momentum as investors shift toward safe-haven assets despite strong U.S. employment data. This indicates that defensive capital flow continues to support the bullish outlook for the precious metal.
On the 4H timeframe, price remai

XAU/USD | Gold Rejected Again! Mid-Term Target Could Reach $3550By analyzing the Gold chart on the 2-hour timeframe, we can see that after the previous analysis, price started to rise but faced strong selling pressure when it entered the supply zone between $4016 and $4020.
Recently, Gold dropped to around $3978 and is now trading near $3990. The previous anal
GOLD → The market is trying to buy back the decline...FX:XAUUSD continues to consolidate in the $4000 zone, failing to develop a rebound in the middle of the week. The price remains in a sideways trend for the eighth day in a row, waiting for a driver that will finally move the price forward...
Reasons for market restraint:
Strong US data: grow
Safe-Haven Flows Push Gold Higher – Short-Term OutlookHello everyone,
Gold prices saw a surprisingly strong move yesterday, and if you only looked at the economic data, many would think this is “counterintuitive.” Let’s analyse and predict the short-term behaviour of gold today.
The US ADP report showed an increase of 42,000 jobs, exceeding expectat

XAUUSD: Buyers Target $4,080 Resistance ZoneHello everyone, here is my breakdown of the current Gold setup.
Market Analysis
Gold (XAUUSD) has recently formed a constructive bullish structure after rebounding from the 3,930–3,960 Buyer Zone, which aligns with the lower boundary of the Upward Channel. This demand zone has consistently acted

Gold 30Min Engaged ( Bullish Reversal Detected )Status: Active Reversal Protocol
Symbol: Gold
Session: London–New York Overlap (Smart Exit Window)
⚡Base : Hanzo Trading Alpha Algorithm
The algorithm calculates volatility displacement vs liquidity recovery, identifying where probability meets imbalance.
It trades only where precision, volume, an

Gold Price Breakout Above Trendline Targets 3980 Gold (XAU/USD) is showing bullish momentum, breaking above the trendline resistance around 4000. Price is currently near 4008, with potential pullback targets around 3980 and 3965 if retracement occurs. Trend remains positive above the rising trendline.

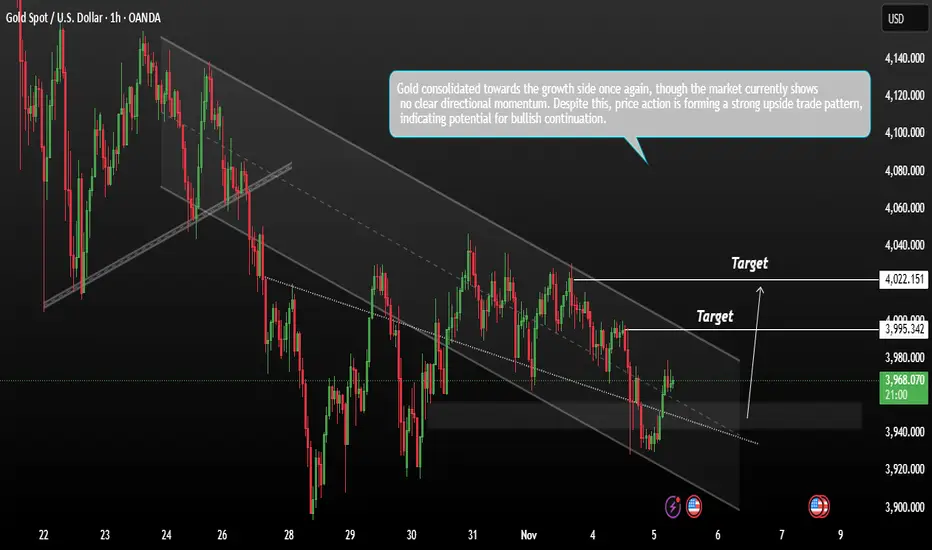
Gold consolidated towards the growth side once againGold consolidated towards the growth side once again, though the market currently shows no clear directional momentum. Despite this, price action is forming a strong upside trade pattern, indicating potential for bullish continuation.
Gold prices rose on Wednesday as bargain hunters stepped in afte
See all futures ideas
EURCAD – Buyers Gaining ControlPrice has formed what looks like an inverse head and shoulders pattern after an extended bearish leg, a strong sign of potential reversal.
The left shoulder, head, and right shoulder structure all show selling pressure fading and buyers gradually stepping in.
We’ve now seen a clean breakout above t

GBP/USD – BoE Rate Decision Ahead |(06.11.2025)🧠 Setup Overview:
GBP/USD is trading inside a descending channel, with price recently rebounding from a strong support zone near 1.3000.
Ahead of the Bank of England (BoE) interest rate decision, the pair is positioned for a possible bullish breakout if the BoE maintains rates and highlights inflat

EURUSD Holds Key Support — Potential Recovery Toward 1.1540Hello traders, I’d like to share my view on EURUSD. The market has been trading in a consistent downtrend, respecting the descending Resistance Line, which has acted as a strong dynamic barrier for price throughout the recent move. Each attempt to break above this trendline resulted in either a turn

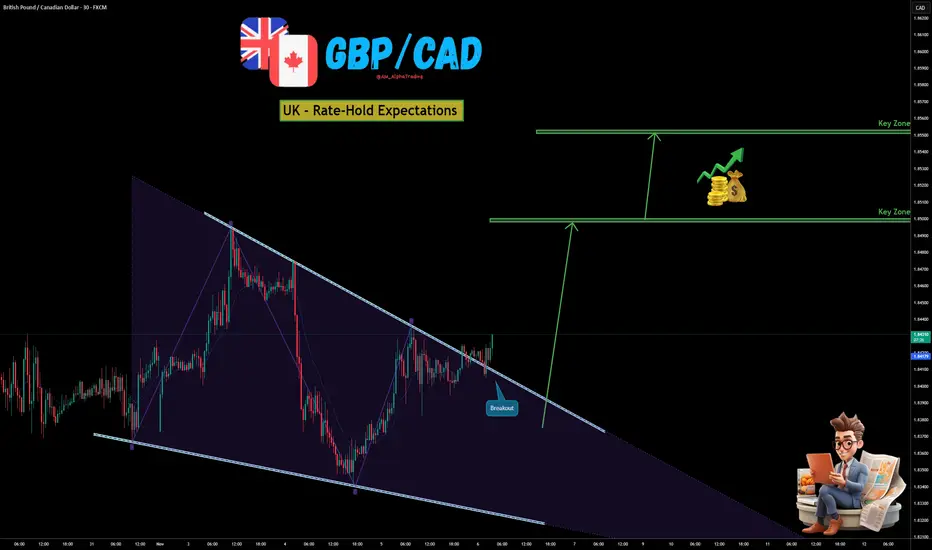
GBP/CAD - UK Rate Hold Expectations!The GBP/CAD Pair, Price has been trading within a Wedge Pattern on the M30 chart, forming consistent higher highs and higher lows. Price action is now testing the upper boundary of the Pattern, signalling a possible breakout.
✅Market Context:
1️⃣Strong Upward Structure Inside the Pattern.
2️⃣Buyer
GBPUSD Eyes 1.31000 Rejection as Fed Cut Bets Look Overstated!Hey Traders,
In today’s trading session, we’re monitoring GBPUSD for a selling opportunity around the 1.31000 zone. The pair remains within a broader downtrend and is currently in a correction phase, approaching a key resistance area where previous sell-side momentum originated.
Structure:
GBPUSD

EURCAD Reveals a Stunning Reversal You Can’t IgnoreHey everyone, Erik here.
EURCAD has been in a strong downtrend, though that bearish momentum is starting to lose its intensity. The market is now shaping what appears to be an inverse head and shoulders pattern, a classic sign that sellers may be running out of strength while buyers are beginning t

USD/JPY: Setup Screams Buying Opportunity—Are You Watching?The USDJPY pair may continue to ascend following a test of a robust support cluster, which consists of a horizontal range and a rising trend line on the daily chart.
Subsequent to the test of this support cluster, we observed a positive bullish reaction, accompanied by a bullish Change of Character

NZDUSD - Triple Confluence Zone in Play!NZDUSD has been in a steady bearish trend, but the pair is now reaching a major confluence area that could act as a strong turning point.
🔎The blue circle marks the intersection of two descending trendlines and a key demand zone, making it a massive area to look for long opportunities.
⚔️This tr

USD/JPY 30-Min — Volume Bullish Reversals Triggered⚡Base : Hanzo Trading Alpha Algorithm
The algorithm calculates volatility displacement vs liquidity recovery, identifying where probability meets imbalance.
It trades only where precision, volume, and manipulation intersect —only logic.
✈️ Technical Reasons
/ Direction — LONG / Reversal 153.260

EURUSD Long: Rebound Setup Targeting 1.1560 Pivot ResistanceHello traders! EURUSD continues to trade within a clearly defined descending channel, maintaining a consistent bearish structure characterized by lower highs and lower lows. The recent rejection from the 1.1660 Supply Zone once again confirmed strong seller presence at that level. Additionally, the

See all forex ideas
| - | - | - | - | - | - | - | ||
| - | - | - | - | - | - | - | ||
| - | - | - | - | - | - | - | ||
| - | - | - | - | - | - | - | ||
| - | - | - | - | - | - | - | ||
| - | - | - | - | - | - | - | ||
| - | - | - | - | - | - | - | ||
| - | - | - | - | - | - | - |
Trade directly on the supercharts through our supported, fully-verified and user-reviewed brokers.


