Peak Tech Earnings Wrapped Up: Here Are the Winners and LosersWe're past that time when we all get glued to the dual-monitor setup and watch the titans of tech parade their financials.
Last week was the Super Bowl of earnings season, with Meta NASDAQ:META , Microsoft NASDAQ:MSFT , Alphabet NASDAQ:GOOGL , Apple NASDAQ:AAPL , and Amazon NASDAQ:AMZN all re

The best trades require research, then commitment.
Get started for free$0 forever, no credit card needed

Scott "Kidd" PoteetThe unlikely astronaut

Where the world does markets
Join 100 million traders and investors taking the future into their own hands.

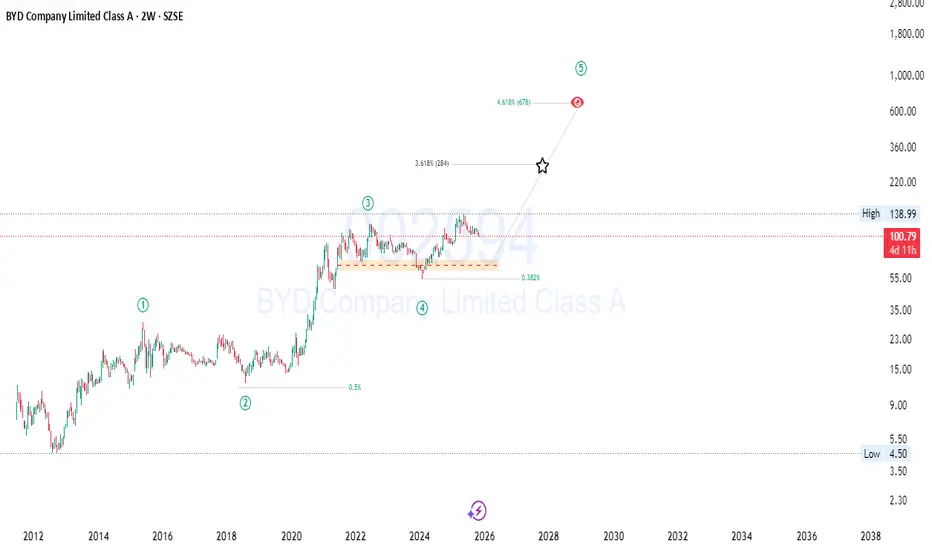
BYD : Smart Money Loading Before a Massive Wave 5 Breakout🚀 BYD Company Limited Class A (SZSE: 002594) — Wave 5 Expansion Setup
Big structure, clean levels, and solid fundamentals… Wave 5 might surprise a lot of people 👇
BYD has been quietly building strength, and the chart now suggests that the next major bullish wave could be setting up. After a
Busy trading week coming up!!The trading week of November 3–7 is considered a pivotal period for international financial markets. A series of high-level economic data including manufacturing and services PMIs, ADP non-farm payrolls, trade balances, and interest rate decisions from major central banks will create a mixed picture

EUR/AUD downside pressure intensifiesEUR/AUD finds itself just above a key zone consisting of horizontal support at 1.7600 and the key 200-day moving average, providing decent two-way trade setups depending on how the near-term price action evolves.
Should we see a break and close beneath both levels, it would allow for shorts to be e

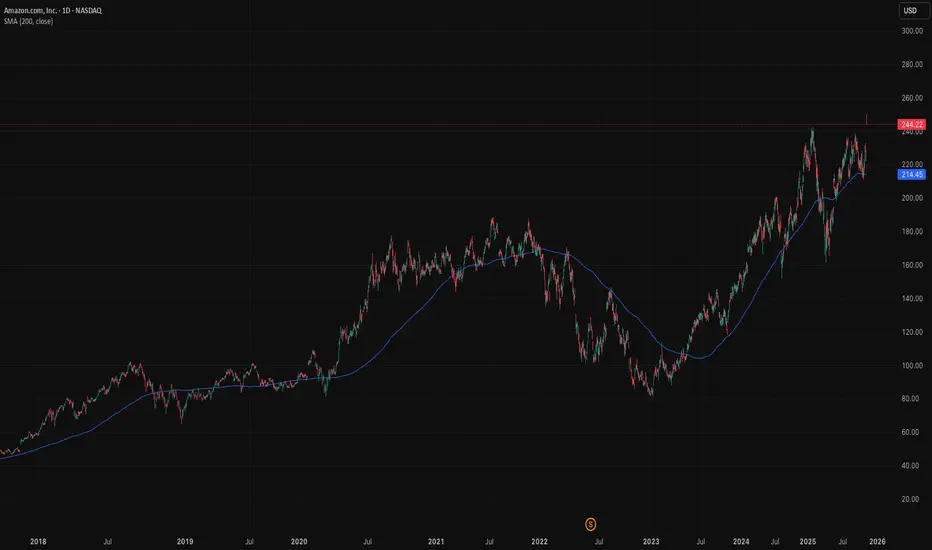
Bullish on Amazon as the tide turns backAmazon’s recent job cuts aren’t a sign of weakness, they’re a strategic recalibration. The company is shifting from broad expansion to focused execution. In the AI era, scale isn’t just about size, it’s about precision.
Amazon has trimmed roles across Alexa, devices, and some corporate functions. T
EUR/USD Under PressureEUR/USD Under Pressure
Today, the EUR/USD pair is trading around 1.1560, close to autumn lows. From this week’s high, the pair has fallen by roughly 0.85%, reflecting bearish pressure.
The main factors driving the decline are traders’ reactions to central bank signals:
→ Hawkish Fed rhetoric: On

NVIDIA – A New World First, Where Next?A mere 24 hours after Apple become the third company in history to reach a $4 trillion valuation, NVIDIA set a new benchmark by becoming the first company ever to register a market capitalisation of $5 trillion.
Despite concerns about over extended valuations, the news flow for NVIDIA was initiall

META: Next Long Term Buy Following a disappointing earnings report, Meta (META) dropped more than 10% in post-market trading, decisively breaking through several key support levels. My primary support zones are typically derived from anchored VWAPs (Volume-Weighted Average Prices), which help identify where institutional bu

XAUUSD Long: Demand Zone Holding, Eyes on $4,080Hello traders! Gold (XAUUSD) is currently showing a corrective phase within its broader bullish trend. After a strong rally from the $3,850 Demand Zone, price climbed steadily along the ascending Trend Line, forming higher highs and higher lows until reaching the $4,150–$4,180 Resistance Area. This

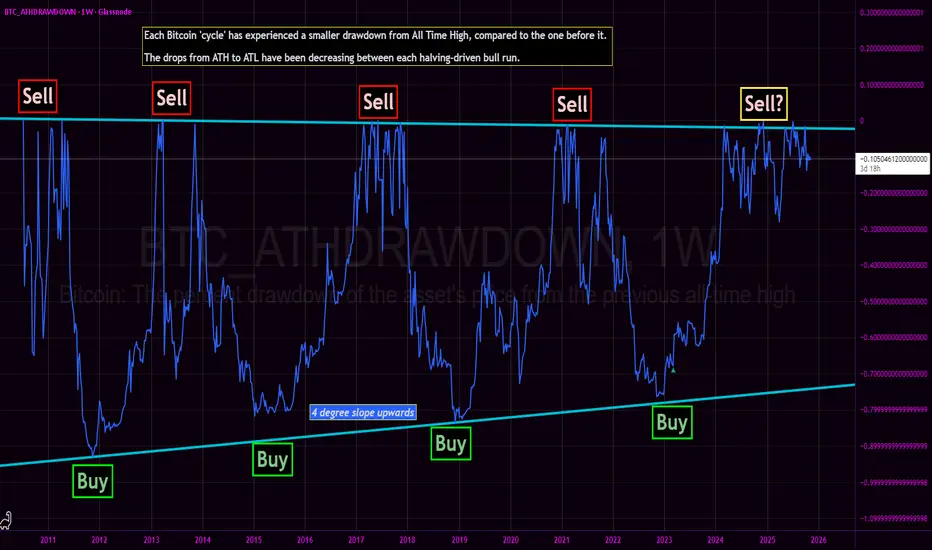
Bitcoin All Time High Drawdown - Bottom nowhere in sight?We revisit the Bitcoin All Time High Drawdown chart originally published in March 2023.
The core thesis of the BTC_ATHDRAWDOWN chart remains intact: each subsequent market cycle has exhibited a diminishing drawdown from its prior All-Time High, with generational cycle bottoms resting squarely on
See all editors' picks ideas
LogNormalLibrary "LogNormal"
A collection of functions used to model skewed distributions as log-normal.
Prices are commonly modeled using log-normal distributions (ie. Black-Scholes) because they exhibit multiplicative changes with long tails; skewed exponential growth and high variance. This approach i

Range Oscillator (Zeiierman)█ Overview
Range Oscillator (Zeiierman) is a dynamic market oscillator designed to visualize how far the price is trading relative to its equilibrium range. Instead of relying on traditional overbought/oversold thresholds, it uses adaptive range detection and heatmap coloring to reveal where pri

Volume Surprise [LuxAlgo]The Volume Surprise tool displays the trading volume alongside the expected volume at that time, allowing users to spot unexpected trading activity on the chart easily.
The tool includes an extrapolation of the estimated volume for future periods, allowing forecasting future trading activity.
🔶 U

Smooth Theil-SenI wanted to build a Theil-Sen estimator that could run on more than one bar and produce smoother output than the standard implementation. Theil-Sen regression is a non-parametric method that calculates the median slope between all pairs of points in your dataset, which makes it extremely robust to o

Fair Value Gaps by DGTFair Value Gaps
A refined, multi-timeframe Fair Value Gap (FVG) detection tool that brings institutional imbalance zones to life directly on your chart.
Designed for precision, it visualizes how price delivers into inefficiencies across chart, higher, and lower (intrabar) timeframes — offering a fl

TASC 2025.11 The Points and Line Chart█ OVERVIEW
This script implements the Points and Line Chart described by Mohamed Ashraf Mahfouz and Mohamed Meregy in the November 2025 edition of the TASC Traders' Tips , "Efficient Display of Irregular Time Series”. This novel chart type interprets regular time series chart data to create an ir

Simplified Percentile ClusteringSimplified Percentile Clustering (SPC) is a clustering system for trend regime analysis.
Instead of relying on heavy iterative algorithms such as k-means, SPC takes a deterministic approach: it uses percentiles and running averages to form cluster centers directly from the data, producing smoo

Adaptive Volume Delta Map---
📊 Adaptive Volume Delta Map (AVDM)
What is Adaptive Volume Delta Map (AVDM)?
The Adaptive Volume Delta Map (AVDM) is a smart, multi-timeframe indicator that visualizes buy and sell volume imbalances directly on the chart.
It adapts automatically to the best available data resolution

Dynamic Equity Allocation Model"Cash is Trash"? Not Always. Here's Why Science Beats Guesswork.
Every retail trader knows the frustration: you draw support and resistance lines, you spot patterns, you follow market gurus on social media—and still, when the next bear market hits, your portfolio bleeds red. Meanwhile, institution

First Passage Time - Distribution AnalysisThe First Passage Time (FPT) Distribution Analysis indicator is a sophisticated probabilistic tool that answers one of the most critical questions in trading: "How long will it take for price to reach my target, and what are the odds of getting there first?"
Unlike traditional technical indicators

See all indicators and strategies
Community trends
Tesla Approaches $480 Resistance – Uptrend Still IntactHello everyone,
Tesla is trading around $468, continuing its recovery since mid-October. On the 4H chart, the medium-term bullish structure remains clear: price consistently forms upward Fair Value Gaps, stays above the Ichimoku cloud, Tenkan-sen crosses above Kijun-sen, and volume rises above $46

QCOM: Weekly, Quarterly and EarningsPer request, here are my thoughts and analysis on QCOM.
Fundamentals are important for this ticker and here is why:
QCOM has underperformed the broader market ins 2025 due to its over-reliance on smartphone sales (about 75% of their business is tailored to smartphone sector, which is stagnate

$SHOP: A 4-Year Pattern Breakout Before EarningsWith the AI bubble looking frothy, investors are hunting for the next big rotation. The consumer holiday play looks like the perfect switch, and all eyes are on $SHOP.
This is looking like a clean breakout from a massive 4-year rounding bottom—a pattern this big is a major deal.
The setup couldn't b

USAR to $60.00!The chart illustrates a clear ascending triangle breakout that previously resulted in a rally from the breakout point near $14.60 to highs around $49.50.
This surge confirmed strong market interest and sector momentum in the rare earth materials space. Following the breakout, price entered a natura

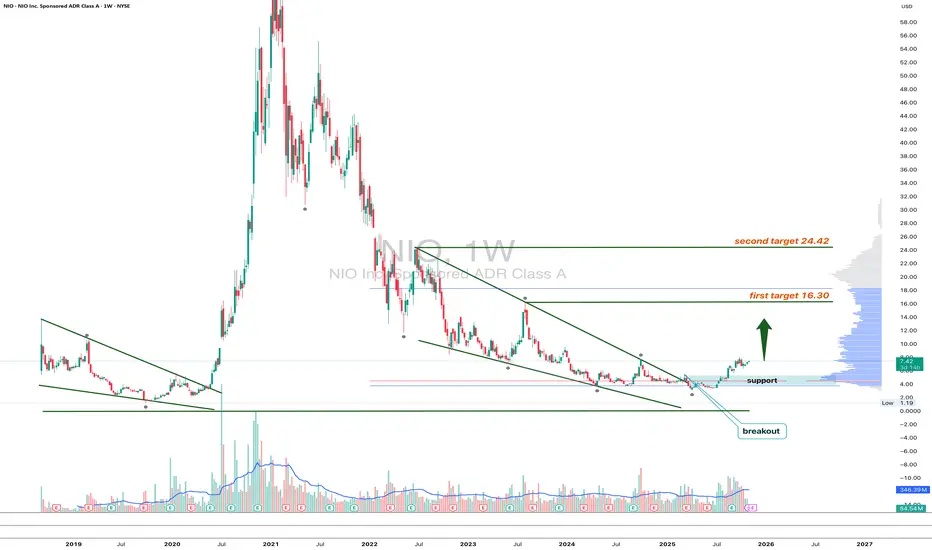
NIO 1W - engine on or just market noise?Technically, NIO has broken out of a long downtrend and is holding above the key $7.4 support. On the weekly chart this looks like the first sign of a long-awaited reversal. Fundamentally, however, the story is still mixed.
The company reported record October deliveries above 40 k units, up roughly
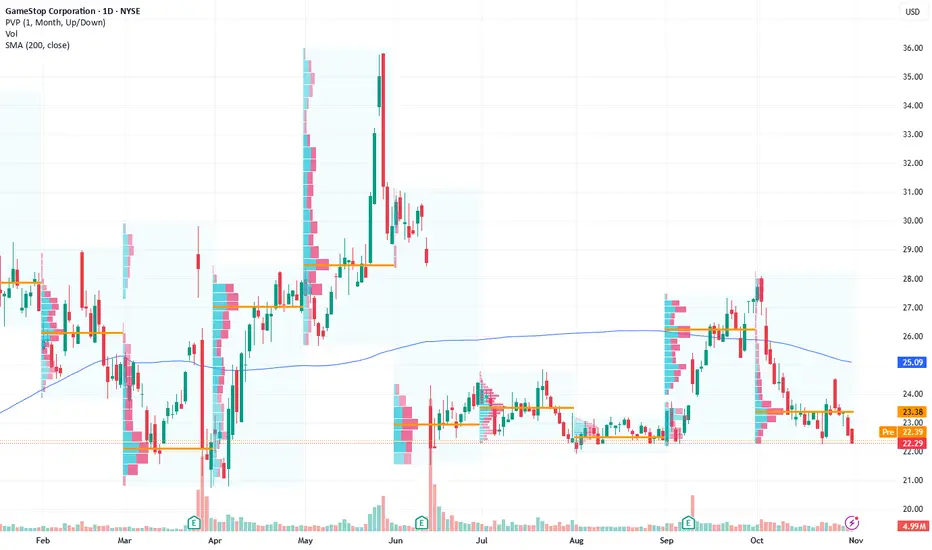
GameStop's Earnings Momentum Signals Strategic Upside Potential Current Price: $22.29
Direction: LONG
Targets:
- T1 = $24.50
- T2 = $27.00
Stop Levels:
- S1 = $21.50
- S2 = $20.00
**Wisdom of Professional Traders:**
This analysis synthesizes insights from thousands of professional traders and market experts, leveraging collective intelligen
Be patient to jump onto MetaMeta completed its grand cycle 3 on elliot wave structure and entering onto wave 4 now. Wave 4 typically retraces to 0.618 or 0.5 levels of wave 3 which is the zone marked in the box.
That zone is also a demand zone and 500 level is the long standing trend line level. If you are eyeing an entry, be

TSLA-Bulls Fighting for Expansion (Nov. 3–7)TSLA Weekly Grind Into Call Walls – Bulls Fighting for Expansion (Nov. 3–7)🚀
WEEKLY TIMEFRAME ANALYSIS
1. Market Structure
TSLA continues its broader bullish expansion on the weekly, confirming a strong BOS over prior swing highs. The previous CHoCH signal was neutralized quickly, and price reclaim

Microsoft: Wave X Top Confirmed! As primarily anticipated, Microsoft shares recently reached the high of turquoise wave X just below resistance at $562.17 before quickly reversing lower. This decline, part of the same-colored wave Y, is likely to bottom within our magenta long Target Zone between $477.87 and $451.84, where we also

IREN: MSFT pop fades—watch $56–58 support, $76 breakout lineBig picture: the Microsoft $9.7B/5-yr GPU cloud contract is a real validator, but the tape is still sorting through funding/margin math. Intraday we’re +6–7% around $64–65, well off the $75.7 high printed on the headline. That long upper wick says “sold-the-news / price discovery.”
Chart tells:
Th

See all stocks ideas
Today
CGBDCarlyle Secured Lending, Inc.
Actual
—
Estimate
0.39
USD
Today
AUDCAudioCodes Ltd.
Actual
0.17
USD
Estimate
0.10
USD
Today
YUMCYum China Holdings, Inc.
Actual
0.76
USD
Estimate
0.74
USD
Today
WATWaters Corporation
Actual
3.40
USD
Estimate
3.21
USD
Today
LDOSLeidos Holdings, Inc.
Actual
3.05
USD
Estimate
2.71
USD
Today
ADMArcher-Daniels-Midland Company
Actual
0.92
USD
Estimate
0.85
USD
Today
BALLBall Corporation
Actual
1.02
USD
Estimate
1.02
USD
Today
SPOTSpotify Technology S.A.
Actual
3.85
USD
Estimate
2.29
USD
See more events
Community trends
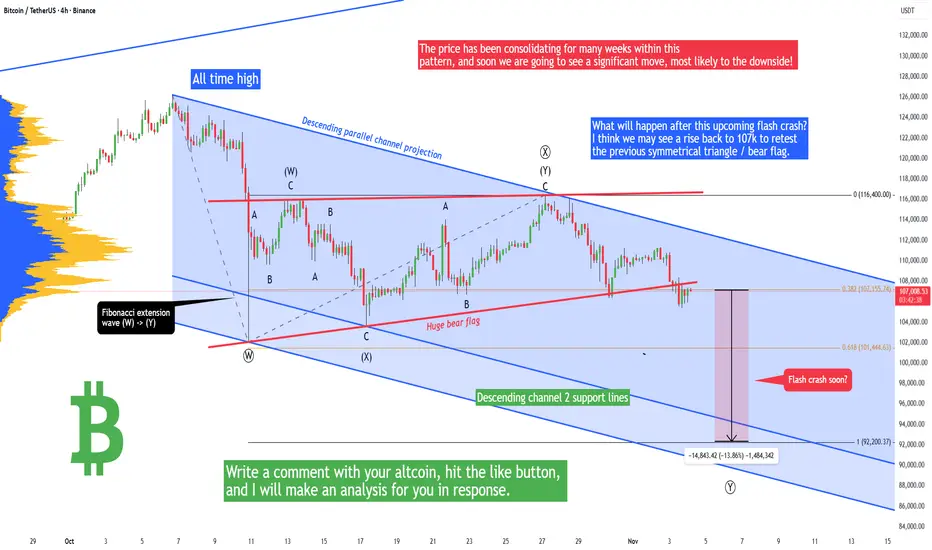
Bitcoin - Warning! Flash crash soon (BEAR FLAG)Bitcoin recently formed a symmetrical triangle, but the bulls made a false breakout above it, which is a huge problem because this symmetrical triangle pretty much transformed into a bearish flag, and that's a very bearish pattern! The price has been consolidating for many weeks within this pattern,
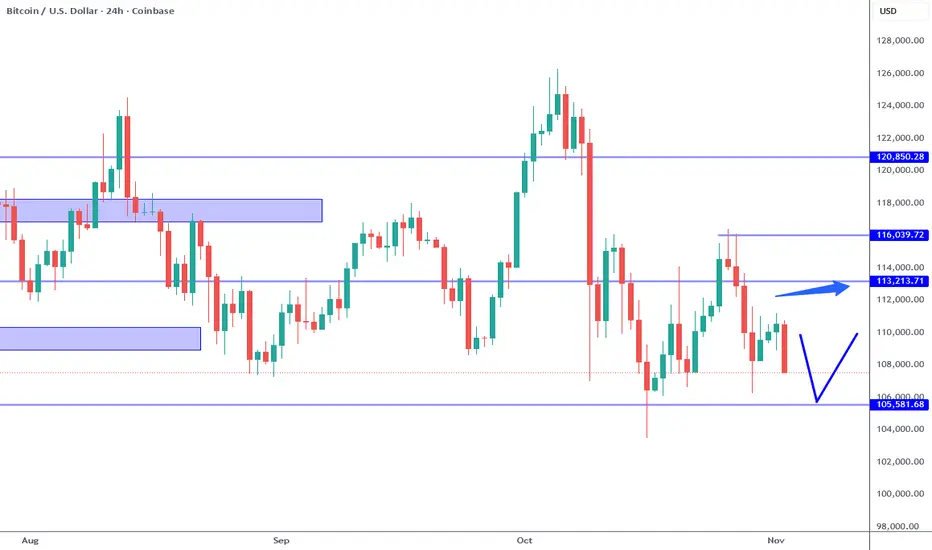
Bitcoin: Watch 105K For Bullish Reversal Again.Bitcoin all over the map. Pay attention to the nearest support and resistance levels which are 113K resistance and 105K support. 109K a minor support has been broken again. There is no way to know which way this market will break on the short term. The general trend is still bullish, BUT resistance
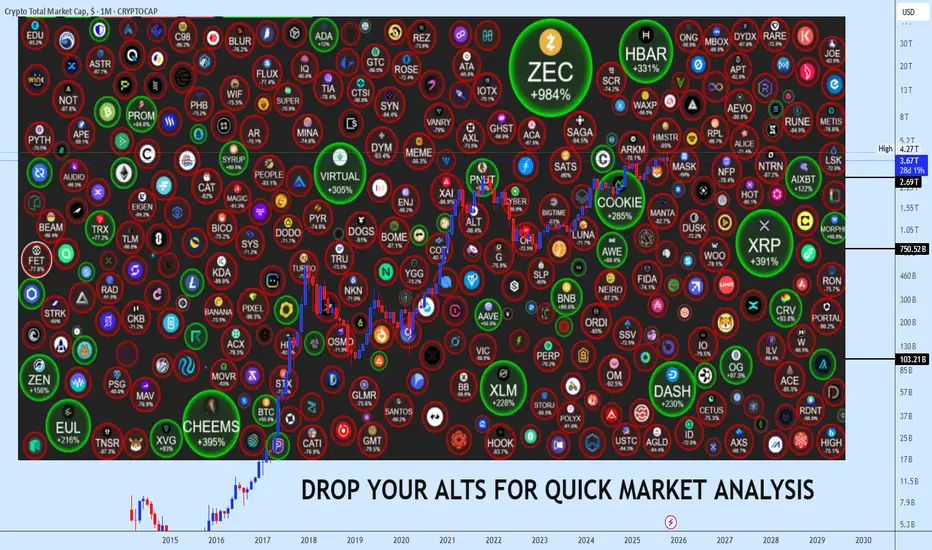
November Alts Request Window Now OpenFamily, November isn’t just another month, it’s decision time. We’re standing at the edge of the 4-year cycle’s final act, where altcoins will either explode into new expansions or vanish in liquidity drains. Every choice from here carries weight this selection window could decide the next cycle’s b
BTC formed a head and shoulders in consolidation!Hi!
Bitcoin recently completed a Head and Shoulders pattern, leading to a rejection from the “first hunt” area near the previous high. After that rejection, price has been moving lower and is now approaching a key S&D (Supply & Demand) zone highlighted on the chart.
This lower zone represents the

Bitcoin Rebound from Support Zone Targets 109,400Bitcoin (BTC/USD) is rebounding from the support zone near 106,000, showing signs of a potential upward move. The next resistance targets are around 108,000 and 109,400 levels.

BTCUSD Long: Buyers Defend Demand Zone, Targeting $110,400 MoveHello traders! Bitcoin (BTCUSD) is currently trading within a key structural zone, showing signs of balance between demand and supply after a volatile move. Following the previous sell-off from the $116,000 Supply Area, the price found strong buying pressure near the $106,500 Demand Zone, which coin

Bitcoin At Make-or-Break Zone – Long Setup Ahead?Bitcoin ( BINANCE:BTCUSDT ) is currently moving near a Heavy Support zone($111,980-$105,820) , Support lines , Potential Reversal Zone(PRZ) , and Cumulative Long Liquidation Leverage($106,432-$104,513) .
From an Elliott Wave perspective , it seems that Bitcoin might be completing the microw

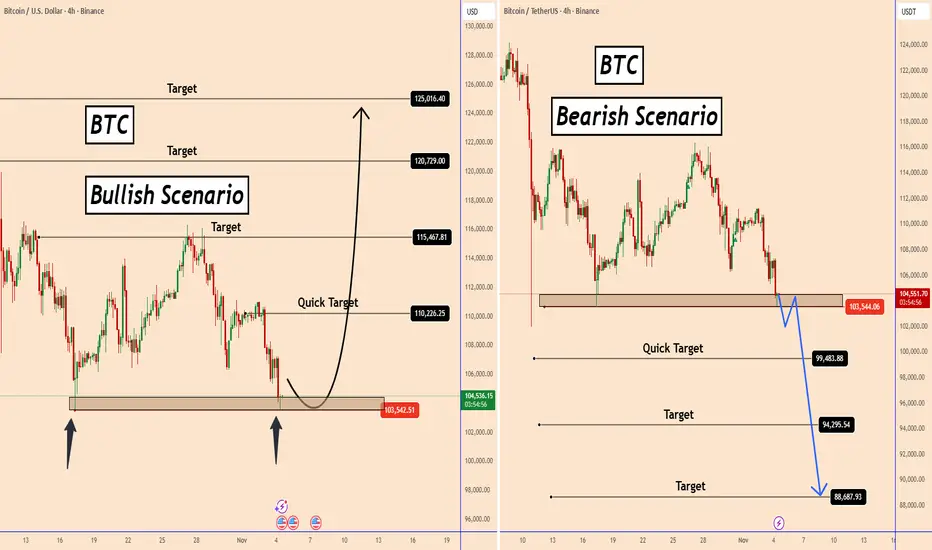
BTC: Bullish vs Bearish Scenarios - Key Levels to Watch BTC: Bullish vs Bearish Scenarios - Key Levels to Watch
Bitcoin is in a very complex development and it is not so easy to have a clear idea. At the moment, BTC is still growing as long as it stays above the current support area of 1035000.
Bitcoin is approaching a key support zone around $10
Dash is Back — Ready to Attack!Hey friends! 👋 How are you feeling after today’s drop?
Let’s talk about Dash.
In my opinion, Dash is finally ready to move toward my long-awaited targets at 100 and then 120.
My previous forecast didn’t play out as expected, since Dash entered the invalidation zone I mentioned earlier.
This time,

BTCUSD Rebounds from Support — Bulls Eye $106K Recovery MoveHello traders, I want to share with you my opinion about Bitcoin (BTCUSD). Bitcoin has been experiencing a prolonged corrective phase following a previous bullish rally. The market recently retested the Buyer Zone near $103,800–$104,200, where strong demand has once again emerged. This area has hist

See all crypto ideas
Lingrid | GOLD Weekly Market Outlook. Rally’s End or Reset?OANDA:XAUUSD explosive October rally — crowned by a historic monthly candle that shattered resistance and ignited euphoria — has now entered its reckoning phase. What looked like unstoppable momentum is now revealing signs of exhaustion. The sharp, volume-fueled drop toward $4,000 isn’t just a “hea

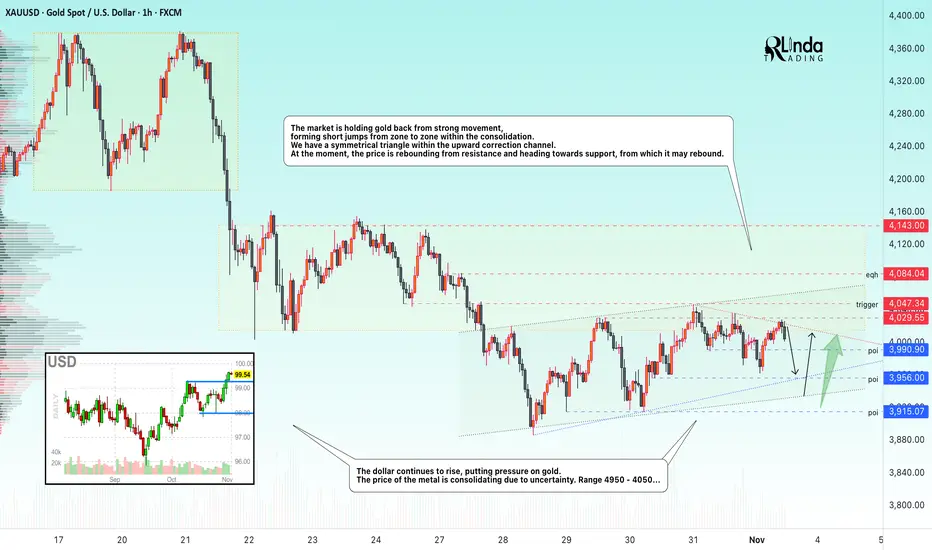
GOLD → Consolidation within a symmetrical triangle The market is holding gold back from strong movement, forming short jumps from zone to zone within consolidation. We have a symmetrical triangle within an upward correction channel.
Key supporting factors:
The US shutdown is becoming the longest in history, increasing economic risks.
China is c
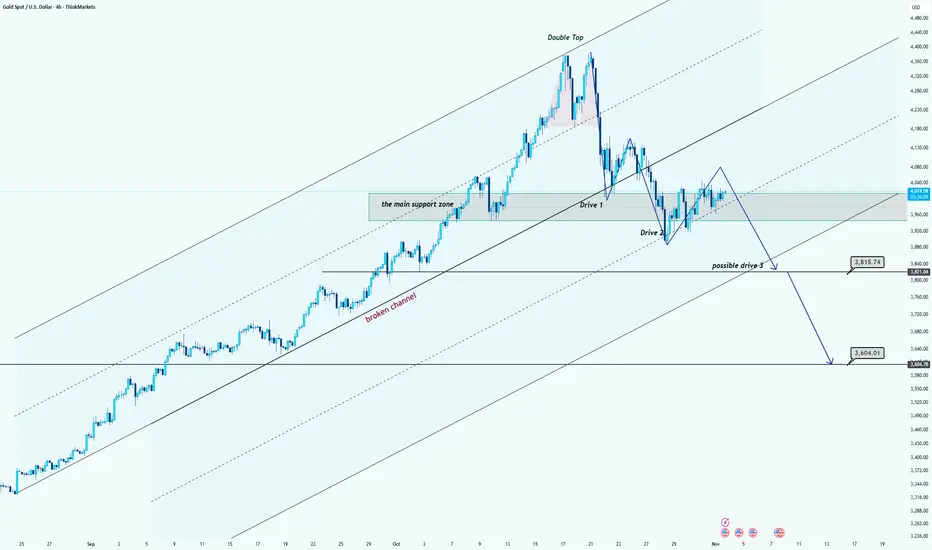
Gold Forming Bearish Three Drives Pattern Below Channel MidlineHi team!
Gold has formed a double top near the upper boundary of a long-term ascending channel, signaling potential exhaustion of the bullish momentum. After breaking below the local support and retesting it, price created a lower high, which confirms a short-term bearish structure.
Currently, the
Busy trading week coming up!!The trading week of November 3–7 is considered a pivotal period for international financial markets. A series of high-level economic data including manufacturing and services PMIs, ADP non-farm payrolls, trade balances, and interest rate decisions from major central banks will create a mixed picture
XAUUSD: Bulls Defend Channel Support, Eyeing $4,130 ReboundHello everyone, here is my breakdown of the current Gold setup.
Market Analysis
Gold (XAUUSD) continues to trade within a well-defined upward channel, showing a clear structure of higher highs and higher lows. After a series of breakouts and retests, the price recently tested the channel support

Gold Pauses in the ‘Calm Before the Storm’Hello everyone, gold is entering a delicate phase – a zone where the market is neither falling sharply nor gaining enough momentum to break higher. Everything now hinges on a clearer signal to determine the next direction.
Gold is currently trading around $3,986/oz, making a mild recovery thanks to

THE KOG REPORT - UpdateEnd of day update from us here at KOG:
Not a bad start to the week with the lower box holding and giving the spike for a nice push upside into the first level we wanted. The indicators gave a nice indication and we managed to capture the last part of the move before the retracement commenced.
N

Gold Nears Resistance — Buyers Target $4,130 BreakoutHello traders, here’s my current outlook on Gold (XAUUSD). The market structure shows that Gold has recently shifted from a sharp bearish phase into a short-term recovery pattern, finding solid demand near the $3,940–$3,950 Buyer Zone. After the last strong drop from the $4,130 Resistance Level, pri

Gold looking for another mega bullish This XAU/USD (Gold vs USD) 2-hour chart shows a consolidation phase between the support zone around 3,922 – 3,886 and the resistance level near 4,039 – 4,153. The price is currently trading near 3,994, indicating indecision before a potential breakout.
If gold holds above the support area, the char

Gold Bull Market Update and Outlook Q4 2025 / Q1 2026📌 Executive Summary
• Base case (60%): The current pullback is a normal retracement within the primary bull trend. We expect consolidation through late Q4-2025 and potentially into January 2026, followed by a resumption of the uptrend in Q1/Q2-2026.
• Drivers remain intact: Persistent central-bank

See all futures ideas
AUD/JPY - Bullish Flag (03.11.2025)🧠 Setup Overview:
AUD/JPY is forming a Bullish Flag Pattern on the 30-minute chart — a continuation setup suggesting potential upside momentum after consolidation. The price has respected the flag support zone and is attempting a breakout above the descending channel, signaling renewed bullish press

GBPUSD I Daily CLS I Model 1 - 50% Partial / Full range TP2Hi friends, new range created. As always we are looking for the manipulation in to the key level around the range. Don't forget confirmation switch from manipulation phase to the distribution phase to make the setup valid. Stay patient and enter only after change in order flow. If price reaches 50%

Euro continued Weakness Points to 1.1480 RetestHello traders, I’d like to share my view on EURUSD. The current market structure shows a clear bearish momentum, with the pair consistently forming lower highs and lower lows inside a well-defined descending channel. The rejection from the 1.1660 Resistance Zone — which coincides with a strong Selle

EURUSDHello Traders! 👋
What are your thoughts on EURUSD?
Euro/Dollar remains within a downward channel, forming consistent lower highs and lows.
The pair is expected to extend its decline toward the support zone that coincides with the lower boundary of the channel.
From there, a bullish rebound could

EUR/USD: Classic Breakout Trade - Don't Miss the Move!The 📉EURUSD pair experienced a decisive breakout and closed below a significant daily/intraday horizontal support cluster on Friday.
Following this breakout, the pair started to consolidate on an hourly timeframe, on the previously breached structure.
The bearish violation of this consolidation s

USDCHF Forming Bullish BreakoutUSDCHF is showing a strong bullish breakout from a key resistance zone around the 0.8030–0.8050 level, now acting as support. The pair has been gaining upside momentum following a clean break above this structure, indicating a potential continuation toward the 0.8150–0.8200 region. On the 4-hour tim

GBPCAD The Fish Hook: Buyers Ready to Reel it in?After a sharp drop, sellers began losing momentum, notice how the candles started to flatten out near the bottom, showing exhaustion.
Then, we see buyers are starting to step in, creating a rounded base, this forms the hook of the pattern.
The real shift happens if price snaps with strength above s

#GBPUSD: Previous Entry Invalidated,Next We Wait For Price! Our previous GBPUSD entry was invalidated as the pound declined while the DXY turned bearish. However, our view remains bullish on GBPUSD and the price is likely to reverse from our new entry area. Once the price enters the discounted zone we can then wait for it to reach one of our target or take-p

AUDUSD Breakout and Potential Retrace!Hey Traders, in today's trading session we are monitoring AUDUSD for a selling opportunity around 0.65800 zone, AUDUSD was trading in an uptrend and currently is in a correction phase in which it is approaching the retrace area at 0.65800 support and resistance area.
Trade safe, Joe.

EURUSD Short: Sellers Targeting Move Toward 1.1480 SupportHello traders! EURUSD continues to move within a clear bearish structure after facing strong rejection from the 1.1660 Supply Zone. The pair recently formed a Pivot Point at the top of the Ascending Channel, where a Fake Breakout signaled exhaustion among buyers and triggered renewed selling pressur

See all forex ideas
| - | - | - | - | - | - | - | ||
| - | - | - | - | - | - | - | ||
| - | - | - | - | - | - | - | ||
| - | - | - | - | - | - | - | ||
| - | - | - | - | - | - | - | ||
| - | - | - | - | - | - | - | ||
| - | - | - | - | - | - | - | ||
| - | - | - | - | - | - | - |
Trade directly on the supercharts through our supported, fully-verified and user-reviewed brokers.


