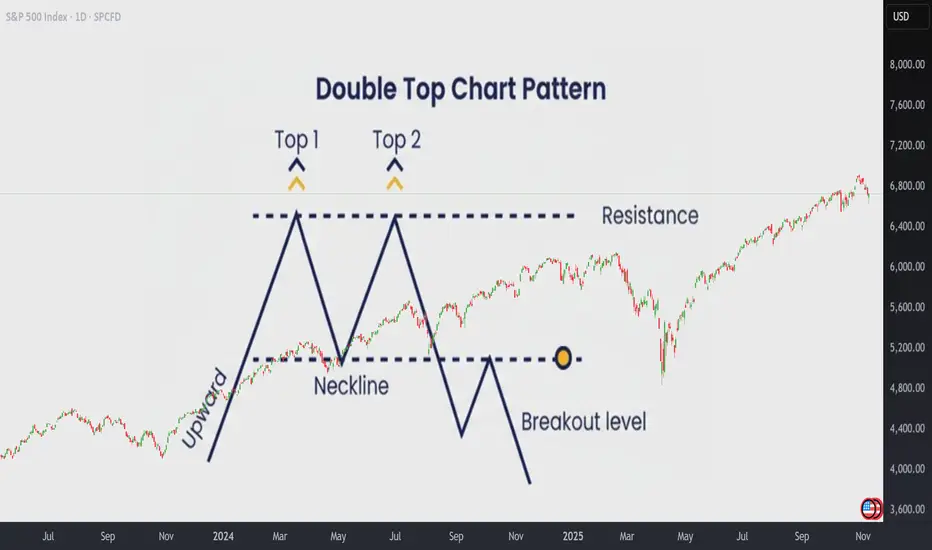
How to Trade the Double Top Pattern Like a ProHow to Trade the Double Top Pattern Like a Pro
The Double Top is one of the most reliable patterns in technical analysis. It often marks the beginning of a resistance zone and signals that bullish momentum is losing strength.
The first top is hard to anticipate, it’s usually just a continuati

The best trades require research, then commitment.
Get started for free$0 forever, no credit card needed

Scott "Kidd" PoteetThe unlikely astronaut

Where the world does markets
Join 100 million traders and investors taking the future into their own hands.
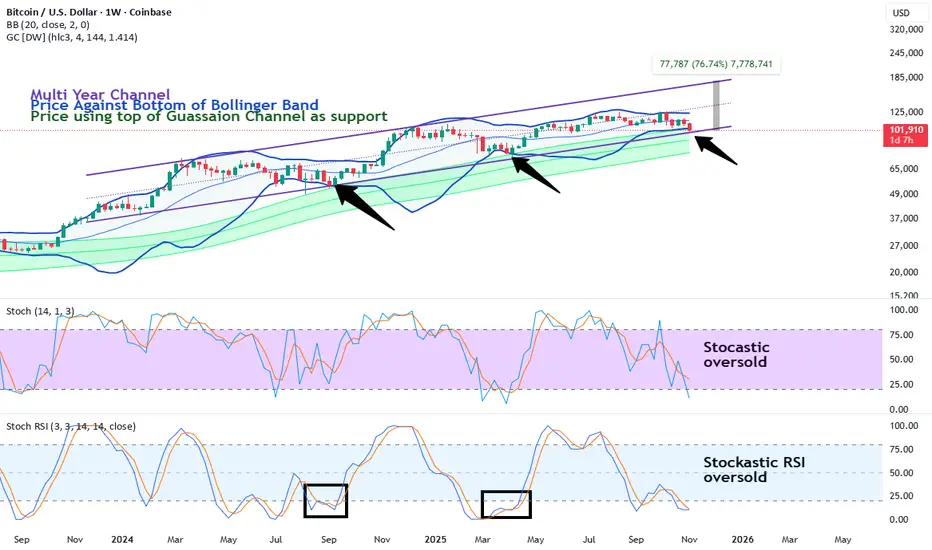
People Panic (again) as bitcoin returns to support (again)Bitcoin has been channeling up for about a year pretty consistently. The basic technical supports are still working. Price hits the weekly Bollinger band bottom, wicks through, builds structure and reverses to a new high. Price has also been bouncing off the top of the weekly gaussian channel. Th
Gold at Its Golden SupportThe daily chart of GOLD shows that after a strong rally from around $3,200, the price has now pulled back toward the 50-day moving average (around $3,860) — a level that has repeatedly acted as a key support over the past several months, sparking multiple upward waves each time.
Short-Term Outlook

Qqq.. No crying in the casinoPullback from summer channel top to channel bottom is underway and almost finished..
But go to your weekly and zoom out a decade
Logarithmic
Zoomed in
So yes, we are at the bottom of a 6month channel but we are still at the top of a 15year trendline and I don't think we last above here much

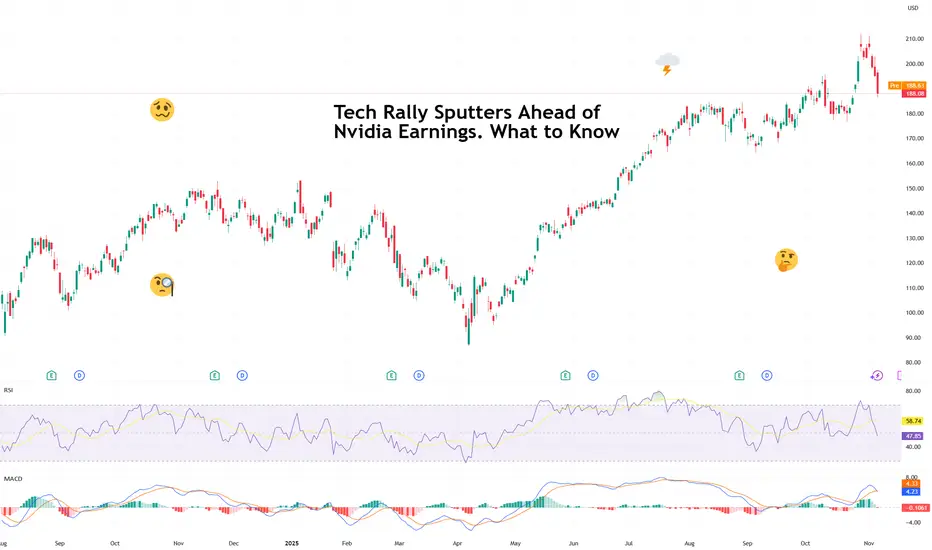
Tech Rally Sputters Ahead of Nvidia Earnings. What to KnowIs the powerful AI sector finally out of breath? With valuations that stretched, some investors fear if we all took it too far.
After months of seemingly unstoppable gains, the tech trade is finally showing signs of fatigue. Stocks are back in the red this week, with technology — the sector that’s
Nvidia: Acceleration Toward New Highs Nvidia gained strong upward momentum shortly after our last update, surging past the $196.45 mark, which had previously served as resistance. As a result, our prior short-term alternative scenario was triggered, and we have now adjusted the chart accordingly (with minor modifications). We now view t

BITCOIN – LEVELS TO WATCHTraders,
We dumped. Now we are in a controlled recovery. The question is not only “are we going up” but “where will the market make its real decision.” Right now the chart is giving us two very clean checkpoints.
1. What happened
We lost the weekly open and sold off.
Spot was selling too, so

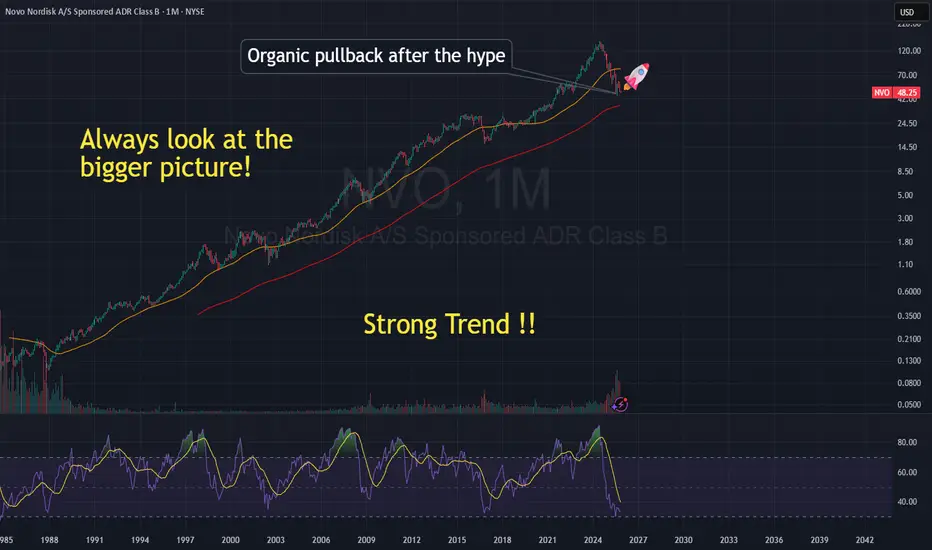
$NVO Last opportunity!🌱 Novo Nordisk: A Healthy Pullback in a Long-Term Growth Story
After years of remarkable growth, Novo Nordisk (NYSE: NVO) has seen its stock cool off — sliding from over 💲130 to around 💲49. At first glance, that might look alarming, but the reality is far more balanced. What we’re seeing is an or
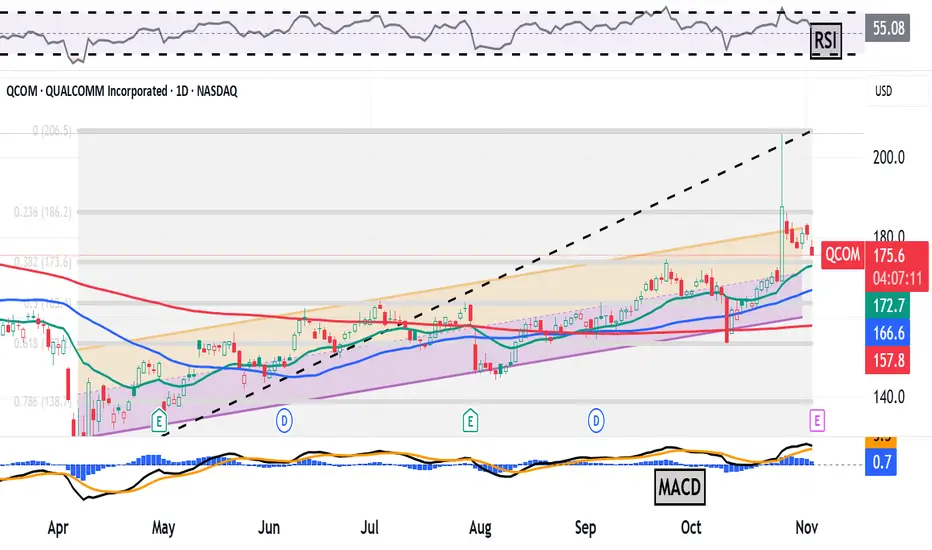
Qualcomm Rose 11% in One Day on AI Plans. What Its Chart SaysSemiconductor designer Qualcomm NASDAQ:QCOM , which is known for providing products to the consumer-electronics industry, rose more than 11% to a 15-month high in a single day last week when it announced a pivot into the world of artificial intelligence. Let's see what QCOM's chart and fundamental
Peak Tech Earnings Wrapped Up: Here Are the Winners and LosersWe're past that time when we all get glued to the dual-monitor setup and watch the titans of tech parade their financials.
Last week was the Super Bowl of earnings season, with Meta NASDAQ:META , Microsoft NASDAQ:MSFT , Alphabet NASDAQ:GOOGL , Apple NASDAQ:AAPL , and Amazon NASDAQ:AMZN all re

See all editors' picks ideas
PriceFormatLibrary for automatically converting price values to formatted strings
matching the same format that TradingView uses to display open/high/low/close prices on the chart.
█ OVERVIEW
This library is intended for Pine Coders who are authors of scripts that display numbers onto a user's charts. T

LogNormalLibrary "LogNormal"
A collection of functions used to model skewed distributions as log-normal.
Prices are commonly modeled using log-normal distributions (ie. Black-Scholes) because they exhibit multiplicative changes with long tails; skewed exponential growth and high variance. This approach i

Range Oscillator (Zeiierman)█ Overview
Range Oscillator (Zeiierman) is a dynamic market oscillator designed to visualize how far the price is trading relative to its equilibrium range. Instead of relying on traditional overbought/oversold thresholds, it uses adaptive range detection and heatmap coloring to reveal where pri

Volume Surprise [LuxAlgo]The Volume Surprise tool displays the trading volume alongside the expected volume at that time, allowing users to spot unexpected trading activity on the chart easily.
The tool includes an extrapolation of the estimated volume for future periods, allowing forecasting future trading activity.
🔶 U

Smooth Theil-SenI wanted to build a Theil-Sen estimator that could run on more than one bar and produce smoother output than the standard implementation. Theil-Sen regression is a non-parametric method that calculates the median slope between all pairs of points in your dataset, which makes it extremely robust to o

Fair Value Gaps by DGTFair Value Gaps
A refined, multi-timeframe Fair Value Gap (FVG) detection tool that brings institutional imbalance zones to life directly on your chart.
Designed for precision, it visualizes how price delivers into inefficiencies across chart, higher, and lower (intrabar) timeframes — offering a fl

TASC 2025.11 The Points and Line Chart█ OVERVIEW
This script implements the Points and Line Chart described by Mohamed Ashraf Mahfouz and Mohamed Meregy in the November 2025 edition of the TASC Traders' Tips , "Efficient Display of Irregular Time Series”. This novel chart type interprets regular time series chart data to create an ir

Simplified Percentile ClusteringSimplified Percentile Clustering (SPC) is a clustering system for trend regime analysis.
Instead of relying on heavy iterative algorithms such as k-means, SPC takes a deterministic approach: it uses percentiles and running averages to form cluster centers directly from the data, producing smoo

Adaptive Volume Delta Map---
📊 Adaptive Volume Delta Map (AVDM)
What is Adaptive Volume Delta Map (AVDM)?
The Adaptive Volume Delta Map (AVDM) is a smart, multi-timeframe indicator that visualizes buy and sell volume imbalances directly on the chart.
It adapts automatically to the best available data resolution

Dynamic Equity Allocation Model"Cash is Trash"? Not Always. Here's Why Science Beats Guesswork.
Every retail trader knows the frustration: you draw support and resistance lines, you spot patterns, you follow market gurus on social media—and still, when the next bear market hits, your portfolio bleeds red. Meanwhile, institution

See all indicators and strategies
Community trends
MSTR HIGH PROBABILITY BIG BULL MOVE SOON!!!🚨 MSTR HIGH PROBABILITY BUY SETUP 🚨
* Here We Can See Clearly The Next Potential Moves For MSTR Coming Hours/Days.
* Keep Your Eyes Close On Your Trading Positions.
* Happy PIP Hunting Traders.
FXKILLA.

NVDA Rebounds From Demand Zone, Eyeing $210 Supply AreaNASDAQ:NVDA has shown a strong rebound from the $177–$180 demand zone, signaling potential bullish momentum after a steep correction. The 1-hour chart shows a shift in structure, with higher lows beginning to form, suggesting renewed buyer interest.
As long as the price holds above $182, the shor

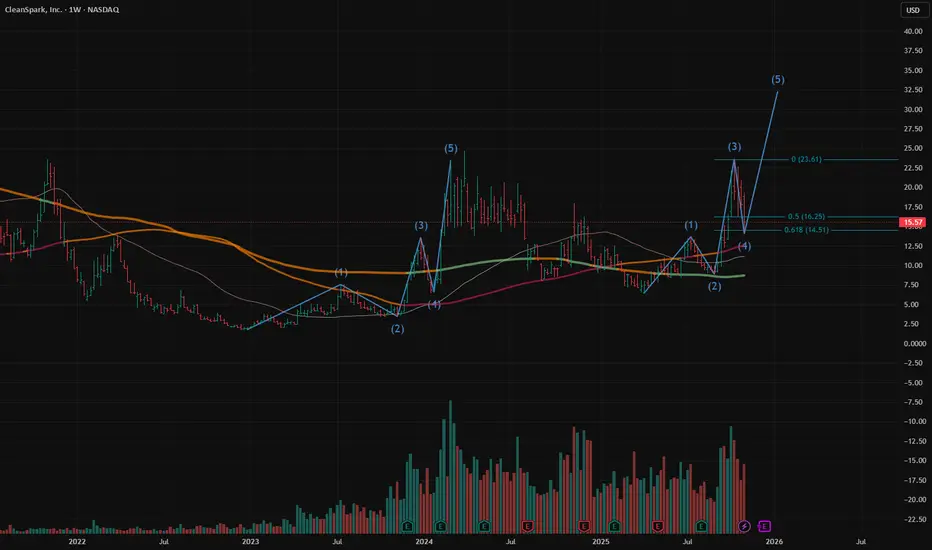
$CLSK: another wave up to make a higher highNASDAQ:CLSK : price action is quite similar to last year. 5 waves up. I believe Wave 5 has started.
OPEN Technologies LONGBull Flage Support, Fib Level 0.618 Support
Possible hard bounce from here and leaving the train.
Reject as the drawing lines show

GPUS: Range Bound & Undervalued!AMEX:GPUS is quietly stacking value while trading in a range. At $0.35–$0.37, it's 61% below the estimated NAV of $1.02/share backed by $122M in cash + BTC vs. just $118M market cap (Nov 6 update).
Do your own research and trade at your own risk.
Inflection Point NVDA has a hammerhead candle on a key level and the 50 EMA and the 0.786 Fibonacci level.
Oscillators are flashing oversold. For bullish activity we need a bullish candle with a close above 188.15 and next resistance will be around 191 or 190.70. If price breaks below the 50 EMA(185.19) next key lev

$OUST is sitting right on the bottom of its long-term channelNASDAQ:OUST is sitting right on the bottom of its long-term ascending channel, testing major trendline support around $23.
This zone has acted as a launchpad before, sparking strong rebounds each time price touched it.
If the channel holds, a move back toward the mid-range near $34 could unf

10x Genomics, Inc. — The Genetic comeback story no one’s talkingThe name alone implies exponential potential, 10x Genomics. Ironically, that’s exactly what the chart hints at, (resistances shown as horizontal black lines). After a brutal multi-year decline from its euphoric highs, TXG may now be on the cusp of a significant structural reversal.
The story
At t

CAN / Daily$Canaan — Technical Analysis ( Daily Chart )
NASDAQ:CAN retraced 52.7%📉 from $2.22 to $1.06🎯, aligning precisely with prior projections. This decline likely marks the initial leg of a correction in Intermediate Wave (2), hinting at a potential Running Flat formation ahead.
Following this retrace

This Time I’m Watching AppleGreetings fellow traders and chart lovers!
Here’s my updated view on Apple’s long term channel, which remains one of the cleanest trends on the NASDAQ. A perfect example of how patience pays in technical analysis.
Apple at the Edge: Key Retest Zone Before the Next Big Move 🍏
Apple Inc. (AAPL) has

See all stocks ideas
Today
RUMRumble Inc.
Actual
−0.06
USD
Estimate
−0.06
USD
Today
CMCLCaledonia Mining Corporation Plc
Actual
0.77
USD
Estimate
0.78
USD
Today
ACDCProFrac Holding Corp.
Actual
−0.45
USD
Estimate
−0.43
USD
Today
SPRYARS Pharmaceuticals, Inc.
Actual
−0.52
USD
Estimate
−0.45
USD
Today
DOLEDole plc
Actual
0.16
USD
Estimate
0.17
USD
Today
CNTYCentury Casinos, Inc.
Actual
−0.22
USD
Estimate
−0.23
USD
Today
CBATCBAK Energy Technology, Inc.
Actual
0.03
USD
Estimate
−0.03
USD
Today
TSQTownsquare Media, Inc.
Actual
−0.36
USD
Estimate
0.07
USD
See more events
Community trends
Bitcoin - New falling wedge! (no one talks about, must see)Bitcoin is forming a brand new falling wedge pattern no one really talks about! This falling wedge pattern is not complete, and it will take another week to see the whole pattern, but what we see now is the first skeleton of the pattern. Of course this is great because we can enter a short position

BTC Preparing for the Next Parabolic Phase Patience Is KeyBitcoin continues to respect its macro bullish structure, maintaining a firm stance above both the Critical and Immediate Demand Zones. The recent consolidation is acting as a natural pause within the broader uptrend a healthy retest phase rather than a reversal.
The $92k–$101k zone remains the imm

Moon time for Litecoin! - $700 ?? - November 2025Wait a minute… doom for Dogecoin, boom for Litecoin?
“ You can’t have a bearish idea for Doge and a bullish one for Litecoin, idiot!”
Yeah, yeah. I’ve had my coffee, I’m ready for the unhinged piffle that’ll inevitably clutter the comments. Bring it on..
For the rest of us: facts are facts. Chart

BTCUSD: Bulls Eye Recovery Toward $104K Resistance ZoneHello everyone, here is my breakdown of the current Bitcoin setup.
Market Analysis
BTCUSD is currently showing signs of a potential bullish recovery after bouncing from the key $100,600–$101,200 Support Zone, which aligns with the Wedge Support Line on the chart. This area has acted as a Buyer Zo

DOGE Poised for a Fresh Upswing?Hello everyone, DOGE is trading around 0.1807–0.1810, retesting the FVG zone 0.175–0.180 after rebounding sharply from 0.155–0.160. The structure shows a clear series of higher lows, suggesting that buyers are regaining control. However, the price is pausing near 0.182–0.185, overlapping the Ichimo

BTCUSDT(BITCOIN): Bitcoin is bearish for now at least! Bitcoin is in distribution phase if we using the smart money concept, that is why we think price is at the final point before it drop faster. There will be mixed views regarding the bitcoin, but this is our personal view and which is more likely view compare to buying. Please use accurate risk manag

Bitcoin 100K$ support zone hold strong But not bullish YETAs observed on the chart, the $100,000 support zone is demonstrating significant strength by holding the price. However, the primary focus is now on the major resistance cluster near $108,000. This level is a critical technical juncture for three key reasons:
1. Role Reversal: This level re

Bitcoin Daily Outlook: Support and Resistance in FocusHey Guys,
Looking at Bitcoin on the daily chart, the 105,000 to 98,000 levels are strong support zones. This means that as long as the price does not fall below these levels, a sharp decline in Bitcoin is unlikely.
The price touches these areas, but whales prevent it from breaking lower with stro

Bitcoin: 100K NOW Attractive For Investing.Bitcoin looks bearish to most, I can understand why BUT as bearish as this looks, the current price area still presents a potential area for a bullish reversal. The 98K low dates back to the June low which is now acting as the support. IF this level breaks, 95K is the next inflection point to watch

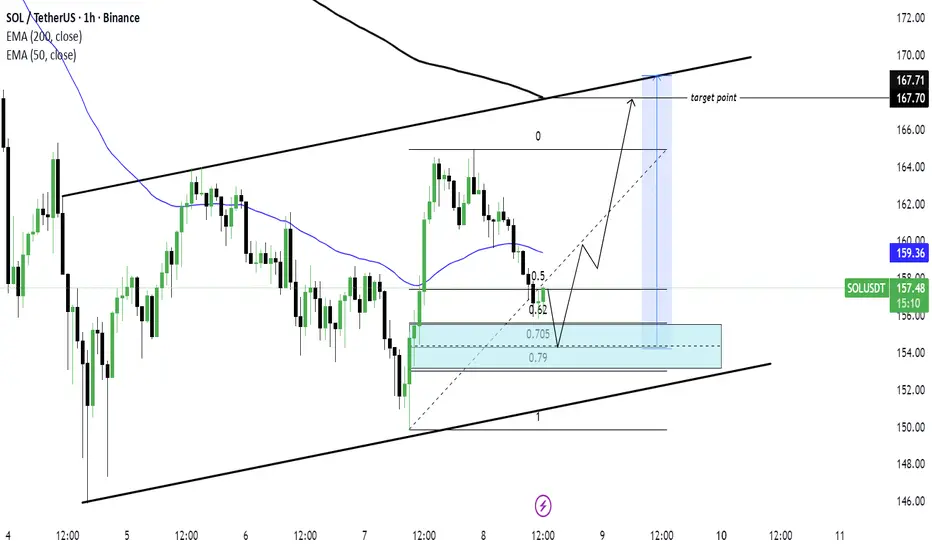
SOL/USDT) Bullish trend analysis Read The captionSMC Trading point update
Technical analysis of SOL/USDT (1-hour timeframe) — a potential continuation move within an ascending channel.
Here’s the complete breakdown
---
1. Market Structure
Price is moving inside a rising channel, confirming a bullish structure with higher highs and higher
See all crypto ideas
Lingrid | GOLD Weekly Market Outlook: Sell the SpikesOANDA:XAUUSD parabolic October rally has stalled, giving way to a sharp corrective phase. This signals waning momentum and the potential start of a deeper pullback. With price now testing key support near $4,000, the market is at a critical juncture: failure to hold this zone opens the door to targ

XAUUSDHello Traders! 👋
What are your thoughts on Gold?
The $3,900 level continues to act as a key support zone for gold, preventing further downside pressure for now.
Currently, the price is consolidating between the highlighted support and resistance levels, showing range-bound behavior in the short te

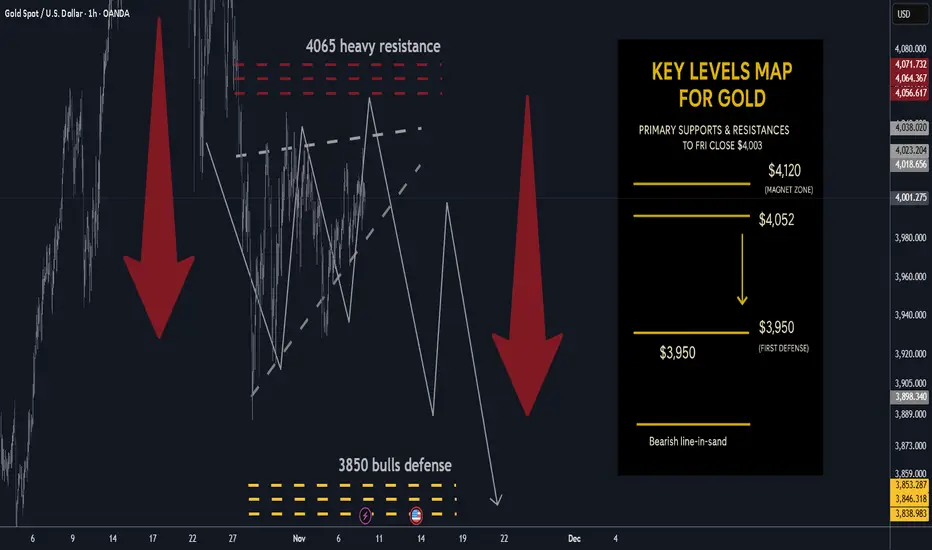
Gold next week: Key S/R Levels and Outlook for Traders🔥 GOLD WEEKLY SNAPSHOT — BY PROJECTSYNDICATE
🏆 High/Close: $4,024.9 → ~$4,003 — sellers faded upticks; weekly close soft but back above the round $4k.
📈 Trend: Neutral / mild correction inside range; not expecting immediate new highs while <$4,080–4,120.
🛡 Supports: $3,950 → $3,900 → $3,850 — piv
GOLD → Gold within the trading range...FX:XAUUSD is consolidating amid a pullback in the dollar and in anticipation of stronger key data as a driver for movement. Focus on the current trading range
On Friday, before the close of the session, the market formed a short squeeze, a strange volatility without news. It is important to monito

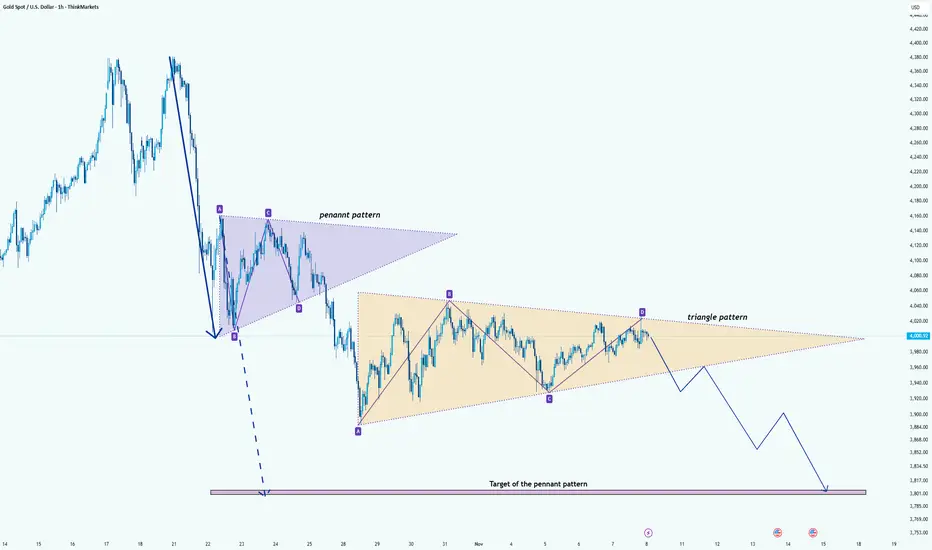
Gold (XAUUSD): Triangle Compression After Pennant BreakHi!
After the strong, impulsive drop, Gold formed a bearish pennant, which has already broken to the downside. The measured move target of that pennant remains unfilled, and the price continues to consolidate below the breakdown point.
Currently, the market structure is developing inside a symmetr
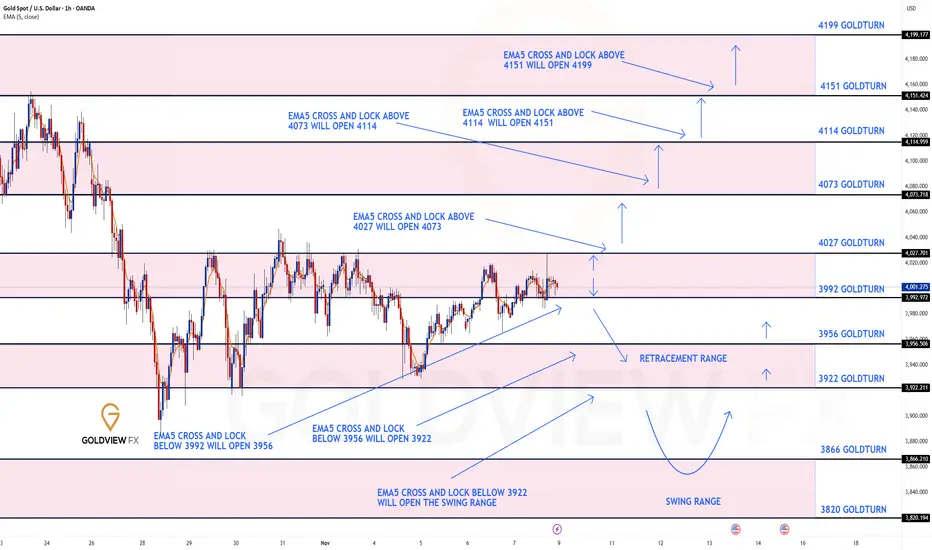
GOLD 1H CHART ROUTE MAP UPDATE & TRADING PLAN FOR THE WEEKHey Everyone,
Please see our updated 1h chart levels and targets for the coming week.
We are seeing price play between two weighted levels with a gap above at 4027 and a gap below at 3992. We will need to see ema5 cross and lock on either weighted level to determine the next range.
We will see le
Gold Price Setup: The Pullback Signal Is Getting Stronger!OANDA:XAUUSD is currently trading within a well-defined ascending channel, with price action now testing the upper boundary. This level may act as a dynamic resistance, and a rejection here could trigger a correction toward 4,030.
Such a pullback aligns with expectations for a healthy retracement

THE KOG REPORT THE KOG REPORT:
In last week’s KOG Report we wanted to stick to a similar plan from the week prior, looking for price to attempt either the high to short it again, or, for price to attempt to break the lower box and then give us the opportunity to long again. We had to switch to intra-day trading

Gold 1H – Is This Pump Temporary or the Start of a Bigger Move?🟡 XAUUSD – Intraday Smart Money Plan | by Ryan_TitanTrader
📈 Market Context
Gold extended its bullish leg overnight, driven by a sharp upside displacement following a clean ChoCH on the H1 structure.
However, the impulsive rally is now pushing deep into premium territory, where higher-timeframe sup

Gold 30-Min — Volume Buy & Sell Reversals Triggered⚡Base : Hanzo Trading Alpha Algorithm
The algorithm calculates volatility displacement vs liquidity recovery, identifying where probability meets imbalance.
It trades only where precision, volume, and manipulation intersect —only logic.
✈️ Technical Reasons
/ Direction — LONG / Reversal 4004
☄️

See all futures ideas
USD/CHF - Trendline Rejection (10.11.2025)📊 Setup Overview : FX:USDCHF
USD/CHF continues to respect the descending trendline and Ichimoku cloud resistance, signaling potential downside pressure. Price is currently retesting the resistance zone (0.8070–0.8085) — a strong supply area that has rejected multiple times.As long as this zone h

GBP/CAD Rejection at Supply → Next Stop: 1.8350📉 GBP/CAD Analysis – Rising Wedge Breakdown in Motion
GBP/CAD has broken down from a Rising Wedge formation, signaling a potential bearish continuation. Price rejected strongly from the Key Zone (≈1.8550–1.8580), followed by a break + retest of the supporting trendline.
If downside pressure holds

GBPJPY: Bullish Reversal Almost Confirmed! GBPJPY has perfectly filled up the liquidity voided area and now it has reversed nicely from that point. This entry is only valid if price breakthrough the inducement line and reconfirm the entry. Once it has completed this step, we can then set the target at 211 level.
There can be three target s

GBPUSD Potential UpsidesHey Traders, in today's trading session we are monitoring GBPUSD for a buying opportunity around 1.31400 zone, GBPUSD is trading in an uptrend and currently is in a correction phase in which it is approaching the trend at 1.31400 support and resistance area.
Trade safe, Joe.

GBP/USD Testing Buyers After Bounce From 1.3000 SupportHello everyone, on the 4-hour chart, GBP/USD is currently trading around 1.3146, following a rebound from the 1.3000–1.3020 zone. This recovery has filled most of the FVG 1.3100–1.3170, but price has stalled just below the red Ichimoku cloud, indicating that buying momentum is weakening. FVG levels

EURUSD Long: Bullish Correction Toward 1.16100 ResistanceHello traders! EURUSD is showing signs of recovery after an extended period of bearish movement inside a descending channel, where sellers controlled the market structure. After several failed attempts to break above the upper boundary, the price has formed a Pivot Point near the Demand Zone around

EURUSD Retests Buyer Zone — Bullish Momentum Aiming for 1.1600Hello traders! I’d like to share my view on EURUSD. After an extended bearish trend inside a descending channel, the pair finally found strong buying interest around the 1.15300–1.15400 Buyer Zone, where price reacted multiple times in the past. This area aligns with both the horizontal Support Leve

NZD/USD (1H timeframe) .. NZD/USD (1H timeframe) — here’s the target analysis:
Current Price: ≈ 0.5647
Breakout Zone: Price has broken above the descending trendline and entered above the Ichimoku cloud — signaling a potential bullish reversal.
From my marked “Target Points” on the chart:
1. First Target (TP1): Around

GBP/USD: Bullish Reversal Confirmed?!📈GBPUSD formed an inverted head and shoulders pattern on the 4-hour timeframe.
The breakout above its neckline serves as a strong bullish reversal signal.
The broken neckline of this pattern is now expected to act as a significant support level.
We anticipate a subsequent upward movement from th

EUR/USD Loses Momentum – Sellers Take Back Control!The market is beginning to show clear signs: the U.S. dollar is regaining strength , while EUR/USD faces strong correction pressure after a short-lived recovery. The latest news from the U.S. indicates that sentiment is shifting in favor of the greenback, as expectations for a government reopenin

See all forex ideas
| - | - | - | - | - | - | - | ||
| - | - | - | - | - | - | - | ||
| - | - | - | - | - | - | - | ||
| - | - | - | - | - | - | - | ||
| - | - | - | - | - | - | - | ||
| - | - | - | - | - | - | - | ||
| - | - | - | - | - | - | - | ||
| - | - | - | - | - | - | - |
Trade directly on the supercharts through our supported, fully-verified and user-reviewed brokers.


