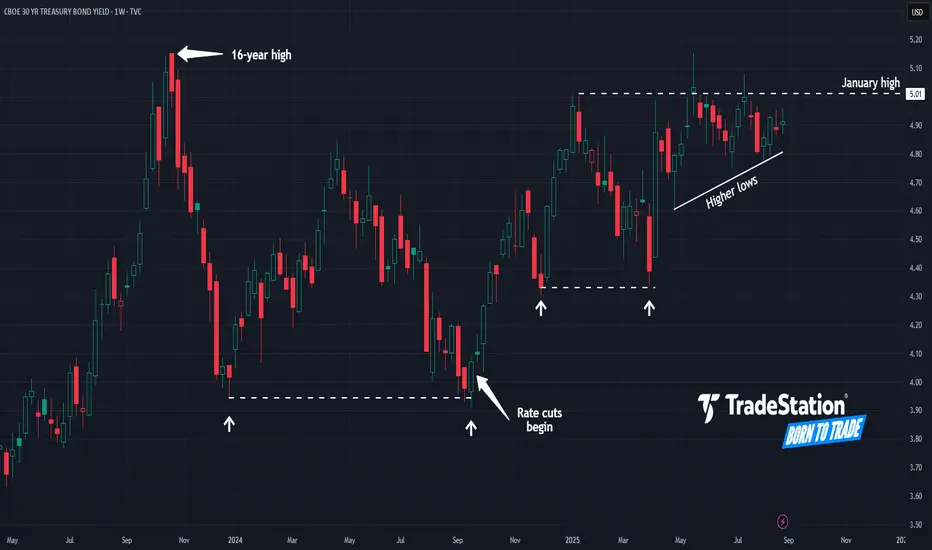
Fear and Loathing at the Long End?Sovereign bond rates have steadily crept higher since the pandemic, and some traders may worry about further upward pressure in the 30-year U.S. Treasury yield.
The first pattern on today’s weekly chart is the double bottom at roughly 3.95 percent in December 2023 and September 2024.
Second, TYX

The best trades require research, then commitment.
Get started for free$0 forever, no credit card needed

Scott "Kidd" PoteetThe unlikely astronaut

Where the world does markets
Join 100 million traders and investors taking the future into their own hands.
Major indices
Gold Pops 5% as Fed Fears Drive Demand. New Record High Soon?Gold bugs are doing well this summer.
The yellow metal OANDA:XAUUSD just logged its best monthly performance since April, climbing nearly 5% in August and closing at $3,447 per ounce on Friday – its highest level since mid-June.
As stock bros take a break for Labor Day on Monday, gold bugs a

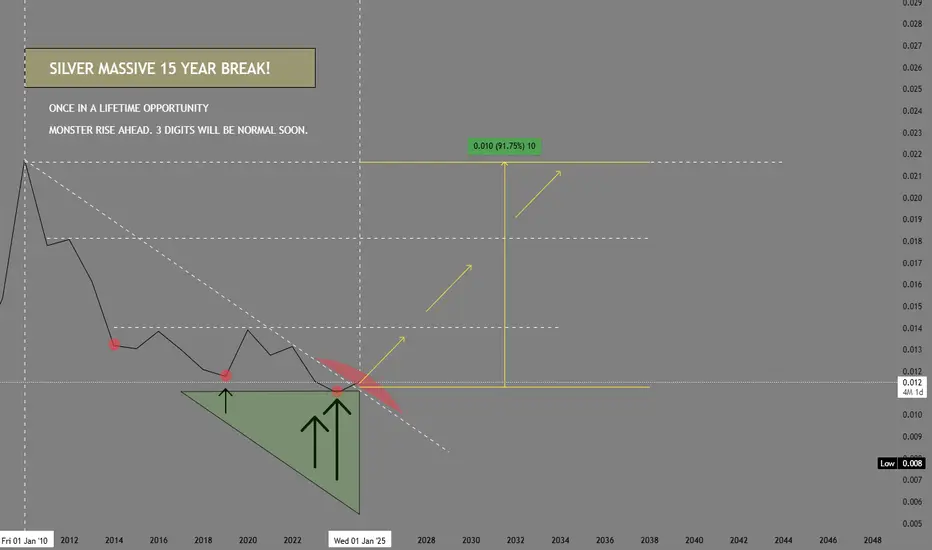
SILVER, MONSTER RISE AHEAD targeting 3 digit pricing!!! SEED NOWFirst things first. Chart is based on reverse metrics of GOLD/SIVER.
SILVER, is usually the supporting actor of the main star GOLD for months. During GOLD's relentless series of rise from 1900 -- silver has been pretty much on the low key state in terms of volume exposure and media mileage but tha
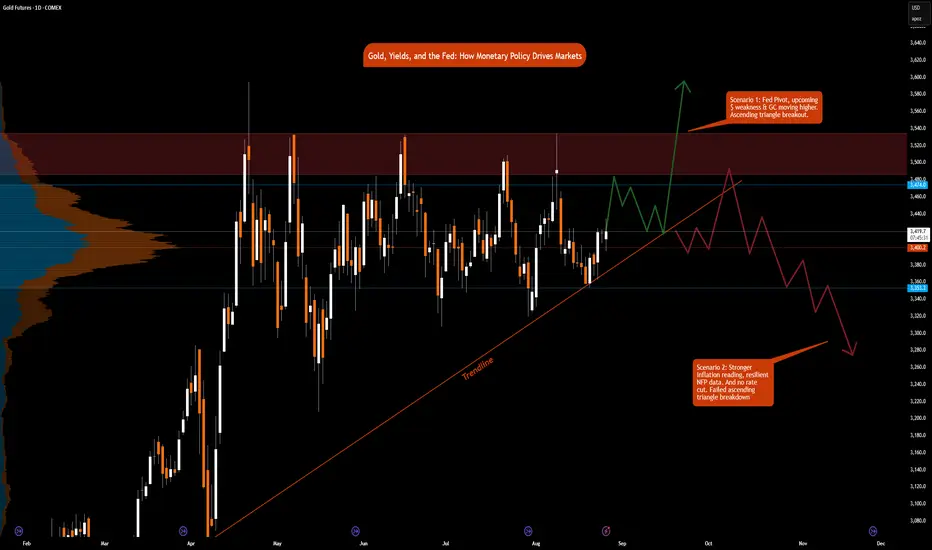
Gold, Yields, and the Fed: How Monetary Policy Drives Markets
Few forces shape global markets more than U.S. monetary policy. The Federal Reserve’s dual mandate, maximum employment and 2% inflation is the anchor for its decisions. For traders, understanding how these objectives translate into interest rate changes is critical for positioning in gold futures a
Retro Editors' picks 2023Moving onward, for the penultimate time, in our retro EP selection , we present to you the fourth collection of additional scripts that have earned a spot in our Editors' picks, this time from 2023.
These retrospective selections reflect our continued commitment to honoring outstanding contributio

Don’t Be the Exit Liquidity: The Truth About IPOsPicture this: a company wants to go public. They don’t just toss shares on the market like a garage sale. No. The sequence is distinct.
First, the company sits down with the sharpest pencils on Wall Street—the underwriters. These aren’t TikTok stock gurus; they’re analysts whose job is to tear apar
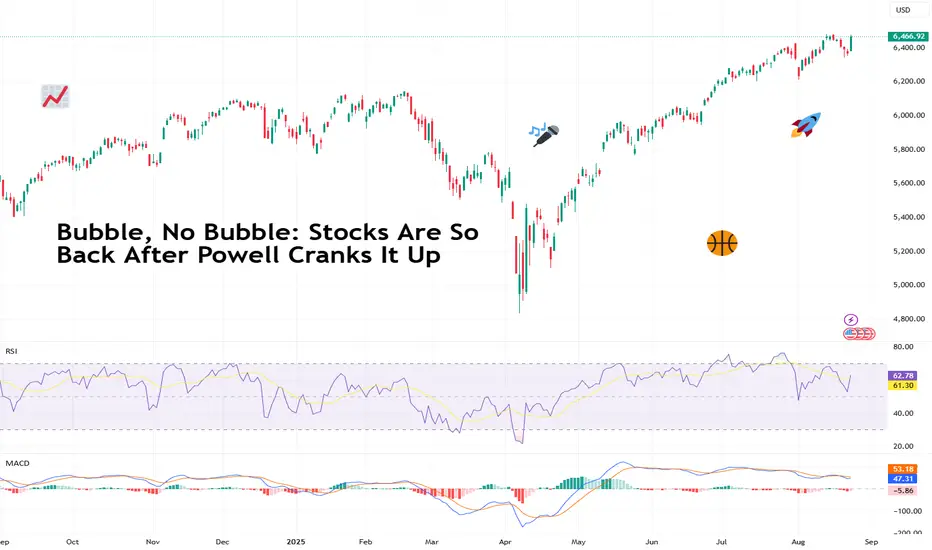
Bubble, No Bubble: Stocks Are So Back After Powell Cranks It UpStretched valuations, talks of froth, and overall market fatigue. That’s what investors were saying for stocks (especially those AI plays) up until Powell brought up the vibe that rekindled the animal spirits. Let’s talk about that.
📈 Powell Drops the Mic
Markets started last week exhausted. Th
Amazon Chart CheckOn the weekly chart, Amazon looks like it’s starting to tire a bit. Price is struggling just under that January high near 24,252.
Looking at the Ichimoku Cloud:
• In mid-2023, price broke strongly above the cloud and bounced cleanly higher after retests.
• More recently (spring 2025), we had a decen

Nvidia Shares Maintain Bearish Bias Near $170Over the past three trading sessions, Nvidia’s shares have posted a sharp decline, accumulating losses of more than 3% in the short term. For now, the emerging selling bias around the stock remains in place, as the market fears a potential overheating of the artificial intelligence industry. Added t

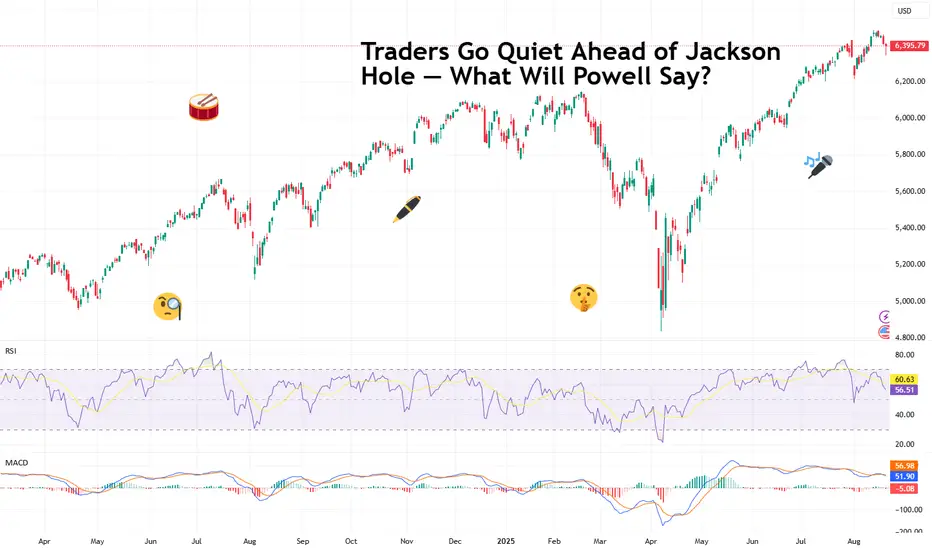
Traders Go Quiet Ahead of Jackson Hole — What Will Powell Say?Markets have been eerily quiet this week. Not because traders suddenly discovered meditation, but because everyone is waiting for one man in Wyoming to make things move.
Federal Reserve Chair Jerome Powell, the man who moves markets with a simple “Good afternoon,” is about to step onto the stage at
See all editors' picks ideas
VWAP Price ChannelVWAP Price Channel cuts the crust off of a traditional price channel (Donchian Channel) by anchoring VWAPs at the highs and lows. By doing this, the flat levels, characteristic of traditional Donchian Channels, are no more!
Author's Note: This indicator is formed with no inherent use, and serves

Fibonacci Sequence Circles [BigBeluga]🔵 Overview
The Fibonacci Sequence Circles is a unique and visually intuitive indicator designed for the TradingView platform. It combines the principles of the Fibonacci sequence with geometric circles to help traders identify potential support and resistance levels, as well as price expansio

ATAI Volume Pressure Analyzer V 1.0 — Pure Up/DownATAI Volume Pressure Analyzer V 1.0 — Pure Up/Down
Overview
Volume is a foundational tool for understanding the supply–demand balance. Classic charts show only total volume and don’t tell us what portion came from buying (Up) versus selling (Down). The ATAI Volume Pressure Analyzer fills that g

Market Cap Landscape 3DHello, traders and creators! 👋
Market Cap Landscape 3D. This project is more than just a typical technical analysis tool; it's an exploration into what's possible when code meets artistry on the financial charts. It's a demonstration of how we can transcend flat, two-dimensional lines and step into

ZigzagLiteLibrary "ZigzagLite"
Lighter version of the Zigzag Library. Without indicators and sub-component divisions
method getPrices(pivots)
Gets the array of prices from array of Pivots
Namespace types: Pivot
Parameters:
pivots (Pivot ) : array array of Pivot objects
Returns: array array

ZigzagLibrary "Zigzag"
Zigzag related user defined types. Depends on DrawingTypes library for basic types
method tostring(this, sortKeys, sortOrder, includeKeys)
Converts ZigzagTypes/Pivot object to string representation
Namespace types: Pivot
Parameters:
this (Pivot) : ZigzagTypes/Pivot

Angled Volume Profile [Trendoscope]Volume profile is useful tool to understand the demand and supply zones on horizontal level. But, what if you want to measure the volume levels over trend line? In trending markets, the feature to measure volume over angled levels can be very useful for traders who use these measures. Here is an att

MathEasingFunctionsLibrary "MathEasingFunctions"
A collection of Easing functions.
Easing functions are commonly used for smoothing actions over time, They are used to smooth out the sharp edges
of a function and make it more pleasing to the eye, like for example the motion of a object through time.
Easing function

Treasury Yields Heatmap [By MUQWISHI]▋ INTRODUCTION :
The “Treasury Yields Heatmap” generates a dynamic heat map table, showing treasury yield bond values corresponding with dates. In the last column, it presents the status of the yield curve, discerning whether it’s in a normal, flat, or inverted configuration, which determined by us

Time & Sales (Tape) [By MUQWISHI]▋ INTRODUCTION :
The “Time and Sales” (Tape) indicator generates trade data, including time, direction, price, and volume for each executed trade on an exchange. This information is typically delivered in real-time on a tick-by-tick basis or lower timeframe, providing insights into the traded size

See all indicators and strategies
Community trends
Nvidia - The rally is still not over!🔌Nvidia ( NASDAQ:NVDA ) still heads much higher:
🔎Analysis summary:
For the past decade, Nvidia has perfectly been respecting a major bullish rising channel formation. Currently, Nvidia is still far away from the upper red resistance trendline, which indicates another potential move higher. J

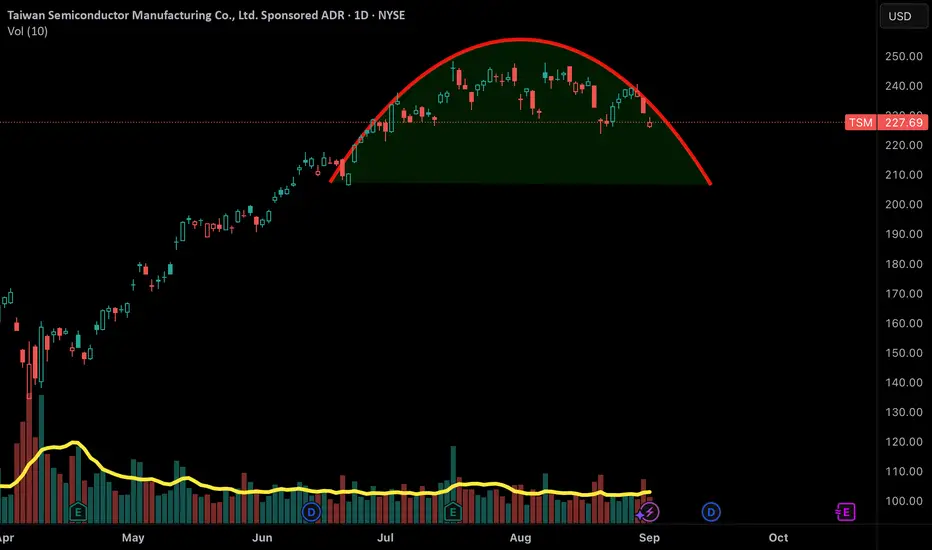
Could this be a round top formation?If this becomes a top formation, then another 10-12% correction could be the possibility!
If a strong ticker like TSM go down 10-12% then meme stocks will crash 30-50%!
AMD (2025+) Catalysts & Risks: 300 USD PT Bulls🟥 AMD (2025+) Catalysts & Risks: Analyst Views
________________________________________
🔑 Key Catalysts Driving AMD’s Stock Growth (2025+)
🌌 Quantum-Centric Supercomputing with IBM
AMD’s collaboration with IBM to merge CPUs/GPUs with quantum computing promises a whole new class of hybrid archi

9/2/2025 NVDAPotential downside and seasonal weakness to show in the coming weeks. Look for resistance $170-175 range. Target downwards moves into $165 - 155 - 150 - 147 and potentially a move into $135 before expiration for maximum opportunity.

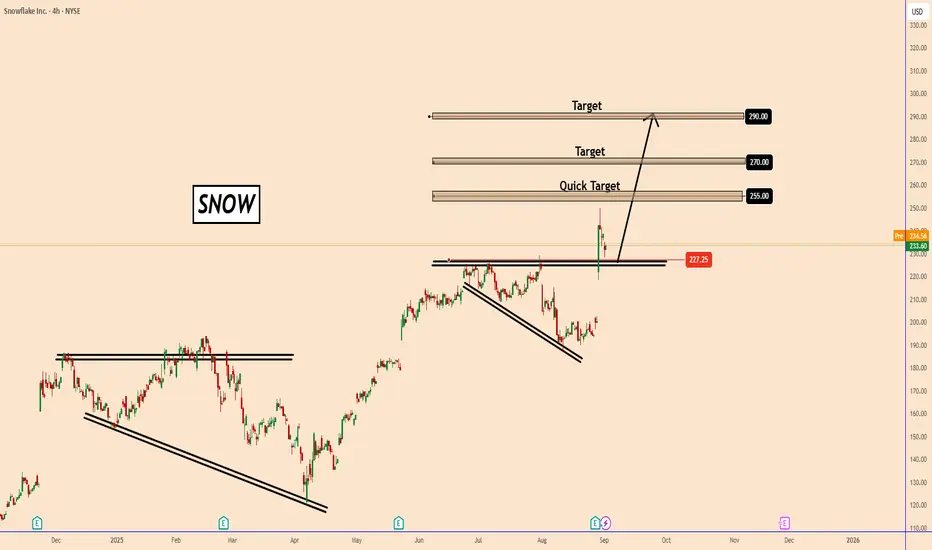
SNOW: Bullish Setup ExplainedSNOW: Bullish Setup Explained
SNOW broke upward and the current pattern looks similar to the pattern on the left side of the chart, signaling strong bullish momentum.
We can observe a clean breakout above the resistance zone near $227.
Sharp bullish candle confirms momentum.
If SNOW holds above
Wolfspeed Inc Forcasting Target price between 5.80$ - 6.00$ .
Macd crossing each other where gives Forcasting max Target price at that level.
Luxalgo indicator 💯👌 Macd forecast indicator.
I believe some massive Positive news will be announced very soon 🔊

TSLA support $324.48 has to hold for longTSLA bounced off $35 range support this morning on 4 hour was oversold. Needs to hold $324.48 bottom of uptrend support to see wave 5 target of $426 otherwise the trade is no longer valid and will need to wait for another support and oversold condition to go long

JNJ | Long Setup | Accumulation Breakout | Sep 2, 2025📌 JNJ | Long Setup | Accumulation Breakout + ROI Horizon Q4 2026 | Sep 2, 2025
🔹 Thesis Summary
Johnson & Johnson has broken out of a multi-year accumulation range with a confirmed retest. Despite flat analyst outlooks, the asymmetric reward profile, institutional interest, and macro hedge potenti

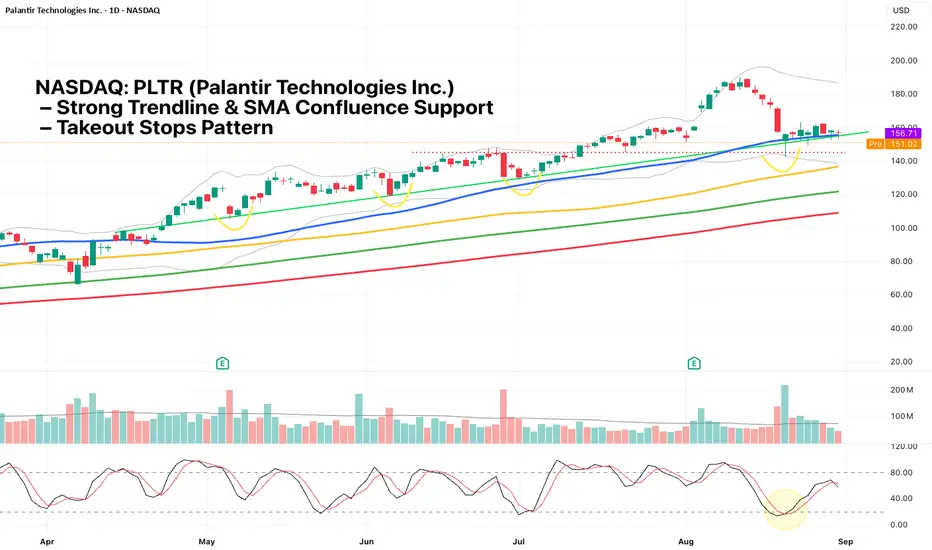
NASDAQ: PLTR – Strong Trendline & SMA Confluence SupportNASDAQ: PLTR Palantir remains in a clear uptrend with the moving averages aligned (SMA 50 > SMA 100 > SMA 150 > SMA 200). Since April, price has consistently traded above the 50-day SMA, finding support on each pullback to the trendline (green line). This trendline has been tested four times over th
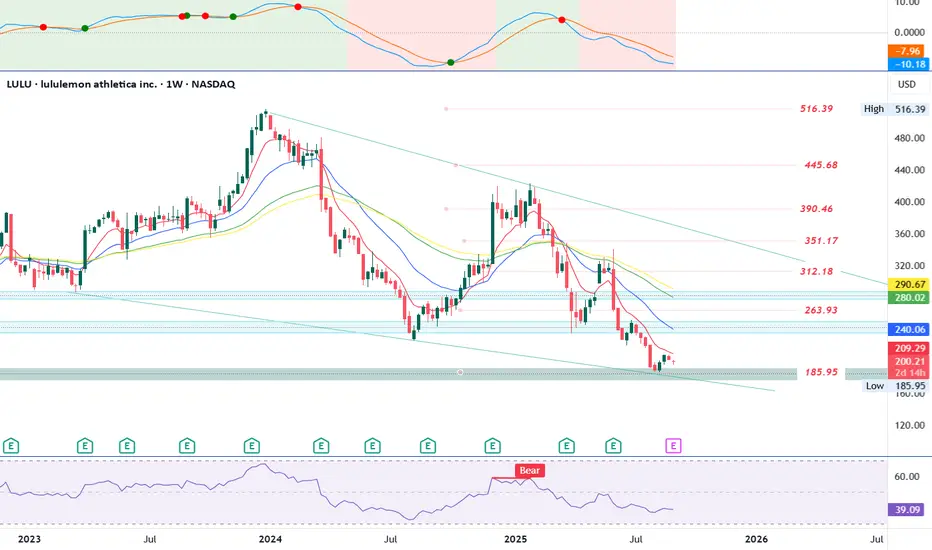
LULU at Critical Support – Bounce or Breakdown Post-Earnings?Trend Overview:
LULU has been in a clear downtrend since its peak near $516, forming consistent lower highs and lower lows.
Price is currently in the $200–$209 zone, sitting just above the long-term support area around $186.
Support & Resistance Levels:
Immediate Support: $200 → $186 (critical sup
See all stocks ideas
Today
DLTRDollar Tree, Inc.
Actual
0.77
USD
Estimate
0.42
USD
Today
JILLJ. Jill, Inc.
Actual
0.81
USD
Estimate
0.75
USD
Today
MMacy's Inc
Actual
0.41
USD
Estimate
0.19
USD
Today
REVGREV Group, Inc.
Actual
0.79
USD
Estimate
0.63
USD
Today
CXMSprinklr, Inc.
Actual
0.13
USD
Estimate
0.10
USD
Today
CPBThe Campbell's Company
Actual
0.62
USD
Estimate
0.56
USD
Today
BNEDBarnes & Noble Education, Inc
Actual
—
Estimate
—
Today
CULPCulp, Inc.
Actual
—
Estimate
−0.12
USD
See more events
Community trends
BTC - Perfect Bullish SetupPrice Action Breakdown
After running the lows with a clear Sell Side Liquidity Sweep, BTC quickly reversed and printed a Market Structure Shift (MSS). This marked the first real sign that the market might be ready to transition from weakness into strength.
Retracement Zone
Price is now retracing

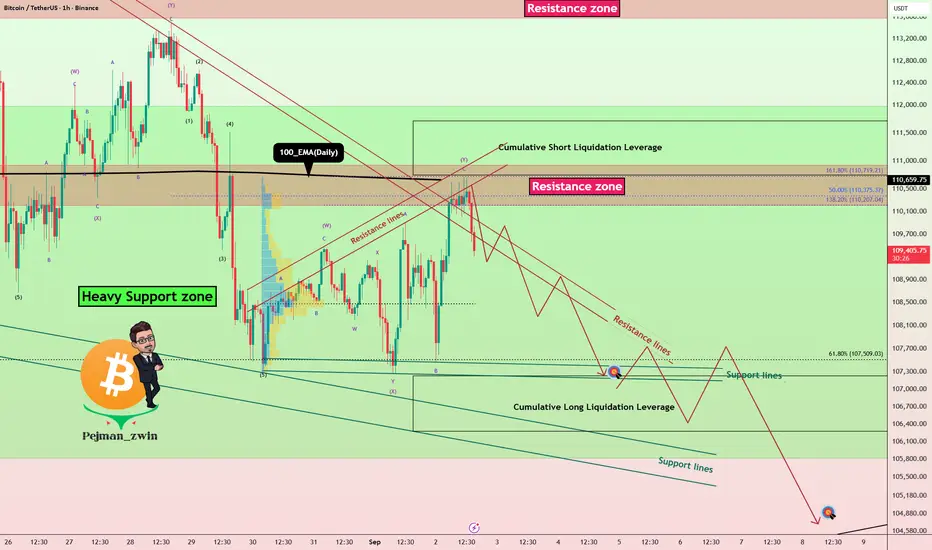
Bitcoin’s Heavy Support Zone Under Attack–Will It Finally Break?Bitcoin ( BINANCE:BTCUSDT ) currently appears to have completed its pullback to the 100_EMA(Daily) , and Bitcoin has failed to break the Resistance lines with high momentum. The Resistance zone($110,920-$110,200) , Resistance lines , and Cumulative Short Liquidation Leverage($111,711-$110,
Bitcoin - Bloodbath in September is here! Bitcoin below 100k?September is starting, and we know that statistically September is the most devastating month, not only for Bitcoin but also for the stock market. You probably don't want to be in a long position during this period of time if you don't like adrenaline. Re-buy in the middle of October, but let's see

Bitcoin – Is This the Buy Zone?BTC has been trading inside this purple demand zone after a sharp drop from recent highs. The zone has already produced multiple wicks, showing buyers are stepping in, but momentum still looks weak.
✅ Bullish Case
If BTC continues to hold this demand area and confirms with a strong bullish candle

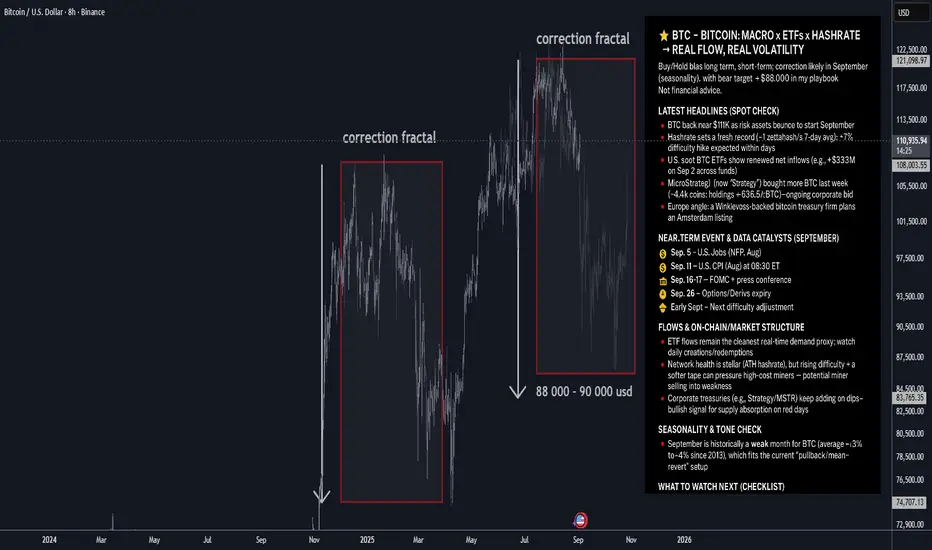
BTC — Bitcoin: Macro x ETFs x Hashrate → Real Flow, Real Volatil⭐️ BTC — Bitcoin: Macro x ETFs x Hashrate → Real Flow, Real Volatility
Buy/Hold bias long term; short-term: correction likely in September (seasonality), with bear target ≈ $88,000 in my playbook.
🔥 Latest headlines (spot check)
🔸BTC back near $111K as risk assets bounce to start September.
🔸H
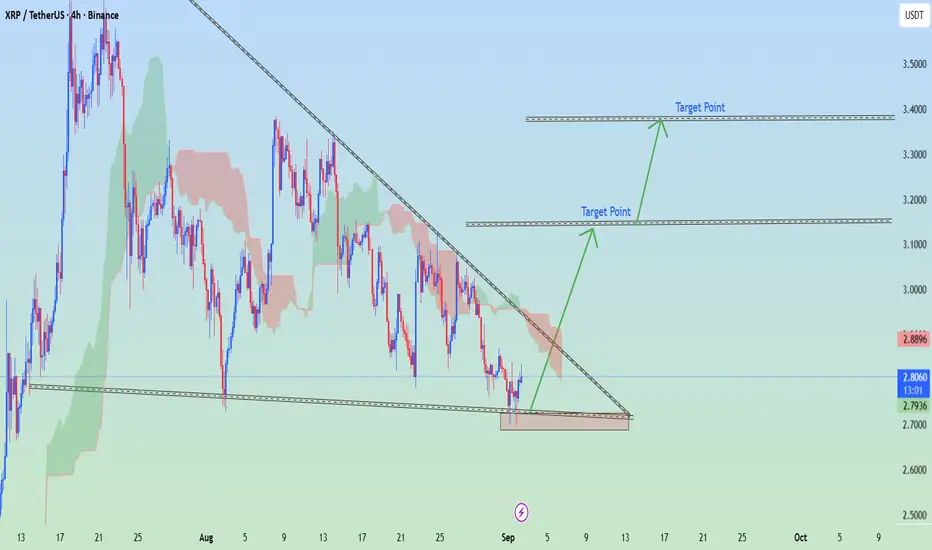
XRP/USDT on Binance (4H timeframe)XRP/USDT on Binance (4H timeframe). I drawn an ascending trendline with breakout projection arrows and labeled “Target Point”.
📌 Based on My chart setup:
Current price: around 2.28 USDT
First Target Point: ~ 3.00 USDT
Second Target Point: ~ 3.40 USDT
⚠ Key Notes:
These levels match the breako
BITCOIN dominance crashing. Are we ahead of a major Altseason?Bitcoin (BTCUSD) is on a relative correction lately, down more than $15000 from its last All Time High (ATH). Despite this obvious technical weakness, there is one indicator that delivers a very promising signal, not just for BTC but for the crypto market as a whole.
That is Bitcoin's Dominance (BT

$BTC.D Head and Shoulders Topple to 42%If I were a betting man, this is what the future holds for ₿itcoin Dominance.
A head and shoulders pattern could very well be the eventual topple for CRYPTOCAP:BTC.D as we see it make it's way down to 42% which follows previous cycle's trend.
the RSI shows room for correction back up for one mo

XRP LONGI have marked out the weekly range on XRP which has swept the liquidity of the last week.
As well as tapped into the weekly Bullish FVG.
This gives me confluence to long XRP as seen on the graph.
My entry lies on the body of a 30M OB.
Take profit targets and SL are visible on the chart.
Feel fr

BTC/USD (Bitcoin vs USD).BTC/USD (Bitcoin vs USD)
Timeframe: 2-hour (2H)
Indicators: Ichimoku Cloud, Trendline, Support/Resistance zones
---
📊 Indicators Used
1. Ichimoku Cloud
Price recently broke above the descending trendline and is pushing into the cloud.
If it sustains above the cloud, that signals a potential t

See all crypto ideas
Gold Hits New ATH – Is a Bearish Crab Reversal Next?Gold ( OANDA:XAUUSD ) started to rise today after the release of the
ISM Manufacturing PMI index formed a new All-Time High(ATH) .
The question is what price range could the new ATH price range for gold be in?
Gold is currently moving near the Potential Reversal Zone(PRZ)($3,557-$3,531)

Gold: Is Market Manipulation Driving the Move?Gold: Is Market Manipulation Driving the Move?
Gold hit 3509 today but quickly dropped back below 3500. As long as it stays under this level, a sell-off remains likely. I don’t expect any major news to trigger this move—it could simply unfold without a clear reason, just like the recent bullish wa

XAU/USD | Gold Breaks $3500 – New ATH Hit! What’s Next?By analyzing the gold chart on the 12-hour timeframe, we can see that today, gold finally managed to print a new All-Time High (ATH)! As anticipated, price broke above $3500 and rallied up to $3508, hitting our previous bullish target and sweeping the liquidity resting above the key $3500 level.
Af

XAUUSD: Very Risky for Either SideXAUUSD has recently seen a strong move to the upside. But I believe that is about to end.
A correction after such a move up is high probability, as price is starting to show early signs that sellers are stepping in discreetly.
I would target a level at around 3,400. But only price will give us som

Gold is ready to make new record XAUUSD is holding above support and pushing higher, targeting the new high zone around 3530 if momentum sustains.

GOLD ROUTE MAP UPDATEHey Everyone,
After completing Bullish Targets 3458 and 3477 yesterday, we got the EMA5 cross and lock above 3477, which opened 3497. That level was hit perfectly today. With no lock above, we confirmed the rejection, and now price is showing support and bounce at 3477.
We are now seeing play betw

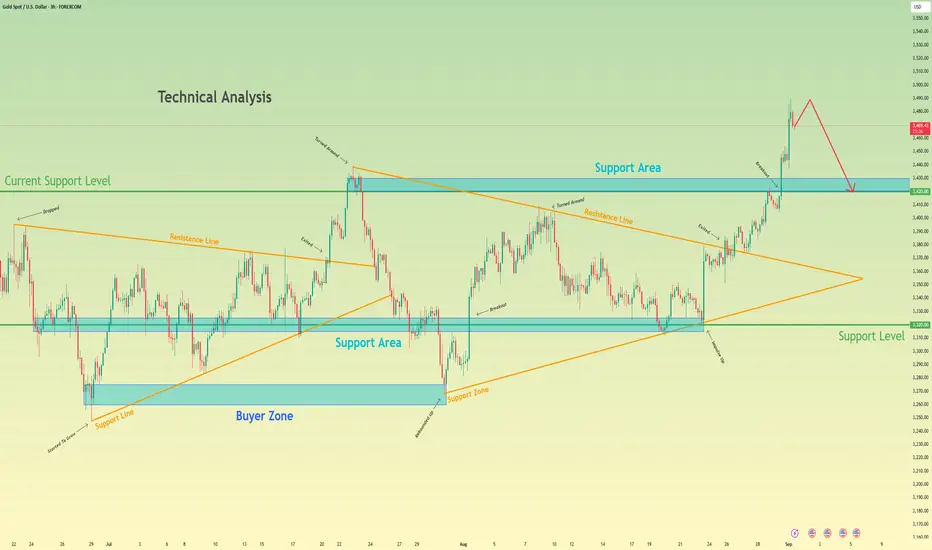
Gold may make correction, after strong upward movementHello traders, I want share with you my opinion about Gold. The prolonged period of consolidation for Gold has decisively resolved to the upside, following a powerful breakout from a multi-week symmetrical wedge. This event signalled a clear shift in market control to buyers, invalidating the prior
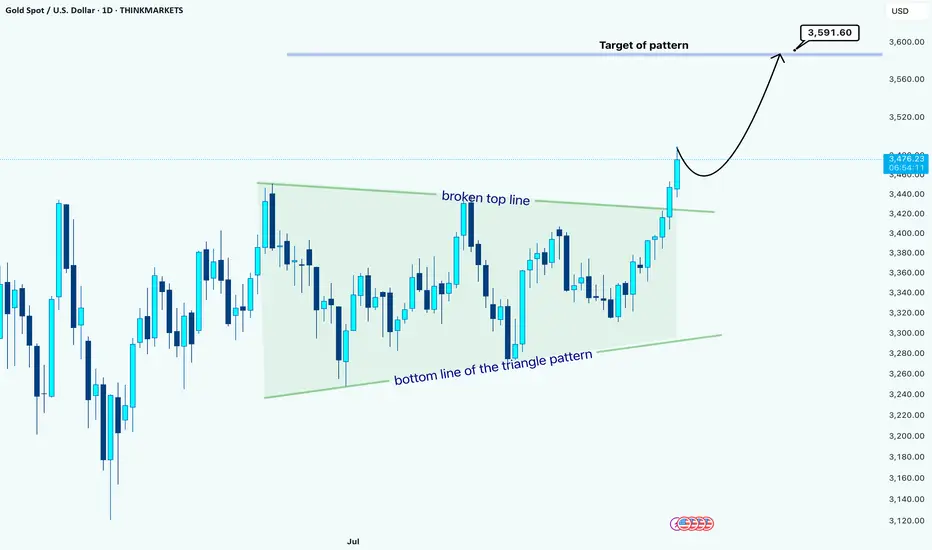
Gold Daily Chart Analysis –> Triangle BreakoutHello guys!
Gold has finally broken out of a large triangle consolidation pattern that has been building for weeks. The price action respected both the top resistance line and the bottom support line multiple times, showing clear compression before the breakout.
🚀 Recently, the price broke above t
Gold Continues to Create New HistoryHello, it’s a pleasure to see you again in today’s discussion about OANDA:XAUUSD . In this analysis, I have chosen the D1 chart for evaluation.
At the time of writing, gold continues to rise higher. The metal has reached the highest level in history, trading at 3535 USD. Previously, we had expect

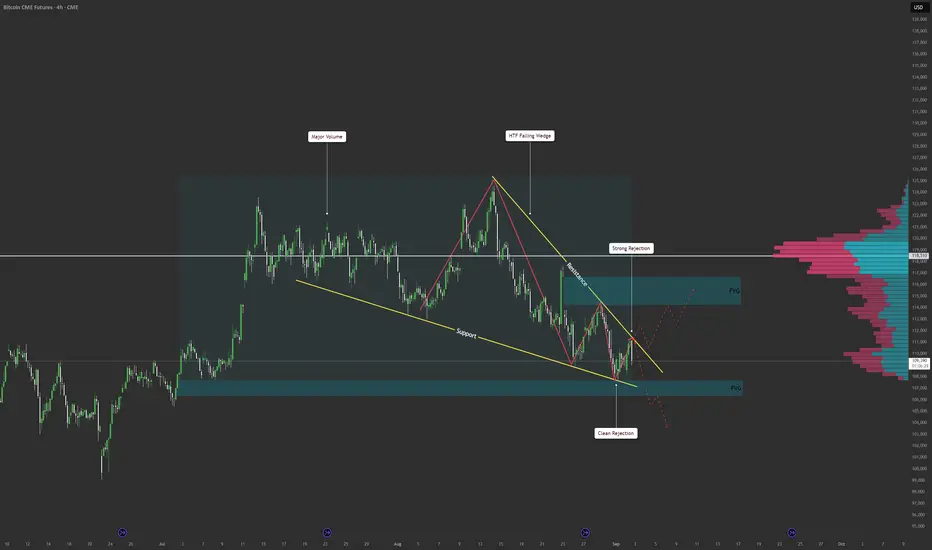
BTC Futures – Falling Wedge Break Incoming? | 4H AnalysisBitcoin CME Futures is currently trading inside a falling wedge on the 4H timeframe.
We’re sitting at a key decision point, with liquidity both above and below.
Volume profile shows strong resistance, with a large high-volume node.
Support has held, with a clean rejection and demand showing up.
Fair
See all futures ideas
USD/CHF - Wedge Breakout (02.09.2025)The USD/CHF pair on the M30 timeframe presents a Potential Buying Opportunity due to a recent Formation of a Wedge Breakout Pattern. This suggests a shift in momentum towards the upside and a higher likelihood of further advances in the coming hours.
Possible Long Trade:
Entry: Consider Entering

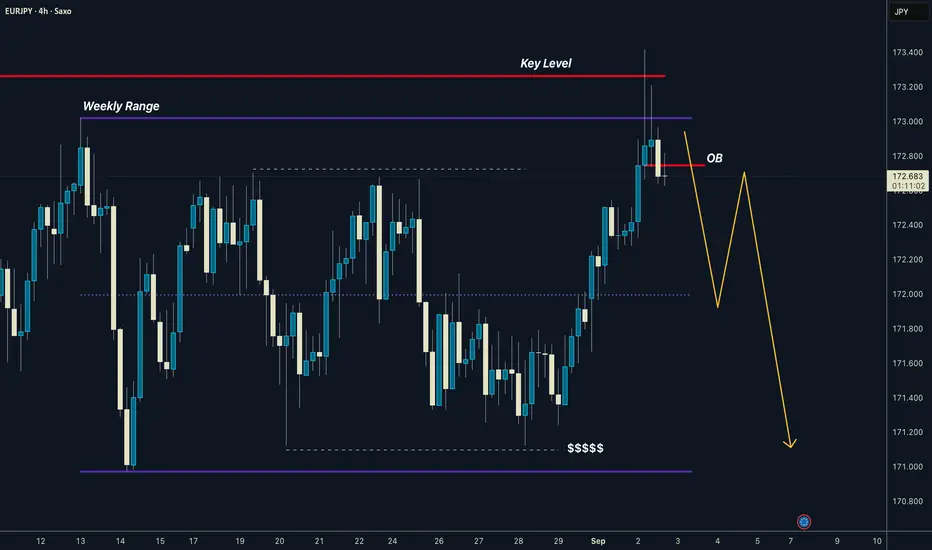
EURJPY Weekly Range I Key Level OB - ShortWekly range was nice manipulated, and now we have change in order flow on H4.
First TP 50% of the range, then potentially full range.
If you want to make money, you need to develop two things:
1/ An edge in the market
2/ An ability to be consistent with that edge
If you're lacking an edge, spend
AUDJPY looks ready for a big leg upLooking at AUDJPY and how it behaves right now, I find it quite interesting.
Price has been coiling and look at the way it rose. Step by step. Meaning buyers are stepping in slowly.
Now, I would way for a confirmation first, with a long position towards 98,300.
What makes this setup different cou

GBP/JPY SetupThis analysis shows GBP/JPY trading near 198.59, with support at 198.04 and resistance at 200.25. A bullish move is expected if price holds above support, targeting 200.24 and 202.05. The trend line supports upward momentum, while a break below support may weaken the bullish outlook.

GBPNZD in Freefall: Bond Yields Spike, Pound Crumbles GBPNZD in Freefall: Bond Yields Spike, Pound Crumbles
From our previous analysis, GBPNZD tested the daily structure zone near 2.3200 and reacted strongly. The pair has since dropped nearly 360 pips, reaching the first target at 2.2850.
This morning, during the London session, the GBP faced heav

EURUSD at a Breakout PointHello my wonderful friends, what do you think about FX:EURUSD ?
Today, the pair is trading around 1.172, approaching both the resistance zone and the trendline cap after several days of consolidating at support. Previously , we had set this level as our target, and now it has been reached.
A b

EURUSD: Consolidation ContinuesThe EURUSD pair is currently consolidation within a horizontal parallel channel.
A bearish response to the resistance level has been observed, with the price exhibiting a change of character (CHOCH), followed by a decline.
There is a strong likelihood of the price reaching the 1.1602 level in the

USDJPY 30Min Engaged ( Bullish Reversal Entry Detected )Time Frame: 30-Minute Warfare
Entry Protocol: Only after volume-verified breakout
🩸Bullish Reversal - 147.650
➗ Hanzo Protocol: Volume-Tiered Entry Authority
➕ Zone Activated: Dynamic market pressure detected.
The level isn’t just price — it’s a memory of where they moved size.
Volume is rising be

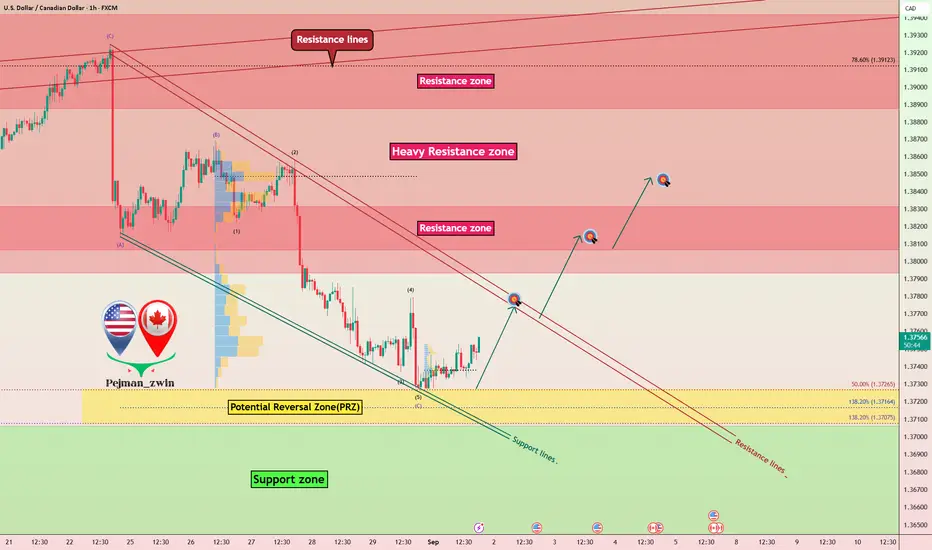
USDCAD Long Setup: From PRZ to Resistance LinesToday, I want to review the USDCAD ( OANDA:USDCAD ) long position with you.
USDCAD has reacted well to Support lines and the Potential Reversal Zone(PRZ)(1.373 CAD-1.370 CAD) .
From the perspective of Elliott wave theory , it seems that USDCAD has completed the microwave 5 of the main
GBPUSDHello Traders! 👋
What are your thoughts on GBPUSD?
After rejecting a resistance area, GBP/USD has entered a corrective phase and is now approaching a high-confluence support zone, where multiple technical elements align
Price is expected to show bullish reaction within the support zone after some

See all forex ideas
| - | - | - | - | - | - | - | ||
| - | - | - | - | - | - | - | ||
| - | - | - | - | - | - | - | ||
| - | - | - | - | - | - | - | ||
| - | - | - | - | - | - | - | ||
| - | - | - | - | - | - | - | ||
| - | - | - | - | - | - | - | ||
| - | - | - | - | - | - | - |
Trade directly on the supercharts through our supported, fully-verified and user-reviewed brokers.


