Tesla Stock Wobbles as Profit Dives 37%, Revenue Pops. Now What?Tesla NASDAQ:TSLA posted a 12% jump in revenue on Wednesday, reaching $28.1 billion, well above Wall Street’s $26.37 billion estimate. And yet, the stock slipped nearly 1% on the day before paring back that loss with a 2.3% Thursday gain.
Why? Because profits fell faster than Cybertruck’s reput

The best trades require research, then commitment.
Get started for free$0 forever, no credit card needed

Scott "Kidd" PoteetThe unlikely astronaut

Where the world does markets
Join 100 million traders and investors taking the future into their own hands.

Gold 1979 vs 2025 — When History Whispers and Markets Listen
🌕 1. The Echo of 1979
In 1979, the world watched Gold do the impossible. The metal surged from $226 to over $850 per ounce in less than a year, a 275% explosion that turned fear into fortune.
The triggers were seismic.
🇮🇷 The Iranian Revolution disrupted global oil flows.
🏛️ The U.S. Embassy host

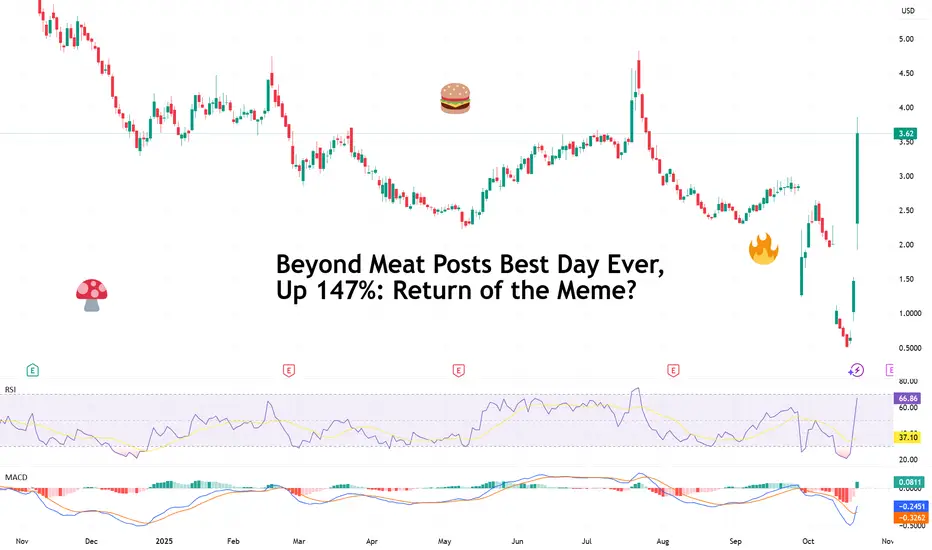
Beyond Meat Posts Best Day Ever, Up 147%: Return of the Meme?🔥 A Sizzling Comeback or Just Froth?
Beyond Meat NASDAQ:BYND , once the darling of the plant-based revolution and later the focus of every “overcooked IPO” joke, just got on everyone’s radar: a 147% single-day surge, its best performance ever.
For a company that was trading at just 65 cents las
Silver bull will try to throw you off, but long term healthyA pause that could refresh might be warranted in silver and gold.
I am still optimistic for precious metals long term.
Silver is still undervalued based on historical metrics and money supply.
I worry about the rise in metals and what it implies for the broad stock market indices.

Gold Analysis: Break Above $4,293 Could Trigger a New HighHi guys!
Gold has been moving inside a clear ascending channel, respecting both its upper and lower boundaries. Recently, we saw a double top formation near the upper trendline , which triggered a corrective move down to the $4,190–$4,200 support zone, an area that has already shown strong buying

Moment of Fate - BTC Analysis (3D)There are many reasons to go up but also going down is starting to look way more charming than ever right now.
Let's examine what we have;
-FED is about to cut rates for a second time but we'll most likely to see another rate cut in december which is bullish af.
-All companies are keeping buying
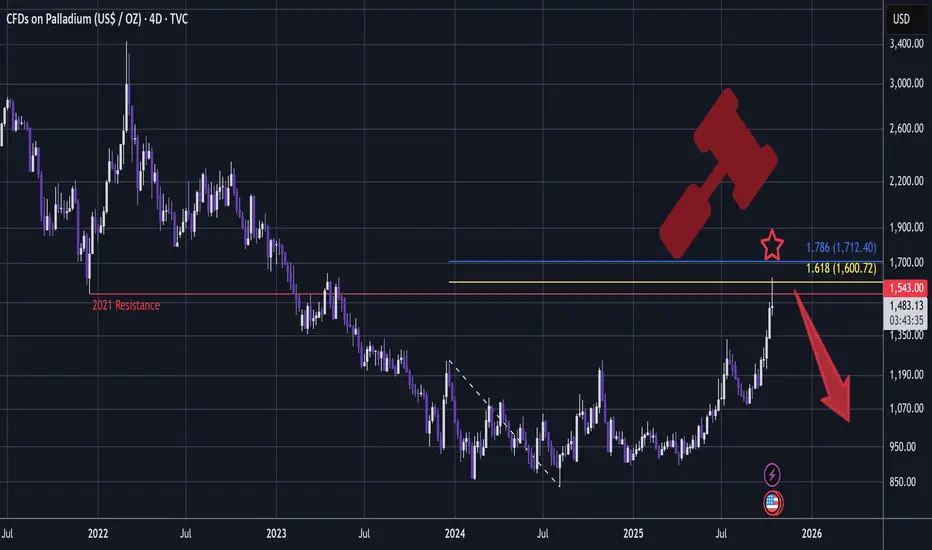
PALLADIUM - Short Setup, Bearish Rotation In MetalsA very bearish setup is developing:
Since the top, there is nowhere on the chart that has a whipsawing candle like this:
A very big Shooting Star!
This setup has my favourite conditions met:
- Whipsawing candle that sweeps liquidity through key resistance (2021)
- Tidy 1.618 Golden Window (1.6
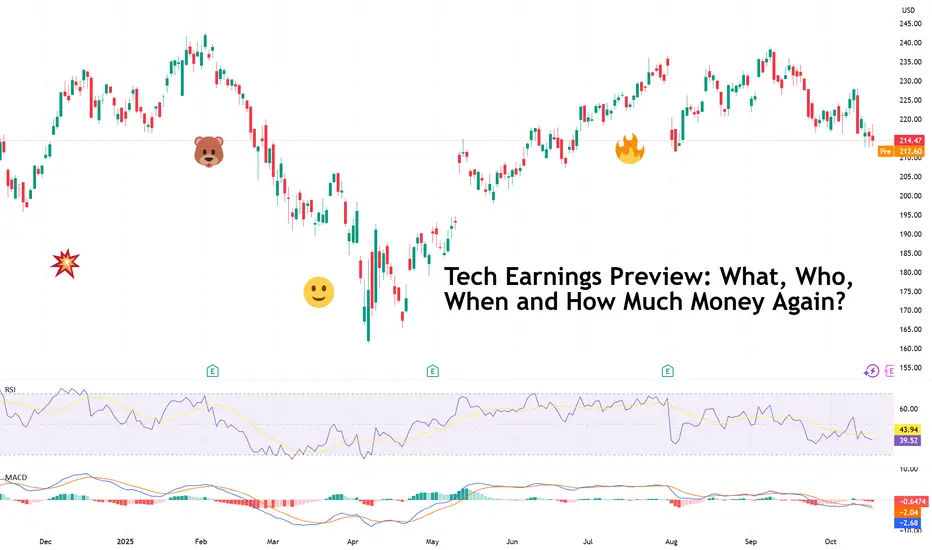
Tech Earnings Preview: What, Who, When and How Much Money Again?“ I don’t know, probably at least around $600 gazillion dollars ,” Zuck, probably if you asked him how much Meta NASDAQ:META will spend over the fiscal year.
It’s earnings season , which means Wall Street’s most expensive hobby — guessing how much the tech giants will make while pretending it’s
Tesla (TSLA) — Momentum Reload or Major Cooldown?The Next $400–$450 Decision Zone!
🧭 Weekly Chart — Big Picture Momentum
Tesla has printed one of the cleanest BOS (Break of Structure) patterns on the weekly timeframe since the post-2023 recovery, confirming that the macro downtrend has flipped into a sustained bullish expansion. The stock ripped

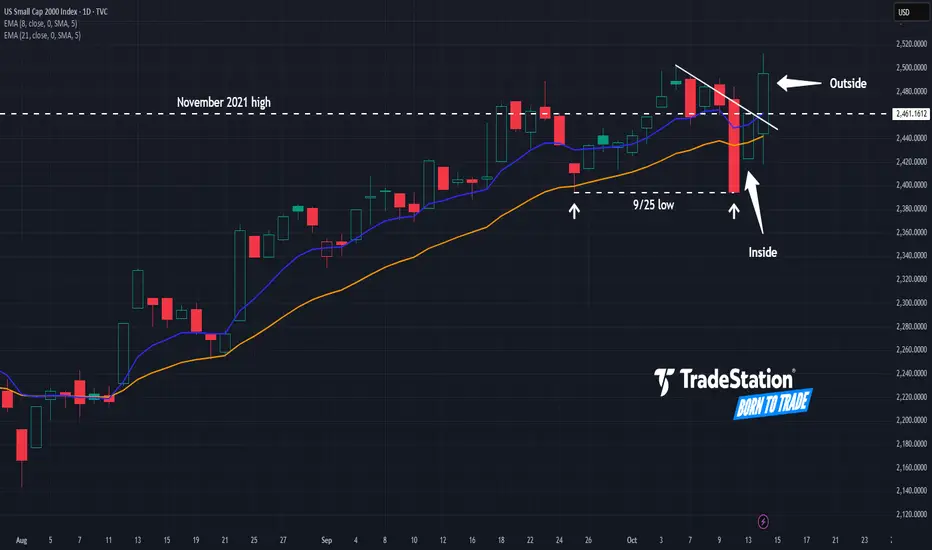
Small Caps: Finally a Breakout?The Russell 2000 has been stuck in a rut for years, but some traders may think the small-cap index has finally achieved escape velocity.
The first pattern on today’s chart is the November 2021 high around 2,460, where prices stalled last November. RUT has gotten above it this month and refused to s
See all editors' picks ideas
Fair Value Gaps by DGTFair Value Gaps
A refined, multi-timeframe Fair Value Gap (FVG) detection tool that brings institutional imbalance zones to life directly on your chart.
Designed for precision, it visualizes how price delivers into inefficiencies across chart, higher, and lower (intrabar) timeframes — offering a fl

TASC 2025.11 The Points and Line Chart█ OVERVIEW
This script implements the Points and Line Chart described by Mohamed Ashraf Mahfouz and Mohamed Meregy in the November 2025 edition of the TASC Traders' Tips , "Efficient Display of Irregular Time Series”. This novel chart type interprets regular time series chart data to create an ir

Simplified Percentile ClusteringSimplified Percentile Clustering (SPC) is a clustering system for trend regime analysis.
Instead of relying on heavy iterative algorithms such as k-means, SPC takes a deterministic approach: it uses percentiles and running averages to form cluster centers directly from the data, producing smoo

Adaptive Volume Delta Map---
📊 Adaptive Volume Delta Map (AVDM)
What is Adaptive Volume Delta Map (AVDM)?
The Adaptive Volume Delta Map (AVDM) is a smart, multi-timeframe indicator that visualizes buy and sell volume imbalances directly on the chart.
It adapts automatically to the best available data resolution

Dynamic Equity Allocation Model"Cash is Trash"? Not Always. Here's Why Science Beats Guesswork.
Every retail trader knows the frustration: you draw support and resistance lines, you spot patterns, you follow market gurus on social media—and still, when the next bear market hits, your portfolio bleeds red. Meanwhile, institution

First Passage Time - Distribution AnalysisThe First Passage Time (FPT) Distribution Analysis indicator is a sophisticated probabilistic tool that answers one of the most critical questions in trading: "How long will it take for price to reach my target, and what are the odds of getting there first?"
Unlike traditional technical indicators

PongExperience PONG! The classic arcade game, now on your charts!
With this indicator, you can finally achieve your lifelong dream of beating the Markets. . . at PONG!
Pong is jam-packed with features! Such as:
2 Paddles
A moving dot
Floating numbers
The idea of a net
This indicator is solel

Options Max Pain Calculator [BackQuant]Options Max Pain Calculator
A visualization tool that models option expiry dynamics by calculating "max pain" levels, displaying synthetic open interest curves, gamma exposure profiles, and pin-risk zones to help identify where market makers have the least payout exposure.
What is Max Pain?
Max

Volume Profile 3D (Zeiierman)█ Overview
Volume Profile 3D (Zeiierman) is a next-generation volume profile that renders market participation as a 3D-style profile directly on your chart. Instead of flat histograms, you get a depth-aware profile with parallax, gradient transparency, and bull/bear separation, so you can see w

RiskMetrics█ OVERVIEW
This library is a tool for Pine programmers that provides functions for calculating risk-adjusted performance metrics on periodic price returns. The calculations used by this library's functions closely mirror those the Broker Emulator uses to calculate strategy performance metrics (

See all indicators and strategies
Community trends
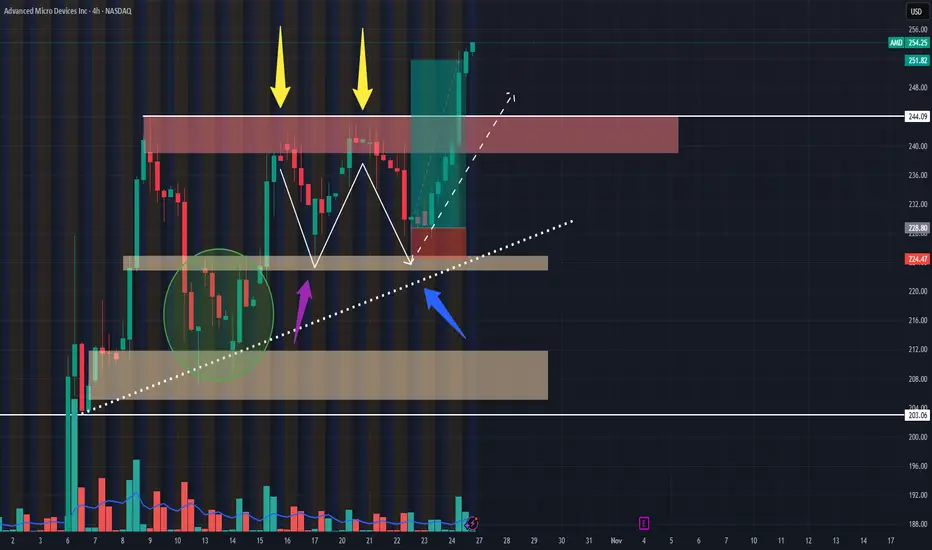
AMD Went Crazy!!! Post Trade Analysis 10/25/24Hello all,
This is my first time posting on here. So, please feel free to leave any questions, advice, or anything else in the comments!
I took this AMD swing trade on the 10/22/25 @ 2:12ish PM CST.
POSITION:
1 $300 Strike Call Exp Nov 7th 2025
Risk: $30 (price takes out low of hammer candle)
I
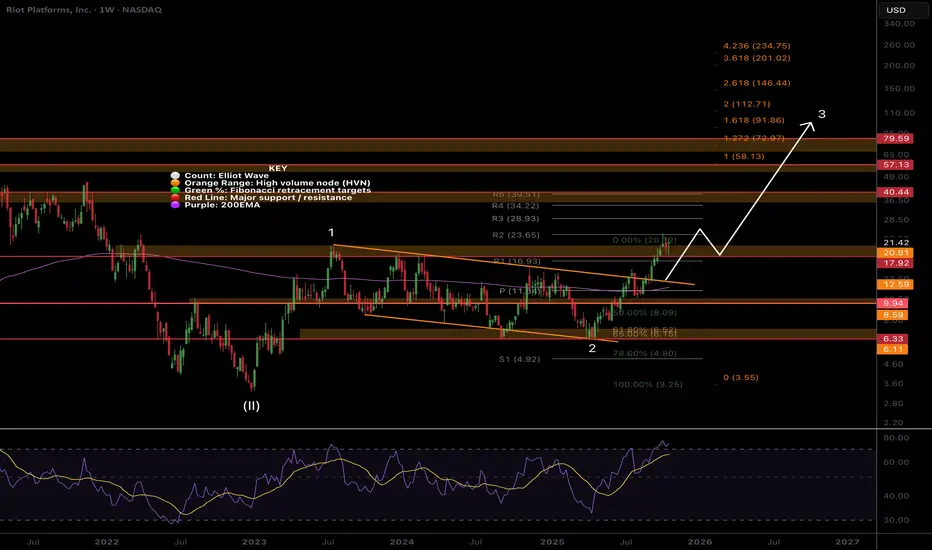
RIOT upwards momentum well in tactNASDAQ:RIOT Price remains in momentum breaking out of the channel in a wave 3 with a minimum target of the 1.618 Fibonacci extension at $91, a 4x from here.
Wav 2 completed at triple support- Fibonacci golden pocket, High Volume Node and channel boundary before quickly overcoming the weekly pivot
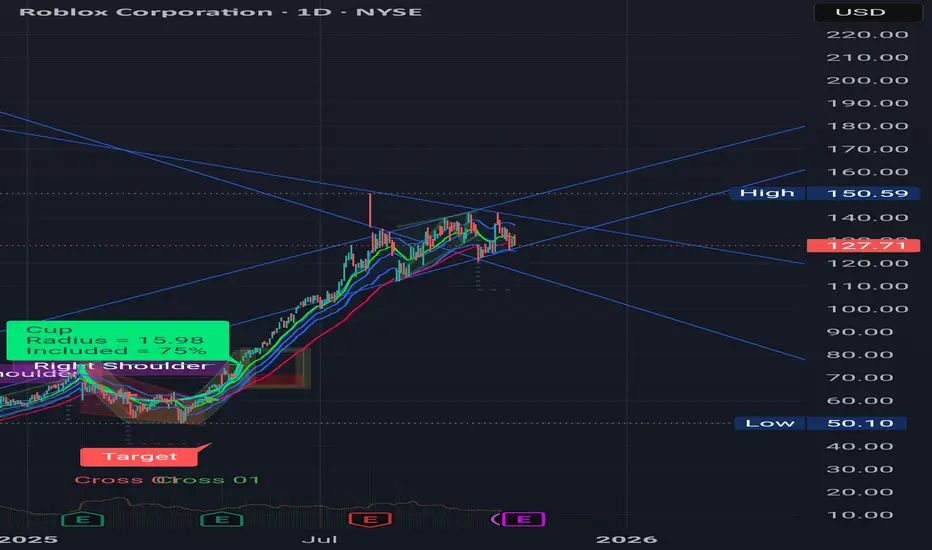
Are these lines Real or ImaginaryWill Roblox go Up against common sense or Down against many Analysts targets?
Which force will prevail?
Or will it take the rise of a competitor to knock this behemoth down?
What do you think?
Tesla Stock Wobbles as Profit Dives 37%, Revenue Pops. Now What?Tesla NASDAQ:TSLA posted a 12% jump in revenue on Wednesday, reaching $28.1 billion, well above Wall Street’s $26.37 billion estimate. And yet, the stock slipped nearly 1% on the day before paring back that loss with a 2.3% Thursday gain.
Why? Because profits fell faster than Cybertruck’s reput
TESLA On The Rise! BUY!
My dear followers,
This is my opinion on the TESLA next move:
The asset is approaching an important pivot point 433.50
Bias - Bullish
Safe Stop Loss - 429.07
Technical Indicators: Supper Trend generates a clear long signal while Pivot Point HL is currently determining the overall Bullish tre

Tesla Macro ChartSharing my Macro Chart.
Use this as a reference for the levels of interest mentioned in my previous tesla post. Added a 30 minute box within the weekly balance box.
I like to personally use this chart to monitor levels intraday on the 30 minute or to plan major shorts or buys.
Some of these level

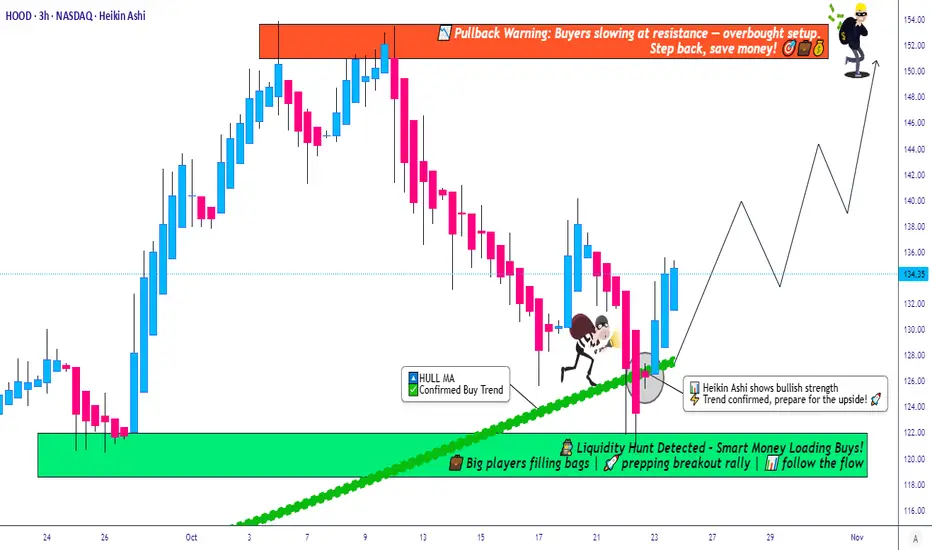
Wedge??Will the wedge follow through with a big bullish push to the upside. Minor resistance around $135 but long term hold will achieve much higher returns at a major resistance.

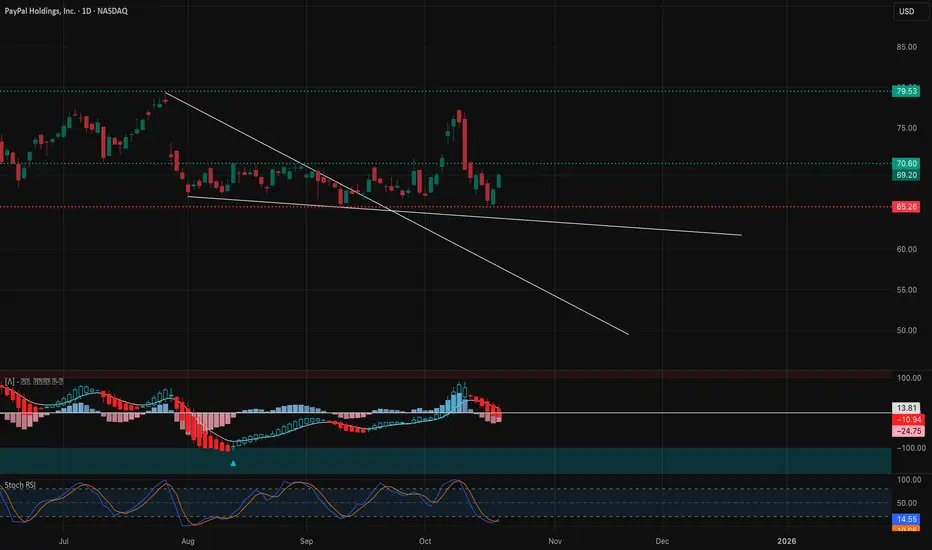
PYPL Weekly Outlook (Oct 21–25): Buyers Defend the BaseCan Bulls Reclaim $70? 🚀
📆 Daily Chart — Macro Structure and Bias
Market Structure:
PayPal (PYPL) continues to trade within a broad descending channel but is showing early signs of structural stabilization. After several failed breakdowns, bulls defended the $64.50–$65.00 demand zone — a key level
PALANTIR sitting on a Buy Zone. Target $220.Palantir (PLTR) has been trading within a Channel Up since early May and is currently consolidating on its bottom (Higher Lows trend-line). while holding he 1D MA50 (red trend-line). The 4H MA50 (blue trend-line) - 1D MA50 range has been technically the most optimal buy zone of this pattern.
With t

Is HOOD Ready for a Bullish Comeback?🎯 HOOD: The Pullback Heist - When Robinhood Gets Robbed! 💰
📊 Asset Overview
Robinhood Markets Inc. (HOOD) - Because even Robinhood needs a little robbing sometimes! 🏹
🔍 Technical Setup - The Perfect Storm ⛈️
Ladies and gentlemen, gather 'round! We've got ourselves a textbook setup that's so clean,
See all stocks ideas
Tomorrow
RVTYRevvity, Inc.
Actual
—
Estimate
1.14
USD
Tomorrow
BOHBank of Hawaii Corporation
Actual
—
Estimate
1.17
USD
Tomorrow
LKFNLakeland Financial Corporation
Actual
—
Estimate
1.04
USD
Tomorrow
DSSDSS, Inc.
Actual
—
Estimate
—
Tomorrow
AINAlbany International Corporation
Actual
—
Estimate
0.82
USD
Tomorrow
SMPStandard Motor Products, Inc.
Actual
—
Estimate
1.14
USD
Tomorrow
LODEComstock Inc.
Actual
—
Estimate
−0.14
USD
Tomorrow
KVUEKenvue Inc.
Actual
—
Estimate
0.26
USD
See more events
Community trends
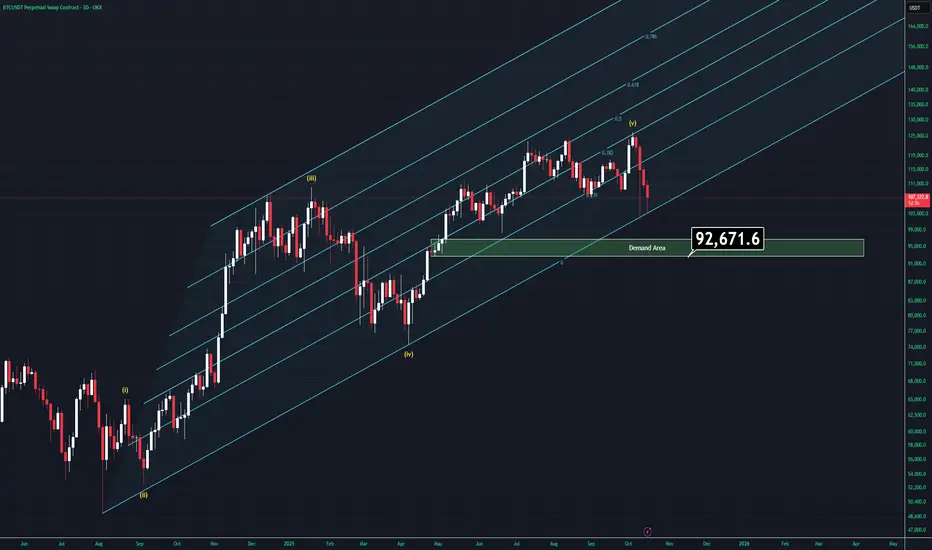
Bitcoin - Symmetrical triangle's target is 92,000 USD! Must seeBitcoin is forming a symmetrical triangle pattern, which in classic forex is a 50/50 bullish/bearish pattern. But here we do predictions, so I predict this pattern to break down! In this analysis, I will explain the reasons behind my prediction.
On Friday, October 10, we had the biggest crash in cr

BTC - Liquidity Dynamics leading to new HighsMarket Context
Bitcoin has shown a constructive reaction from the recent lows, printing a clean double bottom structure that suggests short-term demand entering the market. After a previous buy-side liquidity sweep and rejection, price has rebalanced and is now challenging a fair value gap (FVG) th

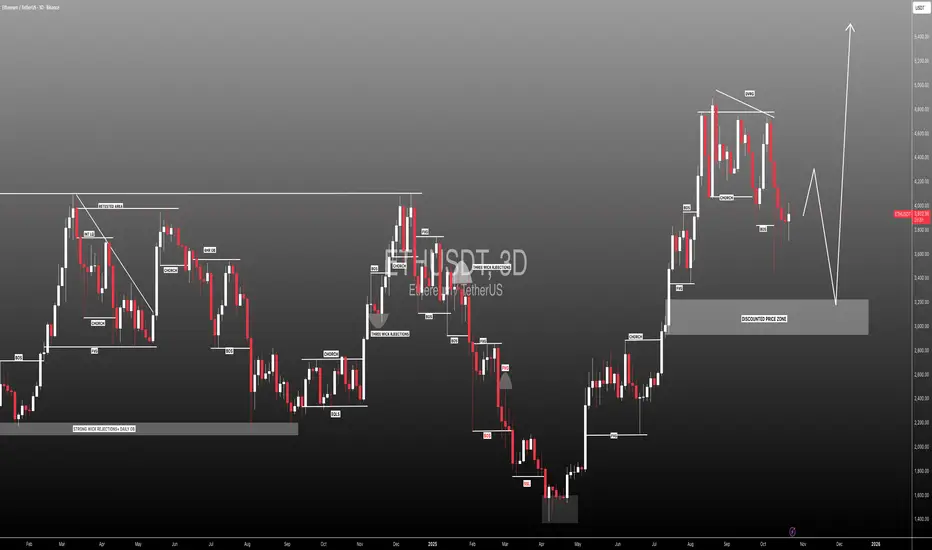
#ETHUSDT: First Drop And Then Launch To $5500! ETHUSDT we believe the price will initially decline before launching from the $3000 price region. This area appears more promising and could function as a discounted price zone. Three target levels are suggested below:
* **First target:** $4000. This area presents a minor resistance level, and clos
Ethereum - The realistic $15,000 target!🔥Ethereum ( CRYPTO:ETHUSD ) can still break out:
🔎Analysis summary:
Over the past four years, Ethereum has been trading in a massive bullish triangle pattern. And despite the recent all time high rejection, Ethereum can still follow its underlying bullrun. It just has to create the bullish tr

ETHUSD trend prediction stage 3Anybody looking at the chart of ETHUSD, what do you think about the future trend of it?
I have been studying the charts price movement for years.
the status of ETHUSD is on the 3 downwards stage. But the sign of "3" is like sidewalk from the bottom. Anybody want to share your comment about that p

Ethereum (ETH/USD) on the 2-hour timeframe (Coinbase).Ethereum (ETH/USD) on the 2-hour timeframe (Coinbase).
My drawn two downward projection arrows labeled Target Point, showing possible downside continuation.
Here’s what the chart structure indicates:
Price is around $3,975–$4,000.
The structure shows a rising wedge breakdown, typically bearish.
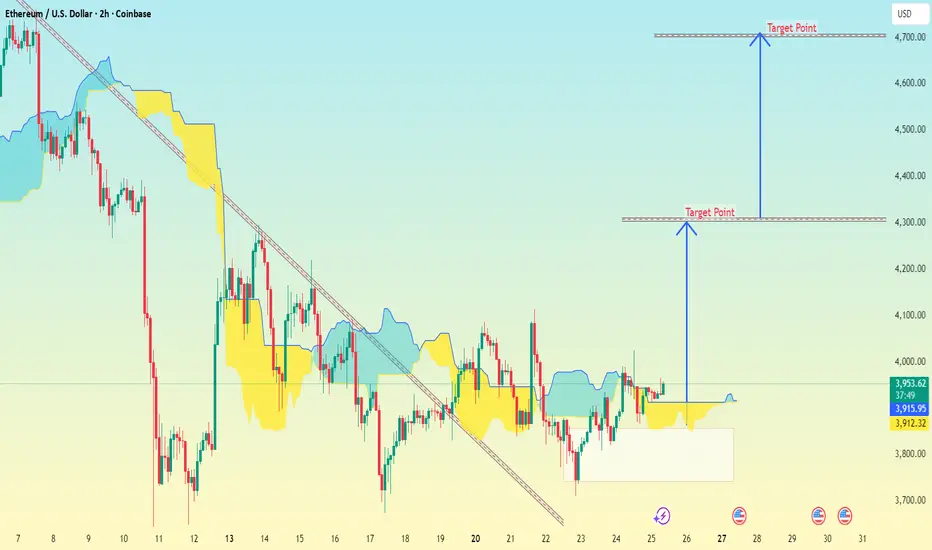
ETHEREUM (ETH/USD): Support holds-Is the Rally Just Beginning?!There is a strong likelihood that 📈ETHEREUM will continue its bullish movement from an important daily horizontal support level.
As a confirmation of this outlook, I observe a confirmed bullish Change of Character (CHoCH) and a breakout from the resistance line of a falling wedge pattern.
I antici

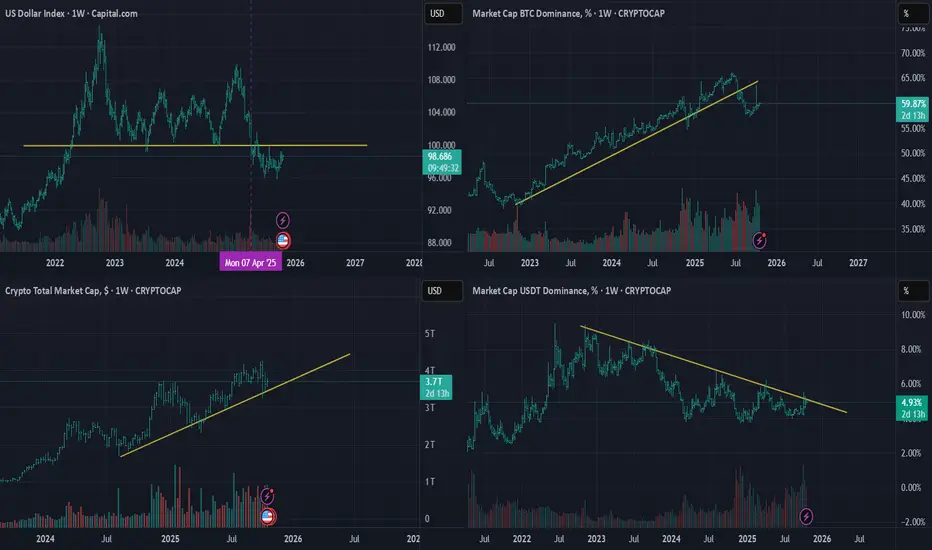
USD Index, BTC Domination, Crypto Total Market USDT Domination Hi everyone,
I just noticed a rare and exciting opportunity — the global market indexes are currently in sync in favor of altcoins.
All the charts are lining up perfectly, and to me, this looks like one of the best times to enter the market or add to your existing positions.
Wishing you all the bes
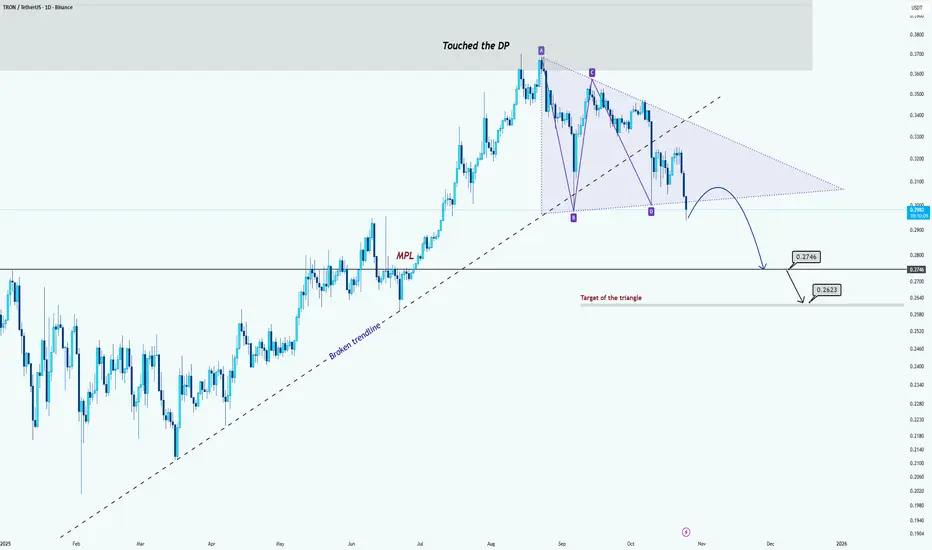
TRON Consolidating Before Potential Drop Toward 0.27–0.26 ZoneHi guys!
TRON touched the Decision Point (DP) and has been consolidating inside a descending triangle pattern. After the triangle’s support line was tested several times, the price broke below the broken ascending trendline, confirming weakness in bullish momentum.
Currently, the market seems to b
Latest BTCUSDT Update Today👋Hello everyone, what are your thoughts on BINANCE:BTCUSDT today?
After several days of volatility, Bitcoin (BTC) has reclaimed the $110,000 level, marking a notable rebound after being rejected from a key resistance area earlier this week.
Previously, BTC dropped to as low as $106,000, but qu

See all crypto ideas
Wall Street Weekly Outlook - Week 44 2025 [27.10.- 31.10.2025]Wall Street Weekly Outlook – Week 44, 2025 📊💥
Let’s dive into another exciting trading week! 🚀
Rate decisions, month-end flows, and fresh quarterly earnings are setting the stage for strong market moves.
Sit back, enjoy the overview, and dive into the world of banks, hedge funds, and institution

GOLD → Retest 4060 within the range. What are the expectations?FX:XAUUSD is forming a correction from the Asian session, with the price testing the important 4060 zone ahead of two key events: US inflation data (CPI) and the results of US-China trade negotiations.
Key factors: US inflation (CPI): Low data will support gold (expectations of two cuts in 202

XAUUSD next week (October 27, 2025 - October 31, 2025)After yesterday's CPI news on 24/10/2025, we saw interest rates unfavorable for the USD. This makes gold continue its upward trend in the coming time. Targets are 4380-4475 respectively.

XAUUSD: Healthy Pullback or the Start of a Downtrend?👋Hello everyone! What do you think about the current trend of OANDA:XAUUSD ?
Looking at last week’s movement, gold experienced a pullback after nine consecutive weeks of gains. By the end of Friday’s session, price action remained relatively calm, consolidating around the $4115 area while mainta

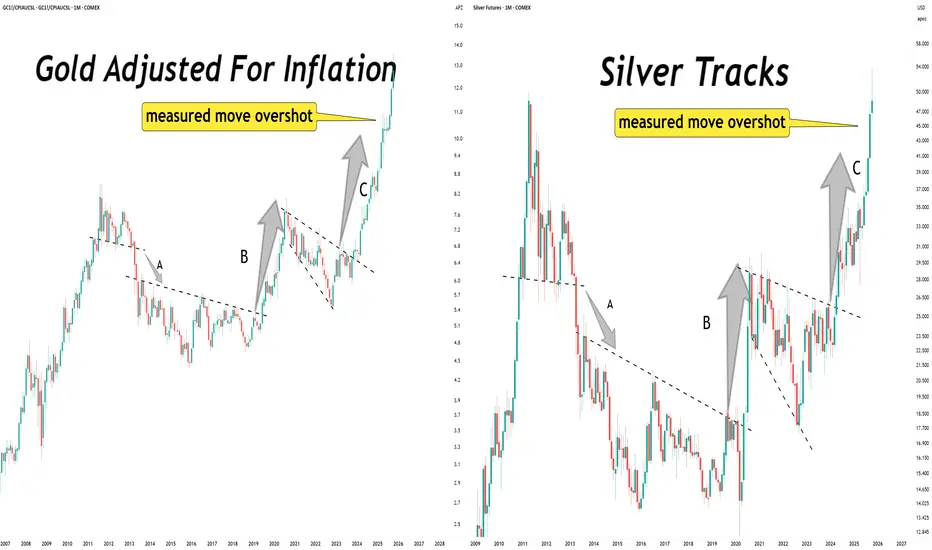
Launch patterns have exceeded their measure move targets.Gold. Silver.
Launch patterns have exceeded their measure move targets.
What comes next?
I would expect more launch patterns to morph into existence. Those are the building blocks of a long term uptrend.
gold next week still downtrend target $3950🧭 Current Market Context (XAUUSD around 4111):
Price is below EMA 9 and failed to break above 4200–4250.
The structure shows lower highs → bearish continuation still dominant.
Momentum is weak, and buying pressure hasn’t confirmed reversal yet.
📉 Primary Plan (Bearish Bias – More Likely)
Entry: Wa

XAU/USD | Gold’s Historic Dump – Will $4,000 Hold or Break?By analyzing the Gold chart on the 2-hour timeframe , we can see that gold experienced an extremely sharp sell-off — the biggest single-day drop in over 12 years — falling nearly $400 in less than 24 hours!
After dropping from $4,381 to $4,003 , price rebounded to $4,162, but then corrected a

Gold Eyes 4,010 Support Ahead of CPI – Big Move Loading?Hey Traders,
In tomorrow’s trading session, we’re monitoring XAUUSD for a potential buying opportunity around the 4,010 zone. Gold remains in a broader uptrend and is currently in a correction phase, approaching a key support and resistance confluence around 4,010 that aligns with the ascending tre

Silver’s Bull Run Isn’t Over Yet – Here’s Why!Hey traders, today is a great time to revisit the Silver vs. Gold debate .
Fundamentally, Silver ( OANDA:XAGUSD ) is currently hitting some pretty impressive levels. In fact, we’ve just seen Silver break above its All-Time High(ATH), surpassing $50, driven by strong industrial demand and globa

Trade Idea – XAUUSD GO LONGOverview:
From the daily timeframe, we can see that the 4100 level remains intact, showing that buyers are still defending this zone. Price recently tapped into the H4 Fibonacci level at 4098, which acted as a strong support and triggered a bullish push. On the M15 timeframe, the bearish trendline h

See all futures ideas
USDJPY weekly outlook week 43 day 25This asset ( OANDA:USDJPY ) was supplied on 9th October at 153. The last week of October, I want to see the asset do one of three things:
move price higher above 153 and support my bullish bias
move lower and become bearish at close the market gap identified in the analysis
hold the price at 1

EURGBP SWING ENYTRY MODELMONTHLY respect bullish candle
weekly,daily ORDERFLOW
H1,entry upon price reaction on Orderblock

AUDUSD Eyes 0.6500 as Softer CPI and Weak Jobs Data Weigh on USDHey Traders,
In the coming week, we’re monitoring AUDUSD for a potential buying opportunity around the 0.65000 zone. The pair remains in a broader uptrend, with the current pullback shaping up as a healthy correction toward key structural support.
Structure:
Price continues to respect its ascendin

AUDNZD Ever since price reached the weekly resistance area of 1.14400, it’s been bearish. I believe the next touch of the trend line will result in price continuing downwards to the support area of 1.11400.

EURUSD – Trapped in a Falling Channel👋 Hello everyone , great to see you again in today’s market discussion!
At the moment, FX:EURUSD is trading around 1.1620, continuing to follow its short-term bearish trend within a well-defined descending channel. After a brief rebound to retest the upper resistance zone near 1.1700, the pair fa

#EURAUD:2200+ Pips Major Swing Buy In Making | Swing Trading |EURAUD is currently in distribution phase. Given recent price behaviour, a significant selling volume is forming and the price could reach our target area by the end of the month or the end of the next week. Three targets have been identified and can be set according to your own plans and risk manag

USD/JPY SELLERS WILL DOMINATE THE MARKET|SHORT
Hello, Friends!
USD/JPY pair is in the uptrend because previous week’s candle is green, while the price is clearly rising on the 8H timeframe. And after the retest of the resistance line above I believe we will see a move down towards the target below at 151.123 because the pair overbought due t

LongDaily stochastic has cross back over to bullish from underbought. 7 year trend line (blue) will probably get swept into the FVG that was created at start of downtrend in 2021. (Purple box). R2 pivot sits inside of the FVG and R2 pivot plus 127 extension lines up perfect.
Going to long until TP and t

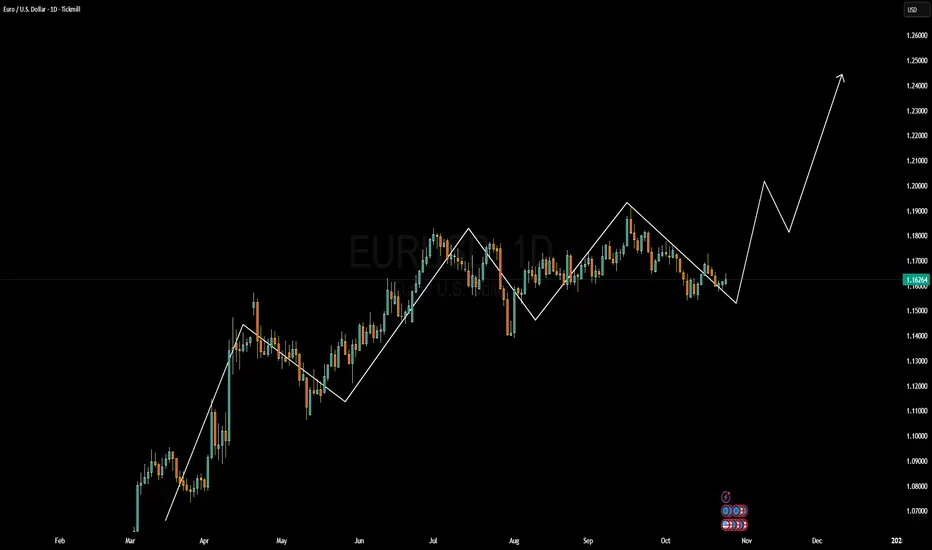
EURUSD Forming Bullish ReversalEURUSD is currently showing signs of potential bullish reversal on the daily timeframe after a prolonged consolidation phase. The pair has been fluctuating within a corrective structure for the past few months, maintaining higher lows around the 1.1500–1.1600 zone, which acts as a key demand area. T
EUR-CHF Free Signal! Sell!
Hello,Traders!
EURCHF SMC based signal. Price tapped into a key supply zone, showing clear rejection with wicks and momentum shift to the downside. Expecting a short-term retracement toward the target zone below.
-------------------
Stop Loss: 0.9259
Take Profit: 0.9243
Entry: 0.9252
Time Frame:

See all forex ideas
| - | - | - | - | - | - | - | ||
| - | - | - | - | - | - | - | ||
| - | - | - | - | - | - | - | ||
| - | - | - | - | - | - | - | ||
| - | - | - | - | - | - | - | ||
| - | - | - | - | - | - | - | ||
| - | - | - | - | - | - | - | ||
| - | - | - | - | - | - | - |
Trade directly on the supercharts through our supported, fully-verified and user-reviewed brokers.


