Nvidia: Acceleration Toward New Highs Nvidia gained strong upward momentum shortly after our last update, surging past the $196.45 mark, which had previously served as resistance. As a result, our prior short-term alternative scenario was triggered, and we have now adjusted the chart accordingly (with minor modifications). We now view t

The best trades require research, then commitment.
Get started for free$0 forever, no credit card needed

Scott "Kidd" PoteetThe unlikely astronaut

Where the world does markets
Join 100 million traders and investors taking the future into their own hands.

BITCOIN – LEVELS TO WATCHTraders,
We dumped. Now we are in a controlled recovery. The question is not only “are we going up” but “where will the market make its real decision.” Right now the chart is giving us two very clean checkpoints.
1. What happened
We lost the weekly open and sold off.
Spot was selling too, so

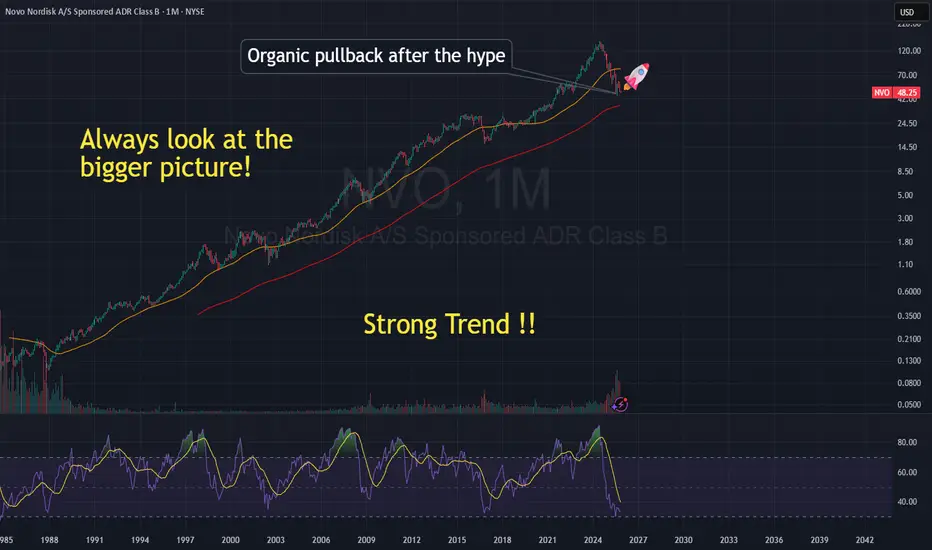
$NVO Last opportunity!🌱 Novo Nordisk: A Healthy Pullback in a Long-Term Growth Story
After years of remarkable growth, Novo Nordisk (NYSE: NVO) has seen its stock cool off — sliding from over 💲130 to around 💲49. At first glance, that might look alarming, but the reality is far more balanced. What we’re seeing is an or
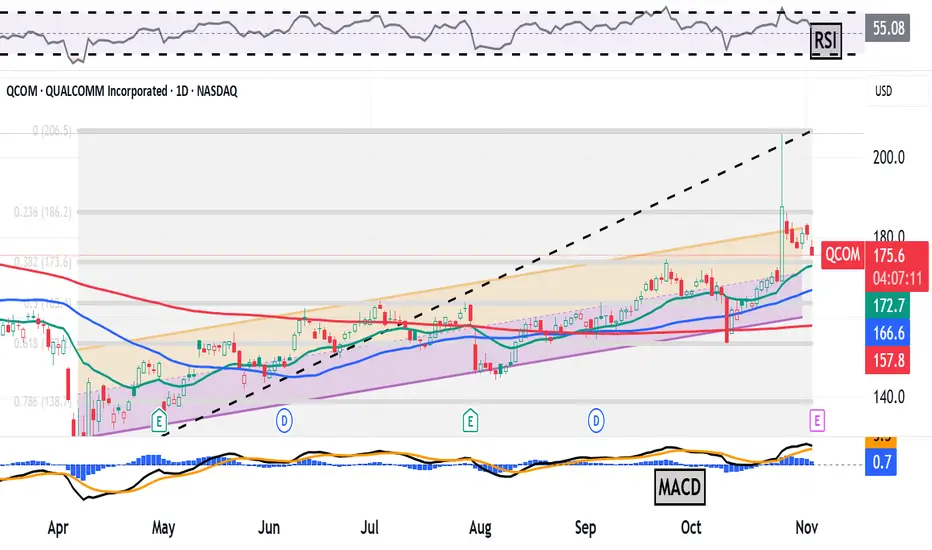
Qualcomm Rose 11% in One Day on AI Plans. What Its Chart SaysSemiconductor designer Qualcomm NASDAQ:QCOM , which is known for providing products to the consumer-electronics industry, rose more than 11% to a 15-month high in a single day last week when it announced a pivot into the world of artificial intelligence. Let's see what QCOM's chart and fundamental
Peak Tech Earnings Wrapped Up: Here Are the Winners and LosersWe're past that time when we all get glued to the dual-monitor setup and watch the titans of tech parade their financials.
Last week was the Super Bowl of earnings season, with Meta NASDAQ:META , Microsoft NASDAQ:MSFT , Alphabet NASDAQ:GOOGL , Apple NASDAQ:AAPL , and Amazon NASDAQ:AMZN all re

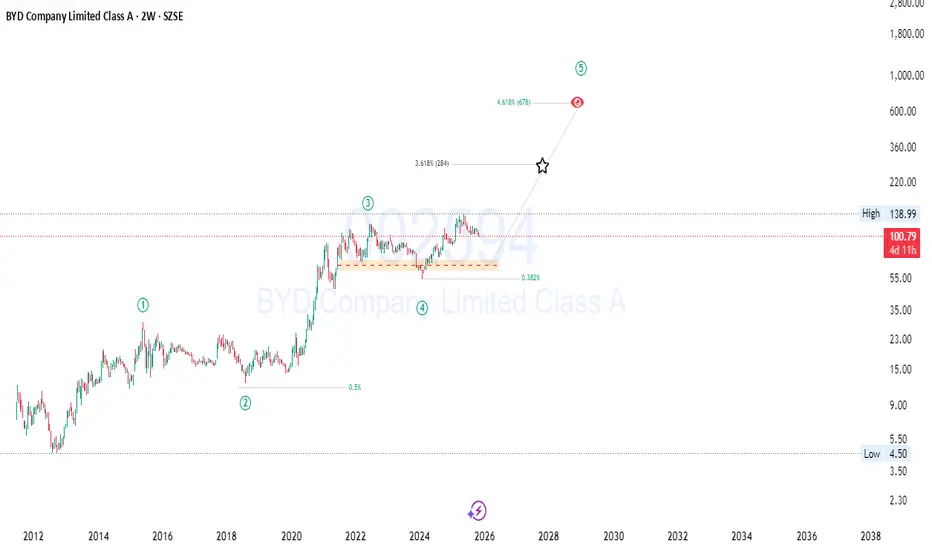
BYD : Smart Money Loading Before a Massive Wave 5 Breakout🚀 BYD Company Limited Class A (SZSE: 002594) — Wave 5 Expansion Setup
Big structure, clean levels, and solid fundamentals… Wave 5 might surprise a lot of people 👇
BYD has been quietly building strength, and the chart now suggests that the next major bullish wave could be setting up. After a
Busy trading week coming up!!The trading week of November 3–7 is considered a pivotal period for international financial markets. A series of high-level economic data including manufacturing and services PMIs, ADP non-farm payrolls, trade balances, and interest rate decisions from major central banks will create a mixed picture

EUR/AUD downside pressure intensifiesEUR/AUD finds itself just above a key zone consisting of horizontal support at 1.7600 and the key 200-day moving average, providing decent two-way trade setups depending on how the near-term price action evolves.
Should we see a break and close beneath both levels, it would allow for shorts to be e

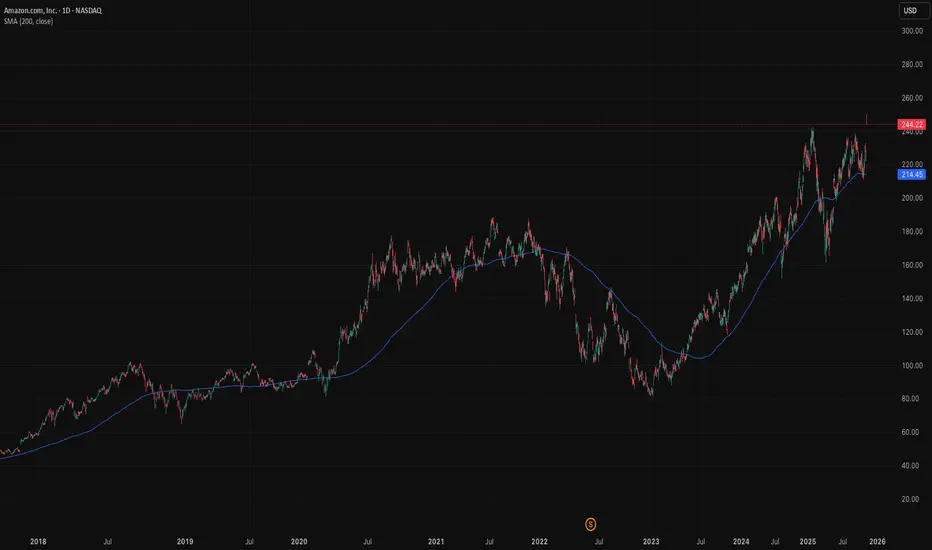
Bullish on Amazon as the tide turns backAmazon’s recent job cuts aren’t a sign of weakness, they’re a strategic recalibration. The company is shifting from broad expansion to focused execution. In the AI era, scale isn’t just about size, it’s about precision.
Amazon has trimmed roles across Alexa, devices, and some corporate functions. T
EUR/USD Under PressureEUR/USD Under Pressure
Today, the EUR/USD pair is trading around 1.1560, close to autumn lows. From this week’s high, the pair has fallen by roughly 0.85%, reflecting bearish pressure.
The main factors driving the decline are traders’ reactions to central bank signals:
→ Hawkish Fed rhetoric: On

See all editors' picks ideas
LogNormalLibrary "LogNormal"
A collection of functions used to model skewed distributions as log-normal.
Prices are commonly modeled using log-normal distributions (ie. Black-Scholes) because they exhibit multiplicative changes with long tails; skewed exponential growth and high variance. This approach i

Range Oscillator (Zeiierman)█ Overview
Range Oscillator (Zeiierman) is a dynamic market oscillator designed to visualize how far the price is trading relative to its equilibrium range. Instead of relying on traditional overbought/oversold thresholds, it uses adaptive range detection and heatmap coloring to reveal where pri

Volume Surprise [LuxAlgo]The Volume Surprise tool displays the trading volume alongside the expected volume at that time, allowing users to spot unexpected trading activity on the chart easily.
The tool includes an extrapolation of the estimated volume for future periods, allowing forecasting future trading activity.
🔶 U

Smooth Theil-SenI wanted to build a Theil-Sen estimator that could run on more than one bar and produce smoother output than the standard implementation. Theil-Sen regression is a non-parametric method that calculates the median slope between all pairs of points in your dataset, which makes it extremely robust to o

Fair Value Gaps by DGTFair Value Gaps
A refined, multi-timeframe Fair Value Gap (FVG) detection tool that brings institutional imbalance zones to life directly on your chart.
Designed for precision, it visualizes how price delivers into inefficiencies across chart, higher, and lower (intrabar) timeframes — offering a fl

TASC 2025.11 The Points and Line Chart█ OVERVIEW
This script implements the Points and Line Chart described by Mohamed Ashraf Mahfouz and Mohamed Meregy in the November 2025 edition of the TASC Traders' Tips , "Efficient Display of Irregular Time Series”. This novel chart type interprets regular time series chart data to create an ir

Simplified Percentile ClusteringSimplified Percentile Clustering (SPC) is a clustering system for trend regime analysis.
Instead of relying on heavy iterative algorithms such as k-means, SPC takes a deterministic approach: it uses percentiles and running averages to form cluster centers directly from the data, producing smoo

Adaptive Volume Delta Map---
📊 Adaptive Volume Delta Map (AVDM)
What is Adaptive Volume Delta Map (AVDM)?
The Adaptive Volume Delta Map (AVDM) is a smart, multi-timeframe indicator that visualizes buy and sell volume imbalances directly on the chart.
It adapts automatically to the best available data resolution

Dynamic Equity Allocation Model"Cash is Trash"? Not Always. Here's Why Science Beats Guesswork.
Every retail trader knows the frustration: you draw support and resistance lines, you spot patterns, you follow market gurus on social media—and still, when the next bear market hits, your portfolio bleeds red. Meanwhile, institution

First Passage Time - Distribution AnalysisThe First Passage Time (FPT) Distribution Analysis indicator is a sophisticated probabilistic tool that answers one of the most critical questions in trading: "How long will it take for price to reach my target, and what are the odds of getting there first?"
Unlike traditional technical indicators

See all indicators and strategies
Community trends
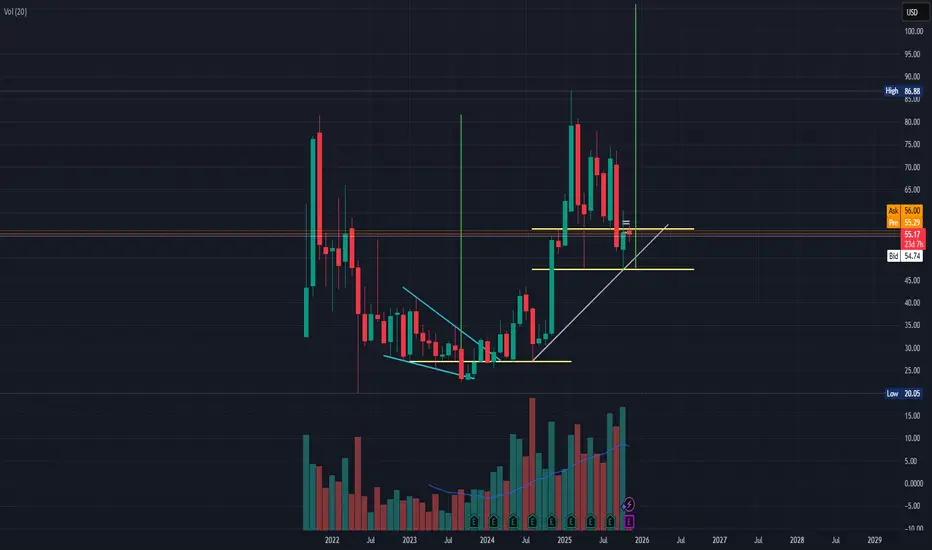
Robinhood - The third bearish crackdown!🏹Robinhood ( NASDAQ:HOOD ) will crash quite soon:
🔎Analysis summary:
Since we witnessed a major botton on Robinhood in 2023, this stock has been rallying about +1,600%. But always after a major +250% rally, Robinhood corrected at least -40%. Therefore it is quite likely that we will see anoth

Nvidia: Acceleration Toward New Highs Nvidia gained strong upward momentum shortly after our last update, surging past the $196.45 mark, which had previously served as resistance. As a result, our prior short-term alternative scenario was triggered, and we have now adjusted the chart accordingly (with minor modifications). We now view t
Duolingo - Time to BuyWe are finally long Duolingo at this drop to $210, the Wave of this move in a ascending speakerphone pattern. A strong beat and raise and yet we anticipated this large drop. If $200 is lost, I will get stopped out of this trade.
Follow my linked trade on why I shorted the top all those months ago.

$NVO Last opportunity!🌱 Novo Nordisk: A Healthy Pullback in a Long-Term Growth Story
After years of remarkable growth, Novo Nordisk (NYSE: NVO) has seen its stock cool off — sliding from over 💲130 to around 💲49. At first glance, that might look alarming, but the reality is far more balanced. What we’re seeing is an or
CoreWeave to $500?!CoreWeave has completed a strong impulse rally, followed by a prolonged consolidation inside a downward-sloping channel. Repeated rejections (red arrows) along channel resistance confirmed the structure as a bull flag. Recently, price broke above the channel with expanding volume, validating renewed

MSTR - How to profit from a $140 short target🔱 The MS ponzi is taking its toll. 🔱
I’m not laughing, because it’s genuinely unfortunate for everyone who believed in this scam.
But today, I don’t want to rant about that.
I want to show how one could profit from a potential drop of more than $100.
As an Andrews Pitchfork trader, I know there’s

Qualcomm Rose 11% in One Day on AI Plans. What Its Chart SaysSemiconductor designer Qualcomm NASDAQ:QCOM , which is known for providing products to the consumer-electronics industry, rose more than 11% to a 15-month high in a single day last week when it announced a pivot into the world of artificial intelligence. Let's see what QCOM's chart and fundamental
TSLA next leg up.RSI- is looking good for a move up because of the descending tops, once you break the resistance line you will fly.
Moving averages- My yellow and blue are good for telling longer term upside, and they are at the point of where the blue will be above the yellow.
Repetition- a lot of patterns end i

Cup & Handle - BROS (Monthly Chart)As you can see in the monthly chart of BROS, a cup and handle pattern is forming.
The price target of a cup and a handle is the depth of the cup but starting from the the handle's ending candle.
In this graph, you can see that I'm using a little conservative price target: the price target is not
20+ Stocks for November: Your Ultimate Investing Radar📅 October is wrapped up, and a new month always means a new chapter on the charts.
Monthly closes reveal which breakouts are real, not temporary spikes, but clear signs that investors are willing to pay higher prices than before.
📊 I’m looking for those moments where the market proves it has change

See all stocks ideas
Today
ESPREsperion Therapeutics, Inc.
Actual
−0.16
USD
Estimate
−0.08
USD
Today
ARHSArhaus, Inc.
Actual
0.09
USD
Estimate
0.08
USD
Today
TIGOMillicom International Cellular S.A.
Actual
1.16
USD
Estimate
0.63
USD
Today
PRMBPrimo Brands Corporation
Actual
0.41
USD
Estimate
0.37
USD
Today
CELHCelsius Holdings, Inc.
Actual
−0.27
USD
Estimate
0.27
USD
Today
DCODucommun Incorporated
Actual
0.99
USD
Estimate
0.95
USD
Today
DDDuPont de Nemours, Inc.
Actual
1.09
USD
Estimate
0.45
USD
Today
APDAir Products and Chemicals, Inc.
Actual
3.39
USD
Estimate
3.38
USD
See more events
Community trends
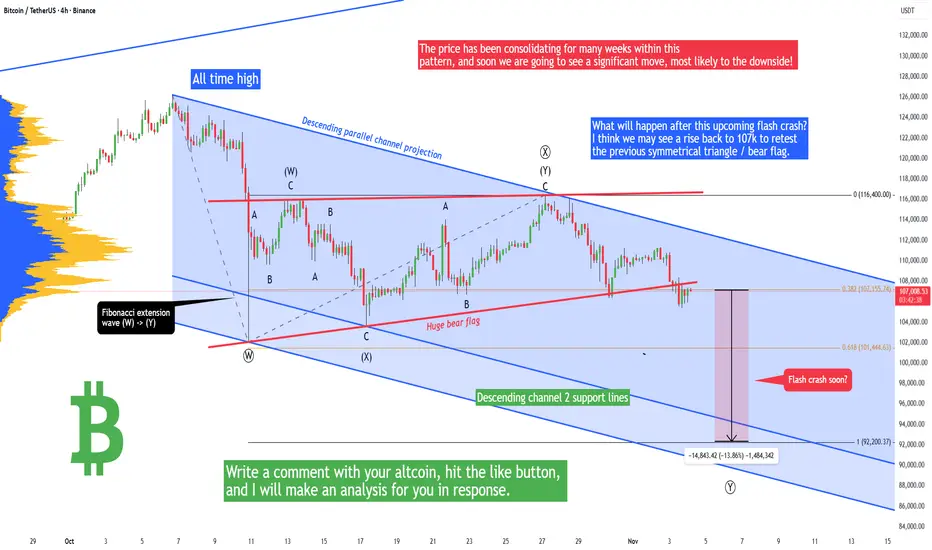
Bitcoin - Warning! Flash crash soon (BEAR FLAG)Bitcoin recently formed a symmetrical triangle, but the bulls made a false breakout above it, which is a huge problem because this symmetrical triangle pretty much transformed into a bearish flag, and that's a very bearish pattern! The price has been consolidating for many weeks within this pattern,
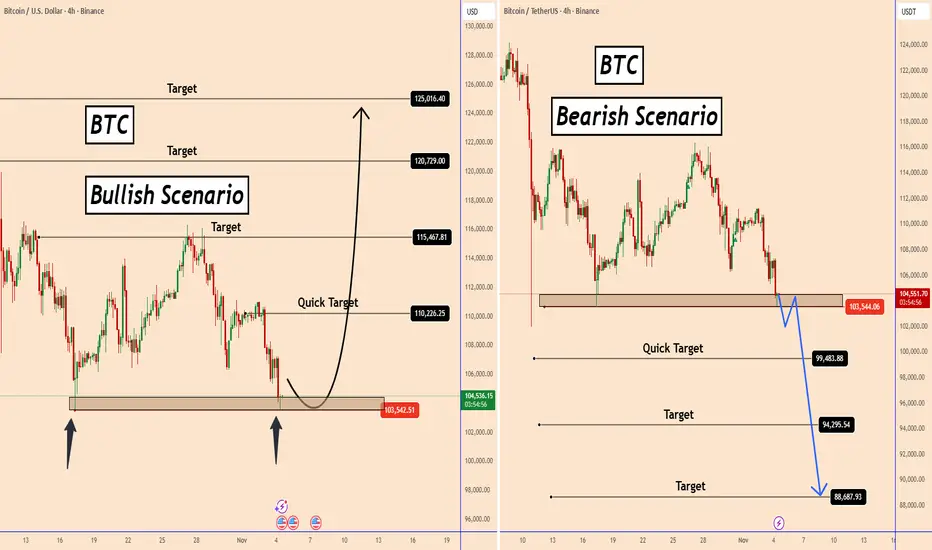
BTC: Bullish vs Bearish Scenarios - Key Levels to Watch BTC: Bullish vs Bearish Scenarios - Key Levels to Watch
Bitcoin is in a very complex development and it is not so easy to have a clear idea. At the moment, BTC is still growing as long as it stays above the current support area of 1035000.
Bitcoin is approaching a key support zone around $10
BTCUSD: Falling Wedge Reversal in Play Toward 106KHello everyone, here is my breakdown of the current Bitcoin setup.
Market Analysis
Bitcoin (BTCUSD) has recently shown signs of recovering bullish momentum after rebounding from the 100,600–101,000 Support Zone, which has acted as a key demand region during previous tests. The market experienced

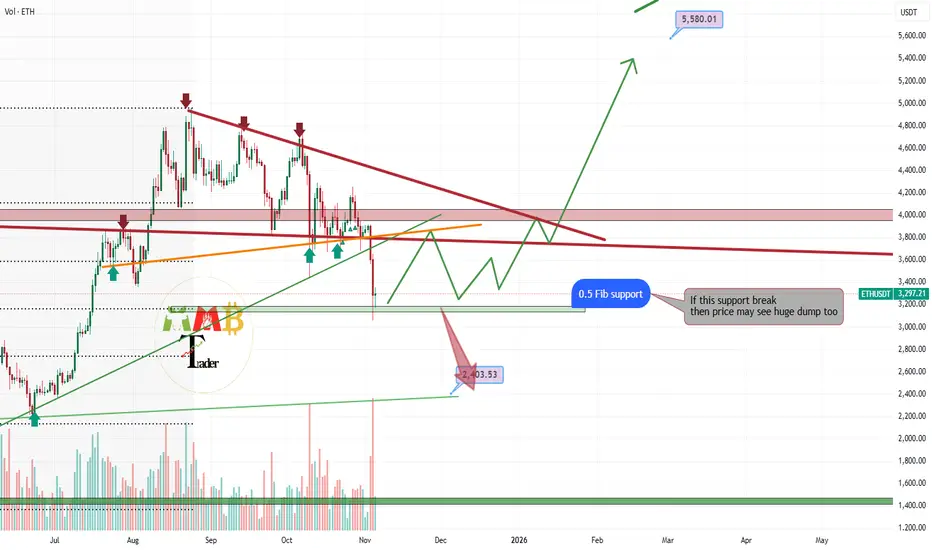
ETHUSDT is testing major Fibonacci support level now As the chart illustrates, ETHUSDT has completed a significant correction and is now testing a crucial technical level: the 50% retracement level of the Fibonacci sequence. This level often acts as a dynamic support zone in a strong trend.
A confirmed bullish rejection at this 0.5 Fibonacci support,
Bitcoin - Deathcross is coming!Bitcoin has shown a strong move over the past week, reaching the predicted downside target.
The price action is currently hovering around key technical levels that influence market sentiment on both higher and lower timeframes.
Recap of Last Week
Last week, it was noted that BTC had made a liquid

Bitcoin Drops Below 100K, Reversal Signal EmergingAfter breaking below the 107K support level, Bitcoin retested the area and then extended its decline.
As the downtrend intensified, the price broke through 102K, which was the low recorded during the large-scale liquidation event on October 11, and subsequently lost the psychological support level a
USDT Dominance at Key Resistance – Crypto Reversal Ahead?One of the key indices we can use to gauge the direction of the cryptocurrency market is USDT Dominance ( CRYPTOCAP:USDT.D ) .
In this analysis, let's look at USDT.D% on the weekly timeframe .
Currently, USDT.D% is moving in a Resistance zone(6.77%-5.25%) , Time Reversal Zone(TRZ) , and is

BTC formed a head and shoulders in consolidation!Hi!
Bitcoin recently completed a Head and Shoulders pattern, leading to a rejection from the “first hunt” area near the previous high. After that rejection, price has been moving lower and is now approaching a key S&D (Supply & Demand) zone highlighted on the chart.
This lower zone represents the

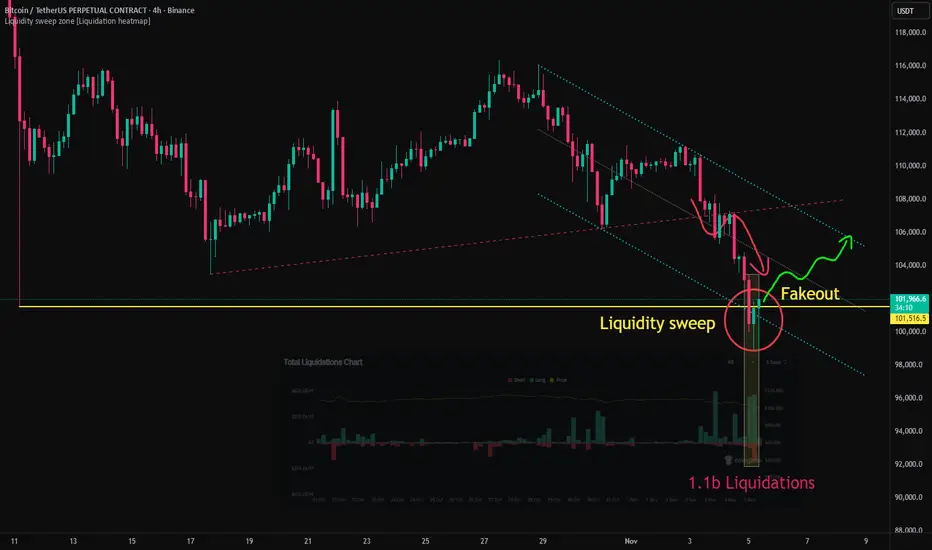
BTC/USDT | Bitcoin Drops 15% in 8 Days – Is Recovery Next?By analyzing the Bitcoin chart on the 12-hour timeframe, we can see that Bitcoin has faced a strong correction over the past few days — dropping nearly 15% from $116,400 to $98,940 in less than eight days.
After sweeping liquidity below $102,000, buying pressure returned, and BTC is now trading arou
BITCOIN – LEVELS TO WATCHTraders,
We dumped. Now we are in a controlled recovery. The question is not only “are we going up” but “where will the market make its real decision.” Right now the chart is giving us two very clean checkpoints.
1. What happened
We lost the weekly open and sold off.
Spot was selling too, so
See all crypto ideas
XAU/USD | Gold’s Sharp Breakdown – Bears Still in Control!By analyzing the Gold (XAUUSD) chart on the 2-hour timeframe, we can see that after several days of consolidation, price finally broke down sharply, hitting all our targets at $3,999, $3,985, and $3,947, and extending to $3,928 — delivering over 700 pips in profit.
After reaching the marked demand z

Gold Forms Higher Low — Potential Upside Toward Resistance LineHello traders, here’s my current outlook on Gold (XAUUSD). Gold has recently transitioned out of a strong bearish phase, where the price moved inside a descending channel and found significant support near the $3,930–$3,950 Buyer Zone. This support zone has proven to be a key reaction level multiple

Lingrid | GOLD Trend Continuation Pattern FormedOANDA:XAUUSD continues consolidating inside a broad descending channel after a failed attempt to break above 4050 resistance. Price action shows multiple rejections from the upper boundary while forming lower highs — a signal that sellers remain active. The focus now shifts toward the 3900 level as

XAUUSDHello Traders! 👋
What are your thoughts on GOLD?
Gold has entered a range-bound phase after making a new high followed by a sharp correction.
The price is currently moving sideways between key support and resistance levels, and as long as these zones remain intact, choppy and indecisive movements

A Bearish XAUUSD Setup You Can’t Afford to MissOANDA:XAUUSD has dropped sharply, reflecting the complete dominance of sellers who continue to push the market lower with strong bearish momentum.
After the decline, the price paused and then began to rise slowly, forming a familiar wedge pattern, a classic signal of trend continuation. Buyers att

Hellena | Oil (4H): LONG to resistance area 64.8.Colleagues, in fact, I have not changed the wave markup, but I have a slightly different view on the near-term price movement plan.
In the last forecast I emphasized that the target is the area of 58.9, but now it looks more likely that the completion of wave “C” in a complex correction (resistance

Bears Have Entered Gold Market – Not Just KnockingHello everyone,
Gold opened the week in a heavy, hovering state around 3,930–3,940 USD/ounce following a nearly 70 USD plunge — one of the steepest drops in the past two weeks. It was not technical factors but Fed Chairman Jerome Powell’s hawkish remarks that triggered the sell-off: the Fed made n

Gold Targets 4153 After Support ReboundGold is trading near $3,982, showing bullish momentum after rebounding from the support trend line around $3,922. The price is forming higher lows, suggesting potential upward continuation. If gold sustains above the support zone, it could target the resistance level at $4,039, with a further potent

Another Volatile Day for Gold: Is the Next Leg Down Loading?Yesterday was just another volatile session for Gold...
After testing the waters above $4,000, price reversed sharply during the New York session, dropping to around $3,930.
A brief consolidation followed, and by the time of writing, Gold already rebounded toward $3,970, reclaiming the $3,960 suppo

Gold Bull Market Update and Outlook Q4 2025 / Q1 2026📌 Executive Summary
• Base case (60%): The current pullback is a normal retracement within the primary bull trend. We expect consolidation through late Q4-2025 and potentially into January 2026, followed by a resumption of the uptrend in Q1/Q2-2026.
• Drivers remain intact: Persistent central-bank

See all futures ideas
EURCAD – Buyers Gaining ControlPrice has formed what looks like an inverse head and shoulders pattern after an extended bearish leg, a strong sign of potential reversal.
The left shoulder, head, and right shoulder structure all show selling pressure fading and buyers gradually stepping in.
We’ve now seen a clean breakout above t

URUSD Faces Pressure Near 1.15100 as DXY Holds Strong Above 100!Hey Traders,
In today’s trading session we are monitoring EURUSD for a selling opportunity around the 1.15100 zone. The pair is trading within a broader downtrend and is currently in a correction phase, approaching the trend resistance at 1.15100.
Structure:
EURUSD continues to form lower highs an

EUR/USD: Bearish Setup Confirmed After Head and Shoulders BreaksHi guys!
The chart shows a Three Drives pattern followed by a Head and Shoulders formation, both signaling potential bearish continuation.
The Three Drives Pattern:
The price completed three consecutive bullish drives, each showing signs of exhaustion. This structure often indicates a weakening up

EURUSD Long: Rebound Setup Targeting 1.1560 Pivot ResistanceHello traders! EURUSD continues to trade within a clearly defined descending channel, maintaining a consistent bearish structure characterized by lower highs and lower lows. The recent rejection from the 1.1660 Supply Zone once again confirmed strong seller presence at that level. Additionally, the

EUR/CAD: Bullish Outlook📈EURCAD formed a significant inverted head and shoulders pattern on a 4-hour timeframe.
The neckline for this pattern is identified between 1.6226 and 1.6210.
Should the price successfully break and close above this neckline, it would indicate a strong bullish signal.
In such a scenario, the mark

AUD/JPY (2-hour, FXCM) chart Pattern..AUD/JPY (2-hour, FXCM) chart, here’s what’s visible:
Pair: AUD/JPY
Timeframe: 2H
Current price: around 99.51 JPY
Pattern: price broke below an ascending trendline, retested the underside (around 100.00 JPY), and is moving down with bearish confirmation from the Ichimoku Cloud.
Two blue arrows p

EURUSD – The Undercurrent Pulling the Euro Even Deeper!As the USD continues to shine across global markets, the euro finds itself on the defensive. On November 5 , a wave of risk-off sentiment swept through the markets, driving investors toward safe-haven assets such as the USD and JPY, pushing EURUSD down to around 1.1473 — its lowest level in weeks

05.11.25 Morning ForecastPairs on Watch -
FX:EURAUD
FX:GBPNZD
FX:AUDJPY
A short overview of the instruments I am looking at for today, multi-timeframe analysis down to what I will be looking at for an entry. Enjoy!

GBP/USD – BoE Rate Decision Ahead |(06.11.2025)🧠 Setup Overview:
GBP/USD is trading inside a descending channel, with price recently rebounding from a strong support zone near 1.3000.
Ahead of the Bank of England (BoE) interest rate decision, the pair is positioned for a possible bullish breakout if the BoE maintains rates and highlights inflat

EURGBP: Strong Technical Breakout, Political Risks Weigh on GBPEURGBP: Strong Technical Breakout, Political Risks Weigh on GBP
Recently, EURGBP found the strength to break a strong resistance area near 0.8740.
We can see that EURGBP also completed a large daily triangle pattern, indicating a large accumulation.
I think that after a short pause, EURGBP could

See all forex ideas
| - | - | - | - | - | - | - | ||
| - | - | - | - | - | - | - | ||
| - | - | - | - | - | - | - | ||
| - | - | - | - | - | - | - | ||
| - | - | - | - | - | - | - | ||
| - | - | - | - | - | - | - | ||
| - | - | - | - | - | - | - | ||
| - | - | - | - | - | - | - |
Trade directly on the supercharts through our supported, fully-verified and user-reviewed brokers.


