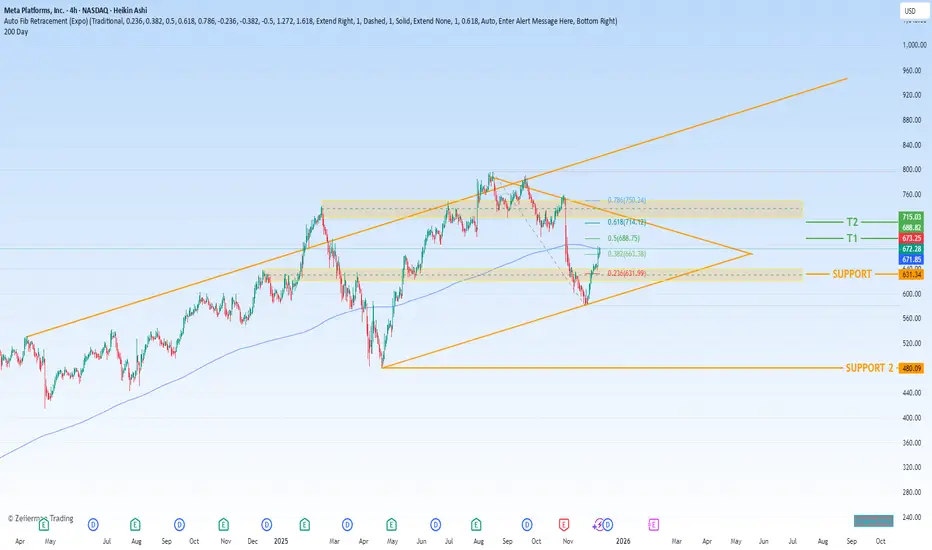
Navigating Volatility Amid Unprecedented Scale and Future InvestNASDAQ:META Meta Platforms, Inc. (META) presents a compelling bullish case rooted in its unparalleled execution within the digital advertising core business, juxtaposed against significant strategic investments in future technologies—investments that, while costly, are funded by immense cash flows
Your 2025 space mission is here
Suit up and get ready to explore every highlight of your trading galaxy.

GC(XAU/USD) technical analysis and directional opinion*In this analysis I will not include macroecnomic analysis as we all know broad financial market is waiting for BoJ to create clear directional bias upcoming end of this week on Friday. However I will make a seperate post regarding "How to decode BoJ decision" on the day before the Japanese rate dec

Nasdaq-100: Lower Low and Lower High?The Nasdaq-100 made a lower low, and now it might have made a lower high.
The first pattern on today’s chart is the November 21 low of 23,854, some 353 points below the October trough. That broke a series of higher lows since April.
Second, the tech-heavy index peaked at 25,835 on December 10. Tha

Lingrid | GOLD Sideways Movement Ahead of FOMC DecisionOANDA:XAUUSD perfectly played out my previous trading idea . Price is holding inside a well-defined consolidation after its prior surge, with price rotating above the rising channel base. The trend remains constructive, but momentum has cooled, suggesting participants are waiting for a catalyst ra

BOJ to Stress Test Global Markets? Why a Black Swan Is PossibleWhile US markets are busy debating AI valuations and parsing the Fed’s latest rate cut , something far more understated — and potentially more disruptive — is brewing across the Pacific.
The Bank of Japan is expected to raise interest rates on Friday, marking what could be its first hike in 11 mon

GOOG: Is a 10% Surge Imminent? The Setup for $340 Explained🚀 NASDAQ:GOOG : Is a 10% Surge Imminent? The Setup for $340 Explained
In the noisy world of trading, clarity is power.
Today, we are looking at Alphabet Inc. (GOOGL). We are not predicting the future, we are simply preparing for a high-probability outcome.
We have identified a textbook Bull Fla

DOGE pulls back before major decline DOGECOIN is in a range formed against the backdrop of a downtrend. The market is under pressure from above at 0.155 - 0.153 - 0.150. The structure is bearish. The rebound from 0.134 is directed towards 0.1415. A false breakout could trigger a decline.
There is no volume from the bulls, and the mark

BTC Corrections Don’t Kill Bull Market. They Power Them1. Primary Trend Structure
Macro trend: Clearly bullish. Price has respected a rising diagonal trendline since the 2022–2023 cycle low. Market structure shows higher highs and higher lows, confirming an intact uptrend.
This is a classic bull market staircase: impulsive advances (green boxes) follo

2025 BITCOIN TARGETS: Reality Check
Forecasting is easy. Being right is hard.
1. When Targets Turn Into Illusions
Look at this chart.
Bitcoin at $90,000. Sixteen days left in 2025.
And every “expert” target — JPMorgan, VanEck, Standard Chartered, Tom Lee, Kiyosaki, BlackRock, Cathie Wood —
all of them missed. Every single one.

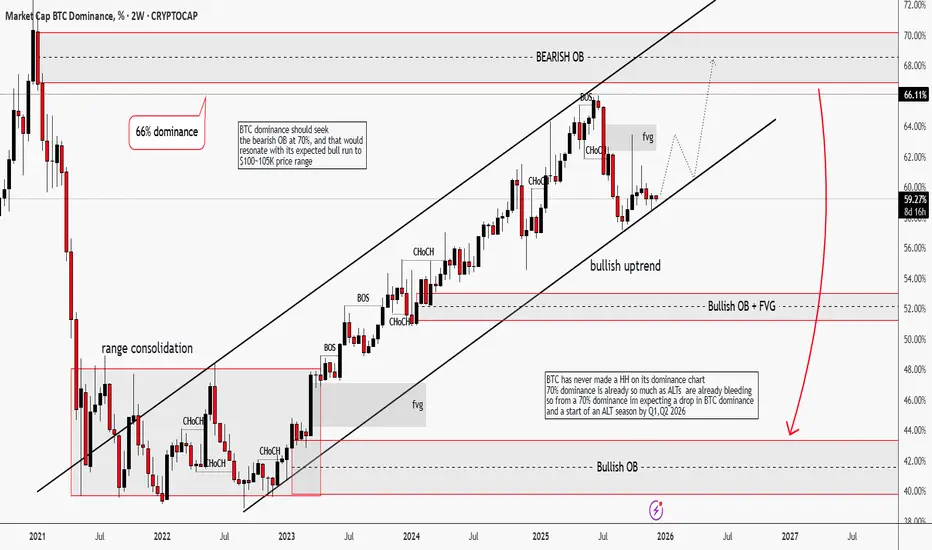
BTC Dominance | Winter is "Almost" ComingHello traders,
Its been a minute since I last checked my wallet, cause I don't love seeing red. Who loves to?
BTC dominance on the 2W timeframe has been in an impulsive bullish uptrend. Structure-wise, it has printed multiple BOS + CHoCH, which tells me that capital are still rotating into Bitcoin
See all editors' picks ideas
Multi-Ticker Anchored CandlesMulti-Ticker Anchored Candles (MTAC) is a simple tool for overlaying up to 3 tickers onto the same chart. This is achieved by interpreting each symbol's OHLC data as percentages, then plotting their candle points relative to the main chart's open. This allows for a simple comparison of tickers to tr

Vdubus Divergence Wave Pattern Generator V1The Vdubus Divergence Wave Theory
10 years in the making & now finally thanks to AI I have attempted to put my Trading strategy & logic into a visual representation of how I analyse and project market using Core price action & MacD. Enjoy :)
A Proprietary Structural & Momentum Confluence System

Per Bak Self-Organized CriticalityTL;DR: This indicator measures market fragility. It measures the system's vulnerability to cascade failures and phase transitions. I've added four independent stress vectors: tail risk, volatility regime, credit stress, and positioning extremes. This allows us to quantify how susceptible markets are

Volatility Risk PremiumTHE INSURANCE PREMIUM OF THE STOCK MARKET
Every day, millions of investors face a fundamental question that has puzzled economists for decades: how much should protection against market crashes cost? The answer lies in a phenomenon called the Volatility Risk Premium, and understanding it may fundam

Volume Gaps & Imbalances (Zeiierman)█ Overview
Volume Gaps & Imbalances (Zeiierman) is an advanced market-structure and order-flow visualizer that maps where the market traded, where it did not, and how buyer-vs-seller pressure accumulated across the entire price range.
The core of the indicator is a price-by-price volume prof

Match Finder [theUltimator5]Match Finder is the dating app of indicators. It takes your current ticker and finds the most compatible match over a recent time period. The match may not be Mr. right, but it is Mr. right now. It doesn't forecast future connection, but it tells you current compatibility for today.
Jokes aside,

Trend Line Methods (TLM)Trend Line Methods (TLM)
Overview
Trend Line Methods (TLM) is a visual study designed to help traders explore trend structure using two complementary, auto-drawn trend channels. The script focuses on how price interacts with rising or falling boundaries over time. It does not generate trade sign

Breakouts & Pullbacks [Trendoscope®]🎲 Breakouts & Pullbacks - All-Time High Breakout Analyzer
Probability-Based Post-Breakout Behavior Statistics | Real-Time Pullback & Runup Tracker
A professional-grade Pine Script v6 indicator designed specifically for analyzing the historical and real-time behavior of price after strong All-Ti

Count█ OVERVIEW
A library of functions for counting the number of times (frequency) that elements occur in an array or matrix.
█ USAGE
Import the Count library.
import joebaus/count/1 as c
Create an array or matrix that is a `float`, `int`, `string`, or `bool` type to count elements from, t

Holographic Market Microstructure | AlphaNattHolographic Market Microstructure | AlphaNatt
A multidimensional, holographically-rendered framework designed to expose the invisible forces shaping every candle — liquidity voids, smart money footprints, order flow imbalances, and structural evolution — in real time.
---
📘 Overview
The Hol

See all indicators and strategies
Community trends
Tesla - The next bullrun is coming!🚗Tesla ( NASDAQ:TSLA ) is clearly breaking out:
🔎Analysis summary:
In mid 2025, Tesla perfectly retested a major confluence of support. After Tesla then created bullish confirmation, the recent strong rally was totally expected. And with the current triangle breakout, Tesla is just starting i

NVDIA ANALYSISFirst of all, my main focus in trading is Crypto but I also examine US stocks once in a time.
As I can understand from the chart in here, there is a high possibility that Nvdia is about to face a crash.
For the ones who comes to my profile for the first time, please here me out for a bit.
Technica

Good Trades for Wheel - CSPs Cash-secured puts (CSPs) pair well with Bollinger Bands and moving averages because both indicators help identify high-probability entry zones where price is statistically stretched but still within a broader trend. When price moves toward or below the lower Bollinger Band, it signals that the stock

$AAPLNASDAQ:AAPL you owe Me. Lets Get it. Big Bounce back candle is being ENGULFED by green buy candles, so 1.272, 1.414 & 1.618 are all target for this Light show.
Happy Trading, Alerts Set!

PATHNYSE:PATH recently broke a 4.5-year negatively sloping trendline. The breakout came with solid volume and price has since found support right at the former trendline. Now watching the 0.5 retracement—if it holds, higher targets could come into play quickly. .

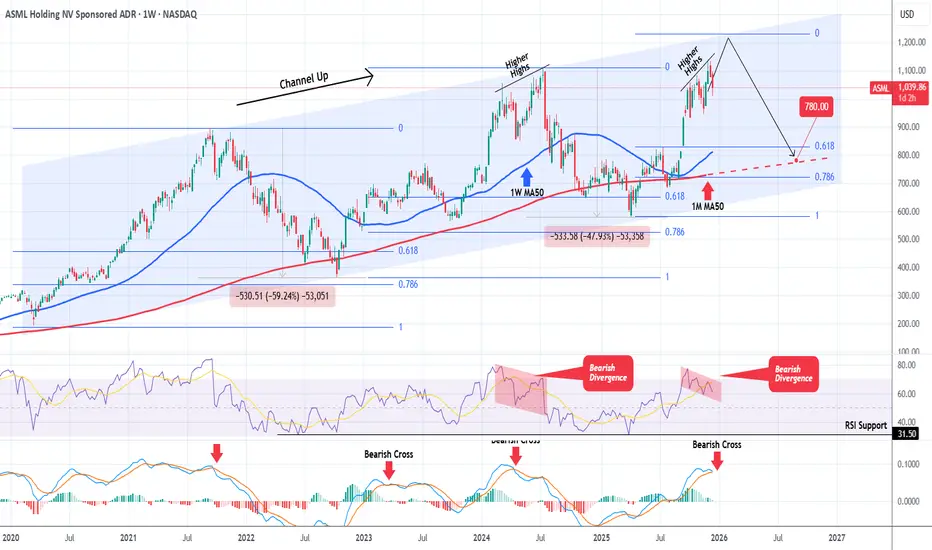
ASML is at or very close to its cyclical Top.ASML Holding (ASML) has been trading within a Channel Up since the March 2020 COVID Low and is currently approaching its Top. With the 1W RSI on a Bearish Divergence (Lower Highs against the price's Higher Highs) and the 1W MACD about to form a Bearish Cross, the stock doesn't have much room left to
ARM eyes on $117.36: Golden Genesis fib break to mark BOTTOMARM has been dropping hard for quite a while now.
Now testing underside of Golden Genesis fib at $117.36
Look for Break-n-Retest to mark the possible BOTTOM

$COIN updated fractal. Heading towards the gap!Each time before a run, NASDAQ:COIN made sure to fill the gaps. Following the fractal so far and heading towards the gap forming an IHS in my opinion. Great opportunity awaits!
Gap from ~ $213 - $230

DJT - Trump Media May PumpTrump Media just had positive news (that I'll post below) and has gapped up today (see day chart).
Notice that in popping up today it has completed a downside shakeout below 2023 support.
This downside shakeout taps high liquidity and may signal a reversal.
And its quite a deep support - this cha

$NBIS Downside Target hit!NASDAQ:NBIS — Daily
Downside target hit ✅
September gap officially filled.
Now it’s simple:
• Hold this support → potential base
• Lose it → next leg down opens toward ~$65
Watching this level closely.
#NBIS #Stocks #NASDAQ #PriceAction #GapFill #TechnicalAnalysis #Trading #MarketUpdate #Cockpi

See all stocks ideas
Today
WGOWinnebago Industries, Inc.
Actual
0.38
USD
Estimate
0.13
USD
Today
OTLKOutlook Therapeutics, Inc.
Actual
−0.06
USD
Estimate
−0.23
USD
Today
CETXCemtrex Inc.
Actual
—
Estimate
—
Today
CTXRCitius Pharmaceuticals, Inc.
Actual
—
Estimate
−0.43
USD
Today
ENGNenGene Holdings Inc.
Actual
—
Estimate
−0.57
USD
Today
BNEDBarnes & Noble Education, Inc
Actual
—
Estimate
—
Today
PMCBPharmaCyte Biotech, Inc.
Actual
—
Estimate
—
Today
NEGGNewegg Commerce, Inc.
Actual
—
Estimate
—
See more events
Community trends
Bitcoin Hits Critical Support — Is Another Dump Coming?As I expected in the previous idea , Bitcoin has broken through its support lines and declined to the support zone($86,300-$85,140), reaching its full target in the process.
Currently, Bitcoin( BINANCE:BTCUSDT ) is moving near the support zone($86,300-$85,140), and we need to watch whether it wil

BTC/USDT - Demand Holding Strong (18.12.2025)📝 Description🔹 Market Structure WHITEBIT:BTCUSDT
BTC has formed a clear Double Bottom pattern inside a strong demand / support zone, signaling potential trend exhaustion on the downside. Price respected the support zone multiple times
Momentum is attempting to shift from sellers to buyers. Thi

PEPEUSDT may turn downward after correctionThe local downtrend is breaking the support of the trading range. Consolidation below 0.003955 will be a strong signal of readiness to continue falling.
There are no bullish volumes, nor is there any buyer reaction.
The local trend has a strong structure. The movement is occurring in “steps,” whic

"ETH/USDT Forecast""ETH/USDT Forecast"
The market shows evidence of strong participation earlier, where price moved with speed and consistency, reflecting clear intent. That phase established direction and control without prolonged hesitation.
As price progressed, momentum began to ease. Movement slowed, reactions b

BTC – Weak Rebound Below EMAs, Bias Still Toward CorrectionHello everyone, Domic here.
Looking at BTC on the H4 timeframe right now, the overall feeling is not panic — but there is certainly nothing reassuring either. Price is trading around 85,700 USD, sitting firmly below both the EMA34 and EMA89, and that alone already says a lot about the current mark

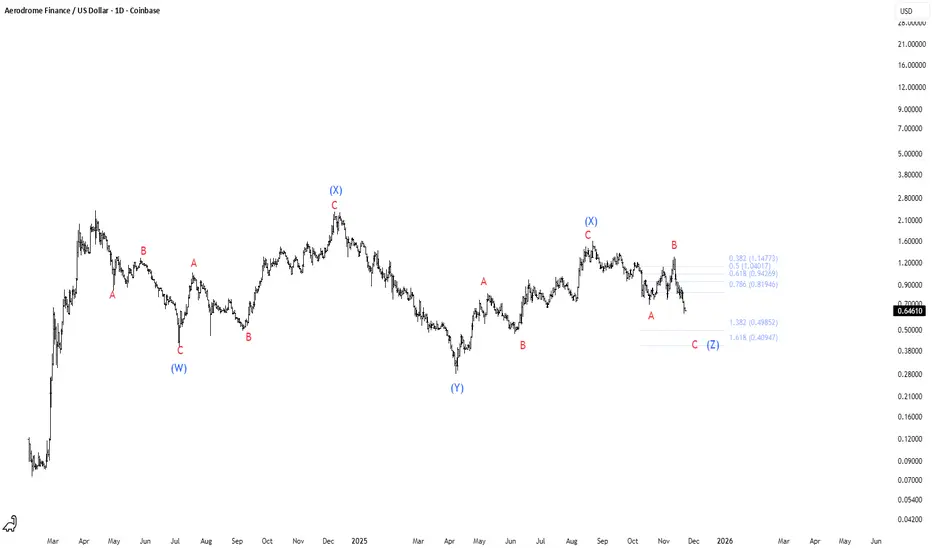
AERO = Game Over!🔻 AERODROME (AERO) – Bearish Elliott Wave Breakdown
AERO is moving exactly in line with a large W–X–Y–X–Z corrective pattern 📉, and price is now rolling over from the latest B-wave rejection. This breakdown strongly suggests the final Z-wave C-leg is unfolding, with bearish momentum strengthening a
BTCUSD Holds Triangle Support - Bounce Toward 88,500 ExpectedHello traders! Here’s my technical outlook on BTC/USD based on the current chart structure. After a prolonged bearish move inside a downward channel, Bitcoin found a base near the lower boundary and reversed sharply, signaling seller exhaustion and a shift in momentum. This reversal was followed by

ETHEREUM - Hunting for liquidity before the decline continuesBINANCE:ETHUSDT quickly returned to its decline after a short squeeze based on market manipulation and updated its low to 2805.
Looking at the daily timeframe, we can see that ETH is in a downtrend. An attempt to break the bearish trend resulted in another decline, which has been going on for

BTCUSDT Short: Range Rejection Signals Move Toward $85,800Hello traders! Here’s a clear technical breakdown of BTCUSDT based on the current chart structure. BTCUSDT is currently showing signs of increasing bearish pressure after failing to hold above the key 88,000 Supply level. Earlier, price repeatedly tested this resistance zone and produced multiple br

XRP – Daily OutlookXRP Army,
Price is still trading inside a descending channel, keeping the short-term structure bearish.
We recently saw a reaction from daily support, but this move alone is not enough to confirm a reversal.
In the past, this support level has shown clean deviations, where price dipped below and q

See all crypto ideas
Crude oil to revisit 2020 lows with drop to <$20 -80% - Dec 2025Now that we’re all driving Teslas and cyber trucks, oil can stay where it belongs, in the ground. Or something like that. Greenpeace finally makes progress.. as long as we forget about China burning colossal amounts of coal the size of mount Everest to power the machinery needed to recover minerals

XAU/USD | Gold Near Previous ATH, Next Breakout in Focus!By analyzing the #Gold chart on the 4 hour timeframe, we can see that price moved exactly as expected and continued higher. Gold successfully hit the $4351 and $4359 targets and even pushed up to $4375.
Based on the main analysis, the next key target is a new all time high above $4382. Since gold h

GOLD - A pullback ahead of the news. Will there be growth?FX:XAUUSD is hitting resistance at 4350-4360 and forming a correction amid expected inflation and initial jobless claims data
Mixed US employment data supports expectations of Fed policy easing. The market is pricing in two rate cuts in 2026 versus one in the Fed's forecasts, which supports th

NQ Range (12-18-25)The O/N has retraced 200 of the 400 points needed to get the NDX out of the Danger Zone range. NQ is at KL 25,103 & Diablo. U Turn attempt in the Overnight is underway. After the Washington Street & Meme Coin public address, they may need to try all Long side tricks to stabilize these markets. My 12

Gold (XAU/USD) Analysis: Strong Bullish Breakout Expected Soon!In this analysis, we're looking at gold on the 2-hour timeframe. Right now, gold is around $4336, and many people expect the price to get rejected (bounce down) from this level. But in my opinion, gold's momentum is much stronger than it appears, and I expect we'll soon see a powerful breakout above

THE KOG REPORT - UpdateEnd of day update from us here at KOG:
That was a mic drop moment again this week with the plan working well. We got the high, the low with the tap and bounce, the target level on the red box break and then what a RIP from that level!
Now we have support at the 4330 level with the order region

XAU/USD | CPI incoming (READ THE CAPTION)As you can see in the 4H chart of Gold, it is consolidating between the Bearish OB and the 4H FVG, mostly because it is waiting for CPI to make a move.
There's a support level at 4317 to monitor, and there's a Buyside liquidity below 4306 and another one below 4300.
Monitor these zones and make sure

XAUUSD – The UP Trend Is Still Well ProtectedThe gold market is no longer asking “will it go up or not” — the real question now is how the rally unfolds . When we combine the news backdrop with the price structure on the chart, the bullish picture of XAUUSD becomes increasingly clear.
On the fundamental side , recent U.S. economic data sh

Lingrid | GOLD Price Action Continues Range-BoundOANDA:XAUUSD remains supported above the trendline after rejecting lower prices, with recent pullbacks failing to break the higher-low sequence. Price is compressing beneath the upper resistance band, suggesting absorption rather than distribution, while the broader structure still favors continuat

XAUUSD Holds Bullish Structure - Resistance at $4,380 in FocusHello traders! Here’s my technical outlook on XAUUSD (Gold) based on the current chart structure. After a corrective phase, Gold established a solid base and transitioned into a bullish recovery, forming higher lows and respecting the rising Support Line. The price previously moved through a consoli

See all futures ideas
EURUSD Holds Demand - Retest of 1.1760 Resistance LikelyHello traders! Here’s my technical outlook on EURUSD based on the current chart structure. After a prolonged bearish phase inside a descending channel, EURUSD found a solid base near the lower boundary, where selling pressure weakened and price turned around. This reversal led to a clean breakout ab

EUR/USD - Central Bank Week in Control (18.12.2025)📝 Description🔹 Market Context (Fundamental) FX:EURUSD
This week is central-bank heavy, keeping EUR/USD sensitive to volatility and USD strength:
BoE (Thursday): High impact – rate cut expected → risk-off tone
ECB (Thursday): Low impact – policy hold expected
BoJ (Friday): High impact – rate hik

AUDCAD - From Shorts to Potential Longs!!Earlier in this range, we sold 📉AUDCAD near the upper boundary, fading resistance as price showed clear exhaustion. That idea played out well, with price rotating back into the middle and now pressing toward the lower bound of the range.
This is where things shift.
⚔️As long as range support ho

USDJPY Breaks Falling Wedge Pattern, Ready to pump!USDJPY ( FX:USDJPY ) has started to climb from its Support lines and Support zone(155.100 JPY-154.120 JPY), showing good momentum in its upward movement.
From a classical technical analysis perspective, it seems that USDJPY has successfully broken the upper lines of the falling wedge pattern on the

EURUSD Potential UpsidesHey Traders, in today's trading session we are monitoring EURUSD for a buying opportunity around 1.16800 zone, EURUSD is trading in an uptrend and currently is in a correction phase in which it is approaching the trend at 1.16800 support and resistance area.
Trade safe, Joe.

GBP/USD Short SetupThe GBP/USD 3-hour chart shows price consolidating within two converging descending trend lines. The Ichimoku cloud remains supportive, maintaining an overall bullish bias, while the current structure hints at a potential reversal. The current price is 1.33946. Two downside targets are highlighted o

CHFJPY What Next? SELL!
My dear subscribers,
My technical analysis for CHFJPY is below:
The price is coiling around a solid key level - 195.88
Bias - Bearish
Technical Indicators: Pivot Points Low anticipates a potential price reversal.
Super trend shows a clear sell, giving a perfect indicators' convergence.
Goal - 1

GBP/JPY: Bullish Move From Trend LineI observed a test of a significant trend line on 📈GBPJPY.
The price subsequently formed an inverted head and shoulders pattern, with a breakout of its neckline occurring on an intraday time frame.
I anticipate a retracement to 208.88.

USDJPY Wait For The Beak!The Bank of Japan just hiked interest rates by 25 bps to 0.75%, the highest level in ~30 years. FED lowering while BOJ raising rates is bad juju for the carry trade.
Why carry risk is rising
BOJ hikes = funding cost up. Yen is no longer “free money.”
Fed cuts = yield advantage shrinking. The w

EURUSD Expected Downward Move with Potential EQH SweepQuick summary
EURUSD is expected to fall to 1.16622 without mitigate any levels above as there is no reason for it to do so but it may sweep the EQH first and thats a very low probability
Full analysis
EURUSD is expected to continue its downward movement toward 1.16622, as most key levels have al

See all forex ideas
| - | - | - | - | - | - | - | ||
| - | - | - | - | - | - | - | ||
| - | - | - | - | - | - | - | ||
| - | - | - | - | - | - | - | ||
| - | - | - | - | - | - | - | ||
| - | - | - | - | - | - | - | ||
| - | - | - | - | - | - | - | ||
| - | - | - | - | - | - | - |
Trade directly on Supercharts through our supported, fully-verified, and user-reviewed brokers.


