RIOT: Looking for bottoming formationThe overall equity and crypto market crash didn't do any favor to RIOT stock. Despite a lot of good things happening for the company, the short-term headwinds are propelling much of the selling. The rapid selling across the markets has a strong signature of capitulation. Which means, I am now lookin

The best trades require research, then commitment.
Get started for free$0 forever, no credit card needed

Scott "Kidd" PoteetPolaris Dawn astronaut

Where the world does markets
Join 100 million traders and investors taking the future into their own hands.

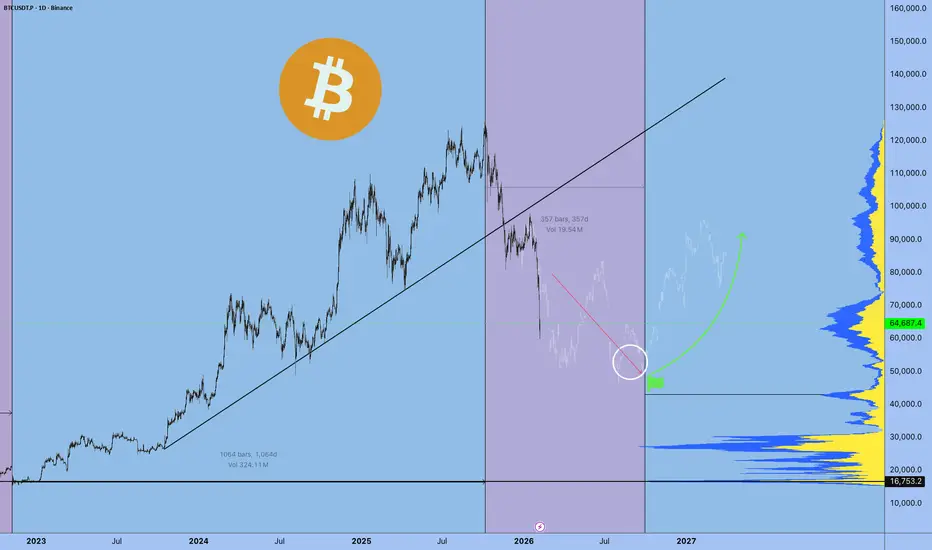
This Isn’t a Reversal — It’s Only Phase Two. $BTC>65k Thank you for your attention! This is exactly what you've been hearing since September 2025. Next, we'll form the bottom, and reaccumulate until October.
A smart person told me to stop posting publicly. Make everything private, but I continue to publish my thoughts for you.
There are no entry point
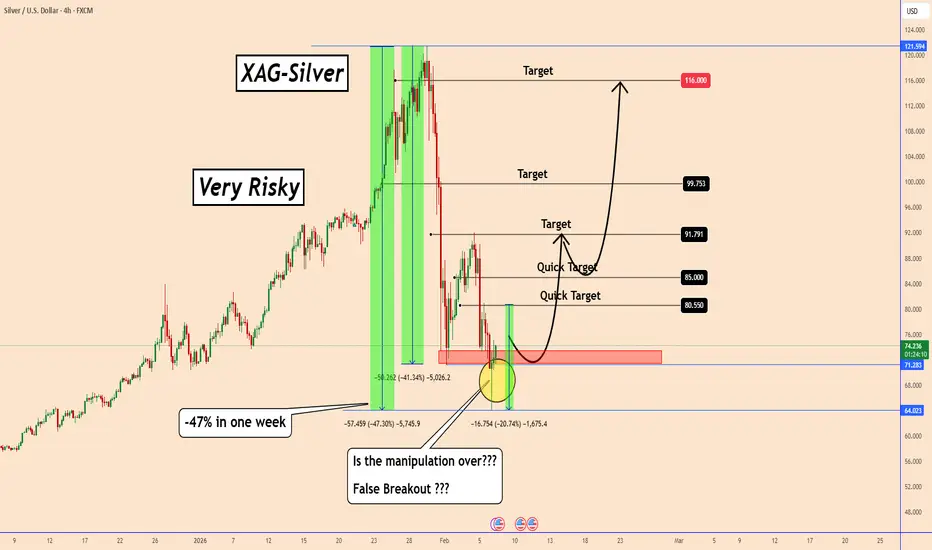
Silver: From -47% to Bullish Momentum: Silver’s Chaotic WeekSilver: From -47% to Bullish Momentum: Silver’s Chaotic Week
In the first sell-off that silver experienced, the price fell by almost -40%.
After a correction these days, we saw silver move lower overnight creating another structural low.
Just yesterday, silver fell by almost -21%, adding to the
Oracle - The worst drawdown ever!💣Oracle ( NYSE:ORCL ) will ends its bearmarket soon:
🔎Analysis summary:
Over the past five months, Oracle has been correcting more than -60%. And while we can clearly witness a major selloff, Oracle is also approaching a major support area. And if we see bullish confirmation in the near futur

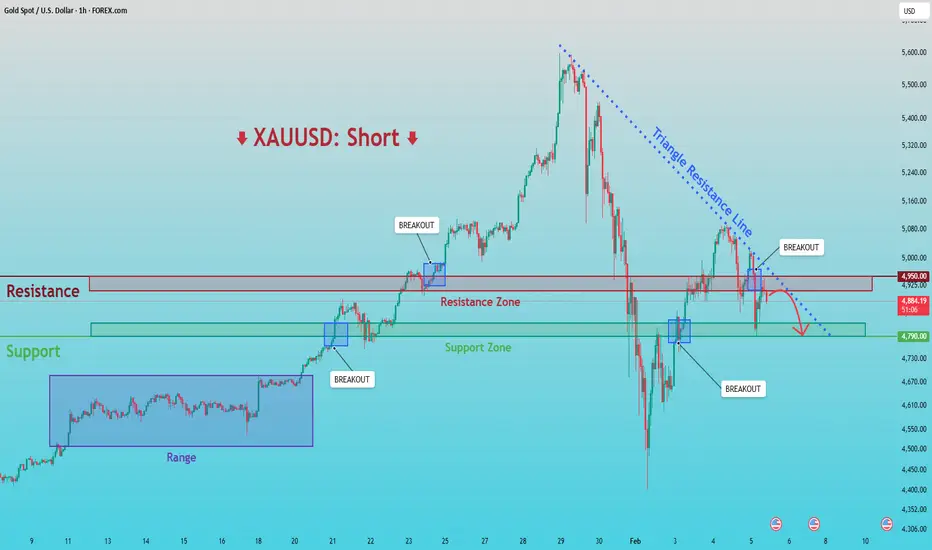
XAUUSD: Breakdown & Retest Signals Bearish ContinuationHello everyone, here is my breakdown of the current XAUUSD setup.
Market Analysis
XAUUSD previously traded within a well-defined consolidation range, where price moved sideways for an extended period, indicating balance between buyers and sellers and gradual liquidity accumulation. This range eve
FTSE100 Breakout supported at previous consolidation zoneThe FTSE remains in a bullish trend, with recent price action showing signs of a breakout within the broader uptrend.
Support Zone: 10340 – a key level from previous consolidation. Price is currently testing or approaching this level.
A bullish rebound from 9490 would confirm ongoing upside moment

MNQ Daily Analysis - Tuesday February 3 2026 part 1As a learning, beginner day trader I go through the market replay predefining what I am looking for to enter a trade and walk through my thoughts as I experience the market action bar by bar throughout the entire day to see how I handle various events and assess my execution.
This is for me and oth

BITCOIN and the powerful Stoch RSI Cycle SignalThe Stoch RSI is a very rarely used indicator, in fact the last time we made use of it on Bitcoin (BTCUSD) was around the bottom of the 2022 Bear Cycle. We bring it forward to you once more as December closed with the 1M Stoch RSI below the 20.00 level. Historically, every time the market did that,

GBPNZD - Two Magnets, Two Clear JobsGBPNZD is trading between two zones that keep acting like magnets:
On the upside, the red structure has been attracting price again and again. Every time price reaches that area, sellers show up. As long as that structure holds, that’s where I’ll be looking for shorts.📉
On the downside , the bl

Intuit and Netflix. The Danger of Broken TrendsIntuit and Netflix. The Danger of Broken Trends
Momentum is the most powerful force in physics and finance but when an object in motion suddenly stops the impact is catastrophic. We often assume trends last forever yet the moment a multi year structure fractures it triggers a violent repricing e

See all editors' picks ideas
Smart Trader, Episode 03, by Ata Sabanci, Candles and TradelinesA volume-based multi-block analysis system designed for educational purposes. This indicator helps traders understand their current market situation through aggregated block analysis, volumetric calculations, trend detection, and an AI-style narrative engine.
━━━━━━━━━━━━━━━━━━━━━━━━━━━━━━━━━━━━━━━

Asset Drift ModelThis Asset Drift Model is a statistical tool designed to detect whether an asset exhibits a systematic directional tendency in its historical returns. Unlike traditional momentum indicators that react to price movements, this indicator performs a formal hypothesis test to determine if the observed d

Hyperfork Matrix🔱 Hyperfork Matrix 🔱 A manual Andrews Pitchfork tool with action/reaction propagation lines and lattice matrix functionality. This indicator extends Dr. Alan Andrews' and Patrick Mikula's median line methodology by automating the projection of reaction and action lines at equidistant intervals, cr

Arbitrage Matrix [LuxAlgo]The Arbitrage Matrix is a follow-up to our Arbitrage Detector that compares the spreads in price and volume between all the major crypto exchanges and forex brokers for any given asset.
It provides traders with a comprehensive view of the entire marketplace, revealing hidden relationships among d

Wyckoff Schematic by Kingshuk GhoshThe "Wyckoff Schematic" is a Pine Script indicator that automatically detects and visualizes Wyckoff Method accumulation and distribution patterns in real-time. This professional tool helps traders identify smart money movements, phase transitions, and critical market structure points.
Key Features

Volume Cluster Profile [VCP] (Zeiierman)█ Overview
Volume Cluster Profile (Zeiierman) is a volume profile tool that builds cluster-enhanced volume-by-price maps for both the current market window and prior swing segments.
Instead of treating the profile as a raw histogram only, VCP detects the dominant volume peaks (clusters) insid

DeeptestDeeptest: Quantitative Backtesting Library for Pine Script
━━━━━━━━━━━━━━━━━━━━━━━━━━━━━━━━━━
█ OVERVIEW
Deeptest is a Pine Script library that provides quantitative analysis tools for strategy backtesting. It calculates over 100 statistical metrics including risk-adjusted return ratios (Sharpe

Arbitrage Detector [LuxAlgo]The Arbitrage Detector unveils hidden spreads in the crypto and forex markets. It compares the same asset on the main crypto exchanges and forex brokers and displays both prices and volumes on a dashboard, as well as the maximum spread detected on a histogram divided by four user-selected percenti

Multi-Distribution Volume Profile (Zeiierman)█ Overview
Multi-Distribution Volume Profile (Zeiierman) is a flexible, structure-first volume profile tool that lets you reshape how volume is distributed across price, from classic uniform profiles to advanced statistical curves like Gaussian, Lognormal, Student-t, and more.
Instead of forcin

Multi-Ticker Anchored CandlesMulti-Ticker Anchored Candles (MTAC) is a simple tool for overlaying up to 3 tickers onto the same chart. This is achieved by interpreting each symbol's OHLC data as percentages, then plotting their candle points relative to the main chart's open. This allows for a simple comparison of tickers to tr

See all indicators and strategies
Community trends

ADOBE [ADBE] EWP TC FIB ANALYSIS MONTHLY TFADOBE (ADBE) – Monthly Elliott Wave Count
ADBE continues to trade inside its multi-decade bullish channel and is now approaching the lower boundary near $242, which we consider our primary Wave IV buy zone. From an Elliott Wave Principle perspective, the 2021 high completed Supercycle Wave III, wi

Double bottom with a potential double‑up The price dropped sharply after the company projected a revenue decline for 2026.
A perfect double bottom has formed around $43, and now it’s just waiting for a breakout above the neckline to project a target toward $81.5.
Someone more famous than me once said: “Be greedy when others are fearful,

Bought some $JD yesterday - a few reasons why :Bought some NASDAQ:JD yesterday — thanks to a sharp member who brought it to my attention.
A few reasons why the probability vs. risk/reward looks favorable here:
• A large bear wedge — historically these resolve higher roughly 70% of the time
• The China index is forming a double bottom, which

Oracle - Buy 131 / 102 - TGT 165The Share has seen a major decline in value. more than 50% discounted.
The price expected to hit the level of 131 and even the levels of 101.
Further move towards the levels of 165 is expected from these levels.

Hate to crash the bear party, but Bitcoin is primed to explode.Bitcoin is following the same growth pattern Apple did as it established its massive uptrend. Many investors are bearish, calling for low targets like $50K or even $30K—but most don’t realize Bitcoin is likely to rally all the way to a new all-time high.
The trend is your friend, and Bitcoin is in

Anthropic Retail News False InformationAI technology is vast and will impact almost every one of the 130+ industries in the US.
The news of Anthropic threatening software companies and big tech companies, such as AMZN and GOOG, was false news.
Anthropic's new technology is specifically designed for regulated industries such as the Finan

MCD Daily Breakout | Real Move or Fake?👋 Hello and well done!
Greetings to all TradingView followers and the respected TradingView team.
This analysis is presented by Forex City Pro Team 🚀
🍔 Brief Overview of McDonald’s (MCD)
McDonald’s Corporation (MCD) is one of the world’s largest and most established brands in the fast-food industry

Is this the end of Hims & Hers? Based on the current technical and fundamental analysis of Hims & Hers Health (HIMS) following the severe regulatory and legal headwinds announced on Friday, the stock has entered a period of intense pressure and high uncertainty. The dramatic after-hours sell-off has established a new, lower tradin

SMCI- Trading range swinging!SMCI
.
Trading range swinging!
SMCI is oscillating inside a clearly defined range. Supply pressure is fading near the lows, and initial demand signals are beginning to show up.
.
US STOCKS- WALL STREET DREAM- LET'S THE MARKET SPEAK!

See all stocks ideas
Tomorrow
LLoews Corporation
Actual
—
Estimate
—
Tomorrow
CNACNA Financial Corporation
Actual
—
Estimate
1.29
USD
Tomorrow
EPCEdgewell Personal Care Company
Actual
—
Estimate
−0.16
USD
Tomorrow
WATWaters Corporation
Actual
—
Estimate
4.51
USD
Tomorrow
DTDynatrace, Inc.
Actual
—
Estimate
0.41
USD
Tomorrow
APOApollo Global Management, Inc. (New)
Actual
—
Estimate
2.04
USD
Tomorrow
BDXBecton, Dickinson and Company
Actual
—
Estimate
2.81
USD
Tomorrow
SBHSally Beauty Holdings, Inc. (Name to be changed from Sally Holdings, Inc.)
Actual
—
Estimate
0.46
USD
See more events
Community trends
Bitcoin - When History RhymesMarket Context and Historical Symmetry
Bitcoin has a tendency to move in recognizable cycles, and what stands out right now is the near-perfect similarity between the previous bull market correction and the current one. During the 2021 cycle, price retraced approximately 52% from the all-time high
BYCUSDTHello Traders! 👋
What are your thoughts on Bitcoin?
Bitcoin experienced a sharp sell-off over the past week, dropping aggressively to the $60,000 level — a decline of nearly 50% from its all-time high.
As illustrated on the chart, this move followed a clear breakdown below the ascending trendline

TradeCityPro | Bitcoin Daily Analysis #261👋 Welcome to TradeCity Pro!
Let’s move on to Bitcoin analysis. After the recent sharp drop, the market is now going through an upward corrective move.
⏳ 1-Hour Timeframe
After Bitcoin’s bearish move down to the 62,824 support, it entered a corrective phase and has so far retraced up to 71,670.
✔️

BITCOIN - From the DISTRIBUTION phase to the CONSOLIDATION phaseBINANCE:BTCUSDT.P tested 60K during the current cycle and formed a fairly significant pullback to 70K. However, it is too early to talk about a bullish trend; this is just a reaction to liquidation. The cycle continues...
At the moment, the decline is 52%, which is historically within acceptab

BTCUSD · 30M – Liquidity Sweep → Bullish RecoveryBITSTAMP:BTCUSD
BTC swept sell-side liquidity aggressively, forcing stops and triggering panic selling. After the sweep, buyers stepped in strongly, reclaiming key structure and printing a bullish break. The recovery shows acceptance above demand, suggesting a corrective bullish move toward higher

Bitcoin monthly —Support found at EMA55There are many things to consider. The market represents a natural force, a force of nature. It is a collective mind, human action. It represents one aspect of our collective mind. When we are thinking, being and feeling in a certain way, this is reflected in the market, that being neutral, bearish

BTCUSD CHoCH Signals Trend Reversal Clear structure break + CHoCH on BTCUSD (2H). Based on what you marked, here are clean upside targets:
🎯 BTCUSD Upside Targets (after CHoCH)
Target 1 (TP1):
78,000 – 79,000
Previous supply / structure resistance
First logical profit-taking zone
Target 2 (TP2):
83,500 – 84,500
Higher timef

Bitcoin Breaks Major Support — Extreme Fear or Another Leg Down?Bitcoin ( BINANCE:BTCUSDT ), as I highlighted in my previous weekly idea , started its decline. The drop came with higher momentum than expected, surprising many, and it successfully broke the heavy support zone($78,260-$64,850).
Now, here are the fundamental reasons for Bitcoin’s movement in the

BTCUSDT Lower Highs, Lower Lows - Bears in Full ControlHello traders! Here’s my technical outlook on BTCUSDT (3H) based on the current chart structure.BTCUSDT previously traded within a well-defined ascending channel, where price consistently respected both the rising support and resistance lines. This structure reflected a controlled bullish trend with

BTC Liquidity Probe and then Liquidity Harvest laterIn the above chart, I am trying to show that the selling pressure that drove price sharply to $60,000 was engineered by market makers to test the depth of liquidity and grab some liquidity in the process. The fact that after buy orders were triggered at the support zone of $60,000 but there was no

See all crypto ideas
XAU/USD ~ Gold Building Momentum from Key Support📝 Description 🔍 Setup OANDA:XAUUSD
✅Gold has been respecting a descending trendline with multiple rejections, showing clear bearish structure. Now price is attempting a breakout + retest while holding above a strong demand zone.
✅Buyers stepped in aggressively from support, forming higher lows

Elise | XAUUSD · 30M – Liquidity Grab → Bullish ContinuationOANDA:XAUUSD
Gold executed a classic liquidity grab below support, trapping weak sellers before aggressively reclaiming structure. Each dip into demand has been met with strong buying pressure, showing smart-money accumulation. The current pullback appears corrective, and as long as price holds ab

XAUUSD Short: Supply Holding, $4,750 Demand as TargetHello traders! Here’s a clear technical breakdown of XAUUSD (4H) based on the current chart structure. Gold previously traded within a well-defined ascending channel, where price respected both the rising support and resistance lines, forming a series of higher highs and higher lows. This structure

Gold- From weekly to 15m chart. Where are the trades?These days, everyone has an opinion on Gold.
Most of them are bullish.
And to be fair — so am I.
But here is what many traders either don’t understand or simply ignore:
There is a huge difference between having an opinion and having a tradable opinion.
A tradable opinion is one that can actually
XAUUSD Breaks the Deadlock as Bulls Regain ControlXAUUSD has rebounded strongly after the corrective phase.
Following that clear impulse to the upside, bullish momentum briefly slowed and price transitioned into a clean, downward-sloping corrective structure—exactly the type of price behavior I often observe during trend continuation phases.
This

Gold Price Analysis – Key Resistance and Support LevelsThis chart outlines critical resistance and support levels for gold prices. The Key Resistance Level at 5,565.814 is a potential area for price rejection or breakout. If price approaches this level, watch for either a continuation of bullish momentum or a pause in upward movement. The Support Zone a

Gold Roadmap (1H): Breakout Scenario in PlayToday, I want to share a long setup for Gold( OANDA:XAUUSD ) on the 1-hour timeframe—so stay with me!
Gold is currently moving near a resistance zone($4,991-$4,878).
From a classical technical perspective, it appears that gold has formed a descending broadening wedge pattern. If we break above the

GOLD - Consolidation in a symmetrical triangle. Up or down? FX:XAUUSD showed signs of recovery on Friday, but the price is stuck within the boundaries of a symmetrical triangle, which generally indicates market uncertainty.
Key fundamental factors
The ADP, JOLTS, and unemployment claims reports pointed to weakness in the labor market, supporting exp

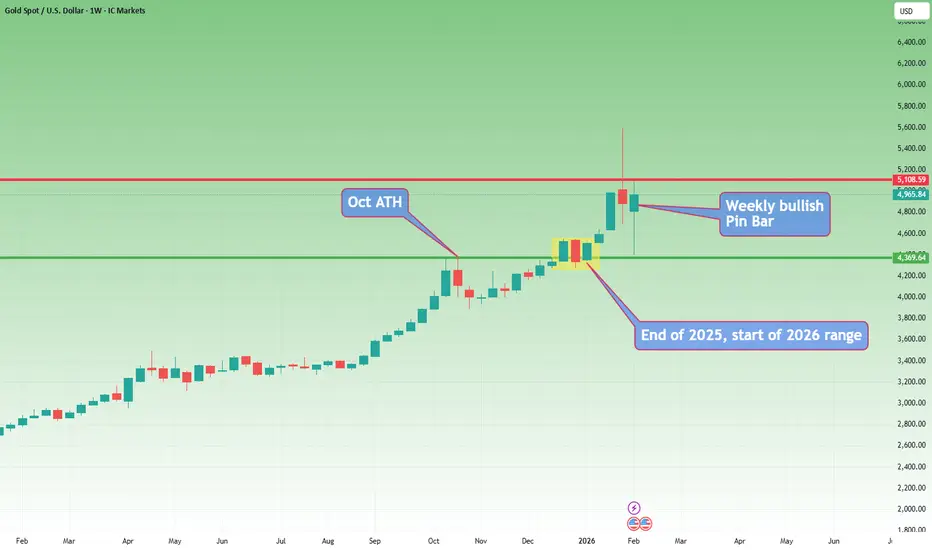
GOLD MONTHLY CHART LONG TERM/RANGE ROUTE MAPHey Everyone,
Please see our new monthly chart long term route map after completion of our last monthly chart.
Price is currently trading between 4843 Goldturn support and 5412 Goldturn resistance. We now have a monthly candle body close above 4843, which opens a long range gap toward 5298. To ext

THE KOG REPORT - UpdateEnd of week update from us here at KOG:
Not a bad game play here with price working with the range we plotted, bouncing early session from our EXC Hot Spot and the resuming the move to complete our long target.
We're at a crucial point here for bulls with defence above that ideally needs to break

See all futures ideas
EURUSD: Triangle Resistance Holds - Bearish Bias Toward 1.1730Hello everyone, here is my breakdown of the current EURUSD setup.
Market Analysis
EURUSD previously traded within a well-defined consolidation range, where price moved sideways for an extended period, reflecting temporary balance between buyers and sellers and gradual liquidity accumulation. This

Don’t Rush to Buy EURUSD – The Bearish Trend Is Speaking UpEURUSD is currently leaning toward a short-term BEARISH trend, as recent news continues to favor the U.S. dollar over the euro . The ECB has kept interest rates unchanged with a rather cautious tone , while Eurozone data and momentum remain too weak to support a sustainable EUR recovery. In contra
EUR/USD at Key level: Expansion or Reversal Setup?EUR/USD is currently trading within a critical technical area following a strong impulsive move to the upside. The daily structure remains constructive in the short term, but price has now reached a higher-timeframe supply zone that historically tends to attract sellers, making this level extremely

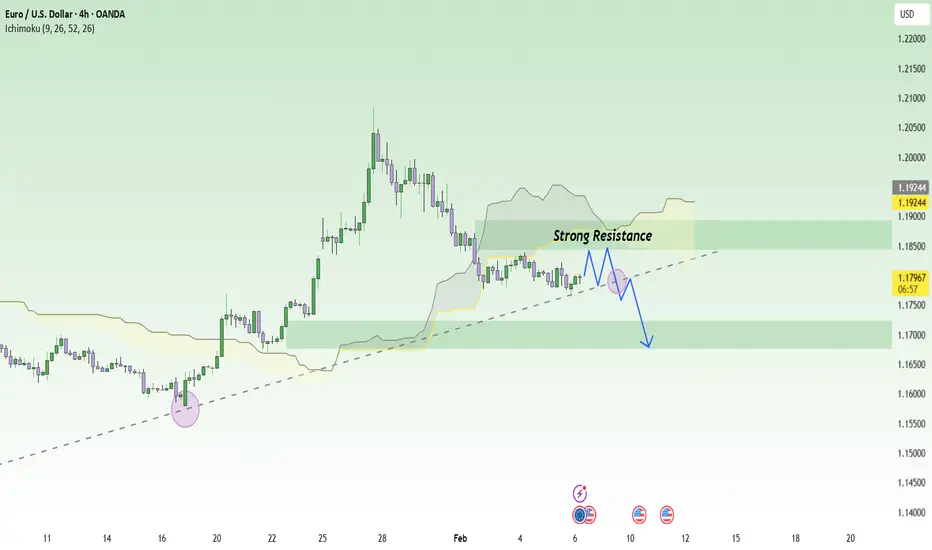
EURUSD Bearish Continuation After Liquidity SweepEURUSD on the 2H timeframe shows a completed bullish channel followed by a liquidity sweep at the highs, which marked exhaustion of the uptrend. After the sweep, price broke down from the rising structure and moved below the Ichimoku cloud, signaling a shift to bearish momentum. The pair is now cons

USDCAD: AB=CD pattern forming, price is expected to drop heavy!The USDCAD pair has two key areas where the price could reject. These areas hold potential and could serve as order blocs. The first entry is expected to be more accurate and likely to occur. However, if it doesn’t respect our level and breaks through the region, the price is likely to head towards

EURUSD Lower Timeframe Bearish ContinuationQuick Summary
EURUSD continues to trade bearish on lower timeframes and The move appears to be part of a daily timeframe correction, Price may retrace higher toward 1.19035
This level aligns with an H4 supply correction zone
After that continuation lower is expected to fill the liquidity void left

GBPJPY Will Fall! Short!
Here is our detailed technical review for GBPJPY.
Time Frame: 5h
Current Trend: Bearish
Sentiment: Overbought (based on 7-period RSI)
Forecast: Bearish
The market is approaching a significant resistance area 214.025.
Due to the fact that we see a positive bearish reaction from the underlined are

CADJPY Breaks Out of Another Bullish PatternCADJPY Breaks Out of Another Bullish Pattern
CADJPY has broken out of a descending wedge on the 1H chart, signaling bullish continuation.
Price is currently trading near 115.10, with upside targets at 115.50 and 116.00.
As long as the breakout holds, momentum favors buyers aiming for the highe

2 Scenarios - EURUSDHello traders,
the EURUSD price has formed a rectangle pattern.
We now have two possible scenarios :
🟢 BULLISH SCENARIO :
If the market breaks and closes above the resistance zone (1.18380 – 1.18226),
we can expect a bullish move .
🎯 TARGET: 1.19530
🔴 BEARISH SCENARIO :
If the price breaks

EUR/USD | Going to the bearish breaker (READ THE CAPTION)Good afternoon folks, Amirali here.
As you can see in the hourly chart of EURUSD, in the early hours of today, it reached the Bullish OB zone, then Swept the liquidity pool and then went up, hitting the IFVG and then gone above it, now being traded at 1.1796.
I'm eying the Bearish Breaker for a po

See all forex ideas
Trade directly on Supercharts through our supported, fully-verified, and user-reviewed brokers.


