Understanding the Carry Trade Strategy1. The Core Concept of Carry Trade
The essence of carry trade lies in exploiting interest rate differentials between two countries. Every currency has an interest rate attached to it—set by its central bank. For instance, if the interest rate in Japan is 0.1% and in Australia is 4.5%, a trader can borrow Japanese yen at the lower rate and invest in Australian dollars to earn the higher rate.
The formula for expected profit in a simple carry trade is:
Carry Trade Profit = Interest Rate Differential + Currency Appreciation (or - Depreciation)
Thus, profits come from two sources:
Interest income from the higher-yielding currency.
Exchange rate gains if the invested currency appreciates relative to the funding currency.
2. Real-World Example of Carry Trade
Consider the USD/JPY carry trade—a classic example often used by traders.
Suppose the U.S. interest rate is 5% and Japan’s is 0.1%.
A trader borrows ¥10 million (Japanese yen) at 0.1% and converts it into U.S. dollars.
The trader then invests that money in a U.S. bond or other instrument yielding 5%.
Annual Profit (approx.):
Interest differential = 5% - 0.1% = 4.9%
If the USD/JPY exchange rate remains stable, the trader earns nearly 4.9% as profit. If the dollar appreciates against the yen, profits rise further when converting back to yen. However, if the dollar weakens, part of the profit—or even all of it—can be wiped out.
3. Historical Perspective: The Rise of Carry Trades
Carry trades gained prominence in the 1990s and early 2000s, driven by globalization and massive liquidity in global markets.
One of the most famous examples was the Japanese Yen Carry Trade. Japan’s ultra-low interest rates encouraged global investors to borrow yen cheaply and invest in higher-yielding assets across the world—especially in emerging markets and commodities.
Between 2003 and 2007, this strategy helped fuel asset bubbles in stocks, real estate, and commodities. Investors were earning attractive returns as long as volatility remained low. But when the 2008 Global Financial Crisis hit, markets turned risk-averse, and carry trades were rapidly unwound. The yen surged as traders rushed to repay yen loans, resulting in sharp losses for many.
4. The Mechanics of Carry Trade Profits
Carry trade profits can be broken down into three main elements:
A. Interest Rate Differential
This is the basic profit component. The greater the difference between the two countries’ interest rates, the higher the potential return.
B. Exchange Rate Movements
The real profit or loss depends heavily on how exchange rates move during the investment period. If the high-yield currency strengthens, profits increase; if it weakens, losses mount.
C. Leverage
Forex markets allow high leverage—sometimes up to 100:1 or even higher. This means traders can amplify returns (and risks) substantially. A small interest rate difference can produce significant profits when multiplied by large positions.
5. Factors Influencing Carry Trade Returns
Several macroeconomic and market factors determine how profitable carry trades can be:
1. Central Bank Policies
Changes in interest rates by central banks directly impact carry trade returns. If a central bank raises rates, its currency becomes more attractive for investment; if it cuts rates, the currency weakens.
2. Inflation Expectations
High inflation can erode real returns, making a high-yield currency less appealing. Traders prefer stable economies with manageable inflation.
3. Market Volatility
Carry trades thrive in periods of low volatility. When markets are calm, traders are more willing to take on risk. During crises, investors rush to safe-haven currencies like the U.S. dollar, Swiss franc, or Japanese yen, often leading to large carry trade losses.
4. Global Risk Sentiment
Carry trades are often referred to as “risk-on” trades. They perform well when global markets are optimistic and fail when fear dominates. This is why equity market trends, bond yields, and commodity prices all indirectly affect carry trade profitability.
5. Currency Liquidity
Major currencies like USD, EUR, JPY, and GBP are highly liquid and preferred for carry trades. Emerging market currencies may offer higher yields but also carry higher volatility and default risk.
6. Popular Carry Trade Currency Pairs
Some of the most widely used carry trade pairs include:
AUD/JPY (Australian Dollar / Japanese Yen) – Classic pair due to Australia’s historically high rates and Japan’s near-zero rates.
NZD/JPY (New Zealand Dollar / Japanese Yen) – Similar to AUD/JPY, with higher yield differentials.
USD/CHF (U.S. Dollar / Swiss Franc) – Used when U.S. rates are higher than Switzerland’s.
TRY/JPY (Turkish Lira / Japanese Yen) – Extremely high yields but high volatility.
BRL/JPY (Brazilian Real / Japanese Yen) – Popular during commodity booms, but risky during downturns.
7. Risks in Carry Trade Strategy
While carry trades can generate steady profits in stable times, they are not risk-free. Major risks include:
A. Exchange Rate Risk
The biggest danger. A sudden appreciation in the funding currency or depreciation in the target currency can erase profits instantly.
B. Interest Rate Changes
Unexpected central bank decisions can sharply change interest rate differentials, hurting carry positions.
C. Market Sentiment Shifts
During global crises or geopolitical tensions, investors rush to unwind carry trades, leading to rapid currency reversals.
D. Leverage Risk
Because carry trades often use high leverage, even small currency moves can cause large losses.
E. Liquidity Risk
In volatile markets, traders might face liquidity shortages, making it difficult to close positions at desired prices.
8. Modern Trends in Carry Trades
In today’s financial environment, carry trade strategies have evolved beyond simple currency pairs. Institutional investors use derivatives, swaps, and ETFs to implement sophisticated carry trade structures.
Post-2020, as global central banks diverged in their policy responses, carry trades returned in new forms:
U.S. Dollar Carry Trades (2022–2024): As the U.S. Federal Reserve raised rates, investors borrowed in low-yielding currencies (like yen) to invest in dollar assets.
Emerging Market Carry Trades: Countries like Mexico, Brazil, and India offered high returns due to elevated interest rates, attracting foreign capital.
Crypto Carry Trades: Some investors even use stablecoins and crypto lending platforms to earn yield differentials, though with added risks.
9. Carry Trade and Global Financial Stability
Carry trades play a crucial role in global capital flows. When investors move funds across borders seeking yield, they influence exchange rates, bond yields, and asset prices.
However, this can create instability:
A large unwinding of carry trades can trigger currency crashes.
It can fuel asset bubbles in emerging markets.
It may distort monetary policy transmission in developing economies.
For example, during the 2008 crisis, the yen surged as carry trades unwound, destabilizing global markets. Similarly, during 2020’s COVID panic, the rapid appreciation of the dollar caused liquidity stress worldwide.
10. Managing Risks and Enhancing Carry Trade Profits
Successful carry traders don’t rely solely on interest differentials—they actively manage risk through various techniques:
A. Hedging
Using options and forward contracts to protect against adverse currency moves.
B. Diversification
Spreading investments across multiple currency pairs reduces exposure to a single market shock.
C. Monitoring Economic Data
Keeping track of inflation, central bank meetings, GDP growth, and unemployment helps anticipate policy changes.
D. Using Technical Analysis
Identifying strong trends and key support/resistance levels can optimize entry and exit points.
E. Position Sizing
Maintaining disciplined position sizes relative to account equity prevents catastrophic losses during unexpected events.
11. Carry Trade in the Post-Interest Hike World
After years of ultra-low rates, the world entered a new monetary era post-2022, where inflation surged and central banks tightened policies. This reshaped carry trade dynamics:
The U.S. Dollar became the favored investment currency due to its high yields.
The Japanese Yen and Swiss Franc again became popular funding currencies.
Emerging markets like India, Indonesia, and Brazil attracted carry flows due to strong domestic demand and stable growth.
However, volatility remains high. With central banks recalibrating rates, traders must remain agile, adapting strategies to shifting yield curves.
12. The Psychology Behind Carry Trades
Carry trades are as much about psychology as economics. When markets are optimistic (“risk-on”), investors believe currencies with higher yields will remain stable, leading to self-reinforcing inflows. But once fear sets in (“risk-off”), the same investors rush for safety, causing violent reversals.
This herd behavior explains why carry trades often “grind higher slowly” but “crash quickly.”
13. Carry Trade and Macroeconomic Indicators
Certain indicators provide clues about carry trade potential:
Interest Rate Differentials: The larger the spread, the greater the opportunity.
Volatility Index (VIX): Low VIX values favor carry trades; high VIX signals danger.
Commodity Prices: For countries like Australia or Brazil, commodity booms strengthen their currencies, enhancing carry returns.
Current Account Balance: Surplus nations have more stable currencies, reducing depreciation risk.
14. Example: The AUD/JPY Case Study
Let’s revisit the Australian Dollar / Japanese Yen pair—a carry trade classic.
Between 2003 and 2007:
Australia’s interest rate averaged around 6%, while Japan’s was near 0%.
Investors borrowing yen and investing in AUD earned a 6% interest differential plus additional currency gains as AUD appreciated.
However, during the 2008 financial crisis, the AUD/JPY pair fell nearly 40% in months as investors fled to safety. This demonstrated the twin-edged nature of carry trades—profitable during stability but dangerous in turmoil.
15. The Future of Carry Trade Profits
Looking ahead, carry trades will continue to evolve with shifting global monetary landscapes. Key trends shaping their future include:
AI-driven Forex Trading: Algorithms now optimize carry strategies based on real-time data, volatility signals, and machine learning models.
Decentralized Finance (DeFi): On blockchain platforms, yield differentials between tokens and stablecoins mimic traditional carry trades.
Diverging Monetary Cycles: With some central banks cutting rates while others hike, new opportunities will emerge across regions.
However, geopolitical uncertainty, inflationary pressures, and climate-related disruptions will keep volatility elevated—testing even the most sophisticated carry traders.
Conclusion: The Double-Edged Sword of Carry Trade Profits
Carry trades remain one of the most powerful yet perilous tools in global finance. They thrive in stability and crumble in panic. At their best, they provide consistent yield and drive cross-border investment; at their worst, they amplify global financial shocks.
For modern traders and investors, understanding the mechanics, risks, and psychology behind carry trade profits is essential. Success lies not merely in spotting interest differentials but in anticipating the shifts in market sentiment and monetary cycles that dictate when the trade will shine—or collapse.
Ultimately, carry trade profits are not just a measure of financial skill—they reflect the pulse of the global economy itself, balancing between the search for yield and the instinct for safety.
Chart Patterns
Global Market Analysis: Dynamics of the World Economy1. The Structure of the Global Market
The global market isn’t a single entity but rather a network of interconnected sub-markets—each influencing the other. These include:
Equity Markets: Stock exchanges across the world like NYSE (USA), LSE (UK), NSE (India), and Nikkei (Japan) where investors buy and sell company shares.
Bond Markets: Governments and corporations issue bonds to raise capital, influencing global interest rates and credit flows.
Foreign Exchange (Forex) Markets: The largest financial market globally, with a daily turnover exceeding $7 trillion, dictating exchange rates between currencies.
Commodity Markets: Covering energy (oil, gas), metals (gold, copper), and agricultural products (wheat, soybeans), these markets affect inflation and industrial costs.
Derivatives Markets: Financial instruments like futures, options, and swaps that allow investors to hedge risks or speculate on price movements.
These markets operate through both developed economies (like the U.S., Japan, and the EU) and emerging economies (like China, India, and Brazil), whose increasing influence has reshaped global trade and investment flows.
2. Key Drivers of the Global Market
Global markets respond to a mix of economic, political, and technological factors. The main drivers include:
a) Economic Indicators
Economic health is reflected through metrics such as:
GDP Growth Rates: Indicate whether economies are expanding or contracting.
Inflation & Interest Rates: Affect consumer spending, borrowing, and corporate investment.
Employment Data: High employment boosts consumption; unemployment signals economic stress.
Trade Balances: Show the difference between exports and imports, influencing currency strength.
b) Monetary Policy
Central banks like the U.S. Federal Reserve, European Central Bank, and Reserve Bank of India regulate liquidity and interest rates. A dovish stance (low interest rates) usually stimulates growth and stock markets, while a hawkish stance (high rates) can slow them down.
c) Geopolitical Stability
Wars, trade conflicts, and political shifts (like Brexit or U.S.-China tensions) can disrupt supply chains, affect oil prices, and create investor uncertainty.
d) Technological Innovation
Technology drives productivity, reshapes industries, and spawns new sectors such as AI, renewable energy, and digital finance, which attract global capital.
e) Investor Sentiment
Perception often drives short-term market movements. When optimism prevails, “risk-on” assets like equities rise; when fear sets in, “safe-haven” assets like gold and the U.S. dollar gain.
3. Regional Market Analysis
Global market dynamics differ across regions, each contributing uniquely to the world economy.
a) The United States
The U.S. remains the largest and most influential economy, contributing about 25% to global GDP. Its stock markets (Dow Jones, S&P 500, NASDAQ) serve as global benchmarks.
Key trends include:
Strong consumer-driven growth.
Leadership in technology and innovation.
Monetary policy shifts under the Federal Reserve.
Fiscal deficits and debt ceiling debates impacting investor confidence.
b) Europe
Europe’s markets are heavily influenced by the European Central Bank (ECB) and political cohesion within the European Union (EU).
Key challenges include:
Energy dependence post-Russia-Ukraine conflict.
Slower growth in aging economies.
Regulatory leadership in green and digital finance.
c) Asia-Pacific
Asia is the growth engine of the global economy, led by:
China: Transitioning from export-led to consumption-driven growth.
India: A rising powerhouse in technology, services, and manufacturing.
Japan and South Korea: Advanced in technology and industrial exports.
ASEAN nations (like Indonesia, Vietnam, and Malaysia) are also gaining traction as supply chain alternatives to China.
d) Middle East and Africa
The Middle East, dominated by oil exporters like Saudi Arabia and UAE, is diversifying through Vision 2030-type reforms.
Africa, meanwhile, is emerging with vast natural resources and young demographics, attracting long-term infrastructure investments.
e) Latin America
Countries like Brazil, Mexico, and Chile are resource-rich economies sensitive to commodity cycles. Political instability and inflation remain challenges, but trade relations with the U.S. and China support recovery.
4. Interconnectedness and Globalization
Global markets are deeply interconnected, meaning a policy decision in one country can ripple across the world.
Examples include:
U.S. interest rate hikes affecting capital outflows from emerging markets.
China’s slowdown reducing demand for global commodities.
European energy crises impacting industrial production worldwide.
This interdependence has both benefits (growth opportunities) and risks (contagion effects). The 2008 global financial crisis and the 2020 pandemic illustrated how quickly economic shocks can spread globally.
5. Role of Currencies and Forex Markets
Currency markets are the lifeblood of global trade. Exchange rates determine export competitiveness and investment returns.
Key currency dynamics include:
U.S. Dollar Dominance: The dollar remains the global reserve currency, used in 80% of trade settlements.
Euro and Yen Influence: Widely used in international trade and finance.
Emerging Market Currencies: Often volatile, influenced by capital flows and inflation.
Digital Currencies & CBDCs: Central Bank Digital Currencies (CBDCs) are reshaping how cross-border payments occur.
Currency volatility affects companies’ profits, inflation, and global investment flows, making forex analysis central to global market forecasting.
6. Commodity Market Overview
Commodities form the foundation of industrial and consumer economies.
Key categories include:
a) Energy
Crude oil and natural gas dominate global energy trade. Prices fluctuate with OPEC+ decisions, geopolitical tensions, and renewable energy transitions.
b) Metals
Gold, silver, copper, and lithium are vital for industries, technology, and investments. The global shift toward electric vehicles (EVs) has increased demand for lithium and copper.
c) Agriculture
Food commodities like wheat, corn, and soybeans are influenced by weather, trade policies, and geopolitical disruptions.
Commodities often act as inflation hedges and safe-haven assets during market uncertainty.
7. Emerging Market Trends
a) Digital Transformation
E-commerce, fintech, and digital payments have redefined trade and consumption. Platforms like Amazon, Alibaba, and Paytm are reshaping economies.
b) Renewable Energy Transition
As climate concerns rise, investment is shifting from fossil fuels to green technologies, including solar, wind, and hydrogen energy.
c) AI and Automation
Artificial intelligence is boosting efficiency, data analysis, and algorithmic trading, impacting labor markets and productivity.
d) Supply Chain Diversification
Post-pandemic disruptions and geopolitical risks have encouraged “China+1” strategies, moving manufacturing to countries like India and Vietnam.
e) Financial Inclusion
Microfinance, mobile banking, and digital currencies are bringing millions into the formal economy in developing nations.
8. Risks and Challenges in the Global Market
a) Inflation and Interest Rate Volatility
High inflation erodes purchasing power, prompting central banks to raise interest rates — often slowing growth and raising recession fears.
b) Geopolitical Tensions
Conflicts in Ukraine, Middle East tensions, and U.S.-China rivalry continue to threaten global stability.
c) Climate Change
Extreme weather impacts agriculture, infrastructure, and migration patterns, introducing long-term risks.
d) Debt Crisis
Several nations face rising public debt burdens due to post-pandemic stimulus measures and global borrowing costs.
e) Cybersecurity Threats
As financial systems digitize, cyberattacks pose serious risks to global financial stability.
9. Tools and Techniques for Global Market Analysis
Professionals use multiple analytical frameworks to understand market movements:
Fundamental Analysis: Examines economic data, earnings reports, and macro indicators.
Technical Analysis: Studies price patterns, volume, and momentum indicators for trading insights.
Sentiment Analysis: Gauges investor mood using surveys, volatility indexes (VIX), and media trends.
Quantitative Models: Use algorithms and big data for predictive insights.
Comparative Analysis: Compares economies or sectors to identify relative strengths and weaknesses.
Data sources include IMF, World Bank, OECD, and Bloomberg, which provide real-time global financial information.
10. The Future of Global Markets
The coming decade promises profound transformation in how global markets operate:
a) Multipolar World Order
Power is shifting from the West to Asia, especially China and India, creating new centers of influence.
b) Rise of Green Finance
Investments in renewable energy, ESG (Environmental, Social, Governance) funds, and carbon trading are gaining momentum.
c) Digital Currencies and Blockchain
Blockchain-based systems may reduce transaction costs, enhance transparency, and change global banking.
d) Artificial Intelligence in Trading
AI-driven trading and predictive analytics are enhancing efficiency but also increasing systemic risks from algorithmic errors.
e) Inclusive Globalization
Future markets will focus on inclusive growth, ensuring developing economies benefit equitably from global trade.
Conclusion
Global market analysis is more than tracking numbers—it’s about understanding the story of interdependence, where economic, political, and social forces intersect. The 21st-century global market is a complex web that connects the fate of nations and individuals alike.
From the movement of oil prices to central bank policies, from AI-driven innovation to geopolitical realignments, every element plays a role in shaping global outcomes.
For investors, policymakers, and businesses, mastering global market analysis means recognizing patterns, anticipating shifts, and adapting strategies in an ever-evolving environment.
As we move toward 2030 and beyond, the future global market will be defined by sustainability, technology, and cooperation—where knowledge, agility, and foresight become the true currencies of success.
Currency Wars and Forex TradingThe Battle Behind Global Exchange Rates.
1. Understanding Currency Wars
A currency war, often called a “competitive devaluation,” occurs when countries intentionally lower the value of their currencies to boost exports, reduce imports, and stimulate domestic economic growth. The logic is simple:
A cheaper currency makes a nation’s goods more affordable abroad.
Exports rise, and trade balance improves.
However, it comes at a cost — other nations retaliate, leading to global instability.
The term “currency war” gained popularity during the 2008 global financial crisis, when major economies used monetary easing policies to flood markets with liquidity, weakening their currencies in the process. But the roots of currency manipulation stretch back centuries — from the 1930s Great Depression to modern-day U.S.-China tensions.
A currency war can start subtly — through interest rate cuts, quantitative easing (QE), or direct market intervention — but its ripple effects can disrupt entire markets, especially the forex market, where even a 0.5% change can move billions of dollars.
2. The Mechanics of a Currency War
To understand how a currency war unfolds, it’s essential to look at the tools nations use to influence their exchange rates.
a. Monetary Policy Manipulation
Central banks are the first line of action. By cutting interest rates, a country makes its currency less attractive to investors, thereby reducing its value. Conversely, raising rates strengthens the currency.
Example: When the U.S. Federal Reserve cuts rates, the dollar weakens, boosting American exports.
b. Quantitative Easing (QE)
QE involves printing money or purchasing financial assets to inject liquidity into the economy. This floods the market with domestic currency, increasing supply and pushing its value down.
Example: Japan and the European Central Bank have extensively used QE to combat deflation and stimulate exports.
c. Foreign Exchange Intervention
Sometimes, central banks directly buy or sell currencies in the forex market to influence rates.
Example: The Swiss National Bank (SNB) famously intervened to keep the Swiss franc from becoming too strong during the Eurozone crisis.
d. Capital Controls
In extreme cases, countries may restrict capital flows to prevent unwanted appreciation or depreciation of their currency.
Each of these tools affects not just domestic economics but also global forex trading dynamics, as investors respond to shifts in interest rates, liquidity, and political intentions.
3. Historical Examples of Currency Wars
Currency wars are not new. They have shaped global trade and politics for nearly a century.
a. The 1930s “Beggar-Thy-Neighbor” Era
During the Great Depression, countries like the U.K. and U.S. abandoned the gold standard and devalued their currencies to make exports cheaper. This triggered retaliatory actions from others, worsening global economic tensions.
b. The Plaza Accord (1985)
In the 1980s, the U.S. faced massive trade deficits with Japan and Germany. To correct this, the Plaza Accord was signed, where nations agreed to devalue the U.S. dollar. It worked temporarily, but the unintended consequence was Japan’s asset bubble in the 1990s.
c. The Modern Currency War (Post-2008)
After the 2008 global financial crisis, central banks adopted zero interest rates and quantitative easing. The U.S. dollar, euro, and yen became heavily manipulated currencies as nations sought export competitiveness.
China, on the other hand, was accused by the U.S. of artificially weakening the yuan to keep exports cheap — an accusation that led to the so-called U.S.-China currency war.
4. The Role of Forex Traders in a Currency War
Currency wars create both risks and opportunities for forex traders. When nations intervene in their exchange rates, it generates high volatility, making the forex market extremely reactive.
a. Increased Volatility
Central bank announcements or policy changes can lead to sudden 2–3% moves in major currency pairs. Traders who can anticipate or react quickly can profit — but the risk of being caught on the wrong side is immense.
b. Predictable Trends
Currency wars often create long-term directional trends. For example, during QE periods, the USD/JPY or EUR/USD pairs followed consistent paths that skilled traders could exploit.
c. Fundamental Trading Becomes Key
In a currency war, understanding macroeconomic indicators — like interest rates, inflation, and trade data — becomes essential. Technical charts alone are not enough; traders must interpret central bank statements, policy outlooks, and global trade flows.
d. Safe-Haven Currencies
When tensions rise, traders flock to “safe-haven” currencies like the Swiss franc (CHF), Japanese yen (JPY), or U.S. dollar (USD). These currencies tend to strengthen during crises, creating defensive strategies for traders.
5. Major Players in Currency Manipulation
The world’s major economies often play leading roles in currency adjustments, either overtly or covertly.
a. The United States (USD)
The dollar is the world’s reserve currency, making it central to all currency wars. The Federal Reserve’s monetary policy has global consequences — a weaker dollar benefits emerging markets, while a stronger dollar tightens global liquidity.
b. China (CNY)
China has historically pegged the yuan to the dollar to control its export competitiveness. The People’s Bank of China (PBoC) carefully manages its exchange rate, often leading to accusations of manipulation from the U.S.
c. Japan (JPY)
Japan’s decades-long battle with deflation led to repeated rounds of currency weakening through Abenomics, a policy mix of fiscal stimulus and monetary easing.
d. The European Union (EUR)
The European Central Bank (ECB) engages in QE and negative interest rates to stimulate growth in the Eurozone, often weakening the euro.
e. Emerging Markets
Countries like India, Brazil, and Russia intervene occasionally to stabilize their currencies against volatile capital flows or inflationary pressures.
6. How Currency Wars Impact the Global Economy
Currency wars can initially appear beneficial for export-heavy economies, but prolonged conflicts have widespread negative effects:
a. Trade Imbalances
While devaluation boosts exports temporarily, it also increases import costs, leading to inflationary pressures and higher prices for consumers.
b. Inflation and Purchasing Power
A weaker currency means imported goods become expensive. This reduces purchasing power and can erode domestic savings.
c. Market Instability
Competitive devaluations can lead to capital flight, stock market crashes, and loss of investor confidence in emerging economies.
d. Geopolitical Tensions
Currency manipulation often leads to diplomatic strains. The U.S. frequently labels countries as “currency manipulators,” triggering trade disputes and tariffs.
e. Race to the Bottom
When every country tries to devalue its currency simultaneously, it results in a zero-sum game — no one truly wins. Instead, the global financial system becomes more unstable.
7. Forex Trading Strategies During Currency Wars
Smart traders understand that currency wars are not random; they follow predictable policy patterns. Here are some effective strategies to trade during such times:
a. Follow Central Bank Policies
Monitor statements from major central banks like the Federal Reserve, ECB, BoJ, and PBoC. Currency trends often align with their monetary direction.
b. Use Carry Trades Cautiously
In normal times, traders borrow low-interest-rate currencies to invest in high-interest ones. During currency wars, however, central banks often cut rates, making carry trades riskier.
c. Focus on Safe-Haven Assets
When uncertainty rises, traders shift funds to safe-haven currencies and assets like gold or the U.S. Treasury bonds. Pairing risk currencies (like AUD or NZD) against safe havens (like JPY or CHF) can yield profits.
d. Use Fundamental + Technical Analysis
Combine macroeconomic understanding (inflation, GDP, interest rates) with technical signals (support, resistance, trendlines) to identify high-probability trades.
e. Manage Risk Aggressively
Currency wars bring unpredictable volatility. Setting tight stop-loss levels, using smaller position sizes, and avoiding overleveraging are crucial.
8. The Digital Age: Currency Wars in the Era of Cryptocurrencies
The emergence of digital currencies and blockchain technology has introduced a new dimension to currency competition. Nations are now exploring Central Bank Digital Currencies (CBDCs) to maintain control over monetary policy and reduce reliance on foreign currencies.
Cryptocurrencies like Bitcoin are often seen as a hedge against fiat currency manipulation. During aggressive devaluations or hyperinflation, digital assets gain appeal as “non-sovereign stores of value.”
For forex traders, the rise of crypto–forex hybrids — trading Bitcoin against fiat pairs (BTC/USD, BTC/JPY) — offers new diversification opportunities. However, it also adds volatility and complexity to traditional currency markets.
9. The Future of Currency Wars
As global economies recover from recent crises and navigate geopolitical tensions, currency wars are expected to evolve — not disappear.
Artificial Intelligence & Algorithms: Central banks and trading firms are increasingly using AI to predict and manage currency flows.
Energy & Commodity Influence: Nations rich in energy reserves (like Russia or Saudi Arabia) may use oil and commodity pricing to influence currency demand.
De-Dollarization: Many nations, especially BRICS members, are pushing for trade settlement in non-dollar currencies to reduce dependence on the U.S. dollar.
Global Coordination: Institutions like the IMF and G20 continue to push for coordination to prevent destructive currency competition.
The next phase of currency wars may not be about devaluation alone but about digital dominance, monetary sovereignty, and data control.
10. Conclusion: Trading in the Midst of Monetary Battles
Currency wars remind us that the forex market is not just about charts, pips, and leverage — it’s about political strategy, economic survival, and global power. For traders, understanding the deeper forces behind exchange rate movements is crucial.
A skilled forex trader doesn’t just react to price — they interpret the motive behind central bank actions, fiscal policies, and trade tensions. The winners in this environment are those who can combine macro insight with disciplined strategy.
In the end, currency wars may be fought by nations, but their outcomes are traded by individuals. Every pip of movement reflects a global tug-of-war between economic giants — and for those who understand the game, it’s both a battlefield and a goldmine.
Gold Trading Strategy Based on News (News Trading)Hello everyone,
When it comes to gold, few things move the market faster and stronger than economic news. Data releases such as CPI, NFP, or Fed interest rate decisions can cause gold prices to swing sharply within minutes — creating perfect opportunities for traders who react in time. For example, a higher-than-expected CPI report often pushes gold prices up, while a strong NFP can send them plunging instantly.
To take advantage of these moves, you must first understand how each type of news impacts gold. A high CPI signals rising inflation — gold tends to climb as investors seek protection against inflation. A low CPI usually strengthens the USD, pushing gold lower. A strong NFP indicates economic growth, leading to USD gains and gold weakness, while a weak NFP weakens the USD and boosts gold. As for the Fed’s interest rate decisions : rate hikes strengthen the USD and pressure gold, while rate cuts do the opposite.
The core strategy here is to trade immediately after the news release . If the outcome exceeds expectations, gold typically reacts sharply: high CPI or weak NFP → buy, strong NFP or low CPI → sell . The key is quick execution and strict risk management .
The Economic Calendar on TradingView is your best ally — it helps you track upcoming data releases in real time. Before the news, identify the market expectation and prepare your buy or sell setups. Once the data drops, react based on price action and always set a proper Stop Loss : below support for buys, above resistance for sells, and never risk more than 1–2% of your account per trade .
This strategy’s appeal lies in the high volatility, rapid opportunities , and strong liquidity , which allow for efficient entries and exits. Traders who can stay calm and react correctly can capture sharp profits from news shocks — while those unprepared often get caught in the chaos.
In short, trading gold based on news is a powerful strategy — but it only works if you master timing, manage your risk carefully, and stay updated with tools like the Economic Calendar.
Are you ready to catch gold’s next big move when the news hits?
GameStop and Fibonacci: It's About TimeThis is my first attempt at publishing a video on TradingView, so hopefully it works.
I wanted to put together something educational about fib channels and why I like to use them. They're not a silver bullet, but they do tell you a lot about where to expect support and resistance because the chart has a very good memory, and you can see this play out on pretty much any instrument, including cryptocurrencies.
I follow NYSE:GME closer than any other ticker, so this video is about my philosophy on the fib channels that I have been using on the GME chart and talking about on the Echo Chamber Podcast. Hopefully this adds a little more context to that discussion, how the flat price levels are not always the only thing that matters, but taking time-based trends into account can make a big difference in your analysis and understanding of price movement.
Happy to hear people's thoughts on my crayons 🖍️ which color should I eat next?
Since this is a bit of a longer video, here's an AI summary of the content with timestamps:
Introduction 00:00-01:05
I introduce the topic of explaining my TradingView chart, which has many colorful lines. I clarify that I didn't manually draw all the lines, but used Fibonacci channels that only require selecting 3 points.
Explaining Current Chart 01:05-04:33
I show my current GameStop chart, explaining various trend lines and Fibonacci channels. I demonstrate how to adjust the Fibonacci channel points to analyze different price movements.
Fresh Chart Walkthrough 04:33-11:57
Moving to a clean chart, I explain global chart items, including trend lines from major tops and bottoms. I discuss dividend-adjusted vs non-adjusted charts and explain the "Gandalf line" of support.
Fibonacci Channels Explanation 11:57-24:54
I provide a detailed explanation of how Fibonacci channels work, demonstrating how to draw them and interpret the resulting lines. I show how these channels can describe price action across long time periods.
Additional Examples 24:54-33:44
I show more examples of Fibonacci channels applied to GameStop's entire price history. I discuss how these channels can provide insight into potential future price movements and support/resistance levels.
Conclusion 33:44-34:40
I summarize my thoughts on GameStop's current price action in relation to the Fibonacci channels and support levels identified.
Some Quotes
"I find them mathematically interesting." 11:54 - Referring to trend-based Fibonacci tools.
"Math is your friend here. But you don't have to do the math, you just can use tools that will help you." 17:19
"Price is fractal in nature in that patterns are repeating and Fibonacci is everywhere." 17:19
"Things like history repeats itself. It's just a question of when, not if." 24:30
"The point I want to drive home here is that when we start to get a little bit more granular here, and this is why I have lots of crayons on my chart." 28:34
Key Tips/Concepts
Fibonacci channels can be powerful tools for technical analysis, providing insight into potential support and resistance levels.
These channels can sometimes describe price action across very long time periods, even when drawn based on recent price movements with thoughtfully selected endpoints.
The importance of considering price, time, and volume in technical analysis, as demonstrated by the "Gandalf line".
The value of using multiple timeframes and chart types (dividend-adjusted vs non-adjusted, trading hours only vs extended hours included) to gain a more complete picture of a stock's price history. (Editorial note: something I didn't cover in the video, but the difference between log scale and linear scale sometimes will make for an interesting story on trendlines and fib channels too. I prefer to keep my chart in log scale, but will toggle between log and linear occasionally to see if there's something interesting there in the lines already drawn.)
The concept of fractal nature in price movements and how patterns tend to repeat over time.

Dow Jones v/s Gold Ratio — History Repeating?Currently both DJI & Gold are at there peak levels, but the ratio has already breached a historical support, signaling further downfall.
Whenever the Dow-to-Gold ratio tests or breaks the 12.0 level, stories are created in history.
* 1929: Great Depression hit — stocks crashed, gold outperformed.
* 1973: Oil shock & stagflation — gold surged as inflation soared.
* 2008: Global Financial Crisis — stocks collapsed, gold became the safe haven.
- 2020: COVID tested the level but failed to break it.
Now, in 2025, the ratio has again breached the historic level of 12.0 — the same zone that preceded past market meltdowns.
Each time stocks looked strong relative to gold, the cycle turned
* Gold rallied.
- Stocks corrected.
----------------------------------------------------------------------------------------------------------------
What is the Dow-to-Gold Ratio?
Dow/Gold Ratio = Value of Dow Jones Index ÷ Price of Gold (per ounce)
This ratio tells us how many ounces of gold it takes to buy one unit of the Dow Jones Industrial Average.
For example:
If Dow = 46,000 and Gold = 4000 → Ratio = 11.5.
That means it takes 11.5 ounces of gold to buy one unit of Dow.
If the ratio falls to 6, which the chart is signaling, then it will mean:
1. Stocks might weaken or
2. Gold might become stronger or
3. If both weaken, then stocks will fall more than gold
----------------------------------------------------------------------------------------------------------------
Interpretation
1. Whenever the ratio is high, it means stocks are expensive compared to gold (risk-on period) .
2. Whenever the ratio falls, it means gold is outperforming stocks (risk-off, crisis or correction phase) .
Overall, the Dow to Gold ratio suggests that this is not a normal period - a period of crisis & correction - a risk-off period
Each time this ratio reached around current levels, a major stock market downturn followed

Is Your Money Safe in the Global Market?Introduction: Understanding Global Market Safety
In today’s interconnected financial world, investors from all corners of the globe participate in markets that span continents, currencies, and asset classes. From equities in New York and bonds in London to commodities in Dubai and emerging market funds in Asia — the global marketplace offers immense opportunities for growth. However, with great opportunity comes great risk. The question that often arises is: “How do I know my money is safe in the global market?”
Financial safety doesn’t mean avoiding risks entirely — it means understanding, managing, and minimizing them while ensuring that your wealth is protected from volatility, fraud, inflation, and geopolitical uncertainty. In this comprehensive guide, we’ll explore how to assess the safety of your investments, the factors influencing market stability, and practical steps to safeguard your money in the international financial system.
1. The Concept of Financial Safety in a Global Context
Before diving into protection strategies, it’s crucial to understand what “safety” means in the context of global markets. Investment safety can be broken down into several layers:
Capital Preservation: Ensuring your principal investment is not lost due to volatility or fraud.
Liquidity: Having the ability to convert your investments into cash without excessive losses.
Diversification: Spreading investments across regions and asset classes to minimize exposure to localized risks.
Regulatory Security: Investing under well-regulated jurisdictions that protect investors through strong legal frameworks.
Transparency: Having access to reliable information about the companies, governments, or institutions managing your money.
Safety doesn’t imply zero risk — it’s about making informed, balanced decisions in a world where both risks and rewards coexist.
2. Identifying Risks in the Global Market
Understanding where potential threats lie is the first step toward protecting your capital. Key global market risks include:
a. Market Volatility
Prices of stocks, commodities, and currencies fluctuate due to investor sentiment, economic data, and political events. Sudden crashes or corrections can erode investment value.
b. Currency Risk
Exchange rate fluctuations can significantly impact returns for investors holding assets denominated in foreign currencies.
c. Geopolitical Risk
Wars, sanctions, trade restrictions, and political instability can destabilize entire regions, affecting investments globally.
d. Inflation and Interest Rate Risk
Central banks across the world control monetary policy, and their decisions on interest rates can influence global asset prices and investor returns.
e. Corporate and Credit Risk
When investing in international bonds or equities, there’s a possibility that companies or governments might default or underperform.
f. Cybersecurity and Fraud Risk
In the digital age, online trading and fintech platforms are vulnerable to hacking and scams. Protecting your accounts and verifying platforms are critical steps.
By understanding these threats, investors can take strategic steps to defend against them.
3. How to Assess the Safety of Global Investments
To determine whether your money is safe, use a multi-dimensional approach. Ask yourself the following questions before investing:
a. Who Regulates the Platform or Institution?
Ensure the financial institution is licensed under credible authorities like the U.S. SEC, UK FCA, or Monetary Authority of Singapore (MAS). These regulators impose strict rules to protect investors.
b. What is the Level of Transparency?
Trustworthy institutions publish audited financial statements and disclose their operations clearly. Lack of transparency is a red flag.
c. How Liquid Are My Investments?
Can you easily sell your assets or withdraw your funds? Illiquid markets can trap investors during crises.
d. What is the Risk Profile of the Asset Class?
Stocks, bonds, commodities, and cryptocurrencies all carry different risk levels. Balancing them according to your goals ensures stability.
e. How Diversified Is My Portfolio?
Investing across regions, sectors, and asset types minimizes exposure to localized risks.
f. Is There Insurance or Protection?
Check if your investments are covered by schemes like FDIC insurance (U.S.), Investor Compensation Scheme (U.K.), or equivalent programs in other countries.
4. The Role of Diversification in Safeguarding Money
Diversification is the cornerstone of global financial safety. By spreading investments across:
Geographies (U.S., Europe, Asia, Emerging Markets)
Asset Classes (Stocks, Bonds, Gold, Real Estate, Mutual Funds, ETFs)
Currencies (USD, EUR, GBP, JPY, INR, etc.)
…you can reduce the impact of any one region or market downturn. For example, when U.S. stocks fall, gold or Asian markets may rise, balancing your portfolio.
A well-diversified portfolio doesn’t guarantee profits, but it reduces the likelihood of catastrophic losses — ensuring long-term sustainability.
5. Importance of Financial Regulation and Investor Protection
Global financial safety relies heavily on regulatory systems. Reputable markets have robust laws to ensure:
Transparency and disclosure
Investor compensation in case of fraud
Clear operational standards for brokers and fund managers
Protection against insider trading and manipulation
When choosing a platform or institution, verify its regulatory license. Always invest through brokers and fund houses that are registered with major global regulatory authorities.
Avoid unregulated platforms that promise unrealistic returns — these are often scams or Ponzi schemes.
6. The Role of Technology and Cybersecurity in Financial Safety
Modern investing heavily depends on online trading platforms, mobile apps, and digital wallets. While technology provides convenience, it also introduces cyber risks.
To keep your investments safe:
Use two-factor authentication (2FA) on all trading accounts.
Never share passwords or OTPs.
Avoid public Wi-Fi while accessing trading apps.
Regularly monitor account statements for suspicious activities.
Ensure your broker uses end-to-end encryption and regulated payment gateways.
Financial cybersecurity is not just a company’s responsibility — it’s also a personal discipline.
7. Safe Haven Assets and Hedging Strategies
During global uncertainty — such as recessions, wars, or inflation spikes — investors often move their capital into safe haven assets, which tend to retain value.
These include:
Gold: A timeless hedge against inflation and currency devaluation.
U.S. Treasury Bonds: Considered among the safest investments globally.
Swiss Franc (CHF): A historically stable currency.
Blue-chip Stocks: Established multinational companies with strong fundamentals.
Hedging techniques like currency hedging, options, and futures can also protect against downside risks in volatile markets.
8. Evaluating the Global Economic Environment
Keeping your money safe requires staying informed about macroeconomic trends. Watch for:
Central bank policies (interest rates, quantitative easing)
Inflation data and GDP growth rates
Trade balances and foreign exchange reserves
Corporate earnings reports
A global investor must think beyond local borders — a policy shift in Washington or Beijing can influence markets from Mumbai to London.
9. Psychological Safety: The Human Element in Investing
Emotional decision-making often leads to poor investment choices. Fear and greed drive volatility more than data does. To ensure your money remains safe:
Avoid impulsive trading during market crashes.
Stick to a disciplined investment plan.
Set clear stop-loss levels and profit targets.
Regularly review and rebalance your portfolio.
Remember, the most dangerous element in investing isn’t the market — it’s the investor’s reaction to it.
10. Long-Term vs. Short-Term Safety
Short-term safety focuses on liquidity and minimizing volatility — ideal for emergency funds or near-term goals.
Long-term safety depends on inflation-beating growth through strategic diversification.
Balancing both ensures you don’t just protect your money — you grow it steadily over time.
11. The Future of Financial Safety: AI, Blockchain, and Transparency
Emerging technologies are redefining investment safety:
Blockchain ensures transparent and tamper-proof transactions.
Artificial Intelligence (AI) helps in fraud detection and portfolio optimization.
Decentralized Finance (DeFi) platforms are creating new ways for secure global investments — though they carry new types of risks.
The future of financial safety will be shaped by technology-led transparency, enabling investors to make more secure decisions globally.
12. Steps to Ensure Your Money Is Safe in the Global Market
Here’s a practical checklist every investor should follow:
Choose regulated brokers or financial institutions.
Diversify across asset classes and regions.
Use strong cybersecurity measures.
Avoid high-return, low-transparency schemes.
Monitor your investments regularly.
Stay informed about global macroeconomic trends.
Have an exit strategy and emergency plan.
Seek advice from certified financial advisors.
Financial safety is not a one-time act — it’s a continuous process of education, vigilance, and adaptation.
Conclusion: Security Through Knowledge and Strategy
The global financial market will always carry a mix of risk and reward. True safety doesn’t lie in avoiding risk entirely but in understanding and managing it wisely. By staying informed, diversifying strategically, using regulated platforms, and leveraging technology responsibly, investors can ensure that their money remains protected — no matter how volatile or uncertain the global landscape becomes.
In essence, your money’s safety depends not just on where you invest, but how you invest. With discipline, awareness, and smart planning, your wealth can thrive securely in the ever-evolving global marketplace.

Exploring the Types of Global Trading1. What is Global Trading?
Global trading refers to the exchange of goods, services, and financial assets between countries. It encompasses import and export activities, investment flows, and financial transactions that cross national borders. This system is the foundation of globalization — connecting producers and consumers across continents, creating job opportunities, and promoting economic efficiency.
It allows countries to:
Access goods and services not produced domestically.
Utilize comparative advantages.
Boost productivity through specialization.
Strengthen diplomatic and economic relationships.
2. The Evolution of Global Trading
Global trade has evolved over centuries — from the ancient Silk Road to today’s digital trade platforms. The journey reflects how innovation, technology, and political agreements have shaped economic interdependence.
Ancient Trade (Pre-1500s): Exchange of spices, textiles, and metals through trade routes like the Silk Road and maritime trade networks.
Colonial Era (1500s–1800s): Expansion of European empires led to global trade in commodities, often through exploitative systems.
Industrial Revolution (1800s–1900s): Mechanization and mass production boosted exports and international shipping.
Modern Era (1900s–Present): Rise of multinational corporations, free trade agreements, and digital commerce.
Today, global trading operates in multiple dimensions — involving physical goods, services, capital markets, and data exchange — with technology acting as a catalyst for rapid transactions and global supply chains.
3. Major Types of Global Trading
Global trading can be categorized based on the nature of exchange, mode of transaction, and economic objective. Let’s explore each type in detail.
A. Trade in Goods (Merchandise Trade)
This is the most traditional and visible form of trade. It includes tangible products that move across borders — raw materials, manufactured goods, consumer products, and industrial equipment.
Examples:
Crude oil exports from Saudi Arabia.
Electronics exports from South Korea and China.
Agricultural imports like wheat or soybeans by developing nations.
Subcategories:
Primary Goods: Raw materials and agricultural products.
Manufactured Goods: Industrial and consumer products like cars, electronics, and clothing.
Intermediate Goods: Components used in manufacturing final products (e.g., semiconductors).
Significance:
Trade in goods accounts for a major portion of world trade volume and reflects the industrial and resource strengths of nations.
B. Trade in Services
Unlike physical goods, service trade involves intangible offerings — consulting, tourism, IT, education, and financial services.
Examples:
India’s IT outsourcing services to U.S. companies.
Tourism in France and Thailand.
Financial services provided by London and Singapore.
Features:
Requires skilled labor and digital connectivity.
Less dependent on physical logistics.
Plays a crucial role in developed economies.
Impact:
The global services trade has grown rapidly due to digitalization, allowing even small firms to provide services internationally via the internet.
C. Capital and Financial Trading
This involves the movement of money and investments across borders. Investors buy and sell financial assets, currencies, or equity stakes in foreign companies.
Types:
Foreign Direct Investment (FDI): Long-term investment in foreign enterprises.
Foreign Portfolio Investment (FPI): Short-term investments in stocks, bonds, or securities.
Currency Trading (Forex): Exchange of global currencies for profit or hedging.
Sovereign Investments: Governments investing in global assets.
Importance:
Capital trading ensures the efficient allocation of financial resources globally, supports business expansion, and stabilizes economic growth.
D. E-commerce and Digital Trade
In the modern era, digitalization has transformed global trade. E-commerce enables businesses to sell goods and services worldwide without physical presence, while digital trade includes cross-border data, software, and online services.
Examples:
Amazon and Alibaba operating globally.
Freelance platforms like Upwork and Fiverr connecting clients and workers worldwide.
Streaming services and digital content exports.
Advantages:
Low transaction costs.
Broader market access for SMEs.
Instant payments and logistics integration.
Challenges:
Data privacy concerns.
Cybersecurity threats.
Regulatory differences across countries.
E. Commodity Trading
Commodities are basic goods used in commerce — such as metals, energy, and agricultural products. Commodity trading occurs through exchanges like the London Metal Exchange (LME) or Chicago Mercantile Exchange (CME).
Categories:
Energy Commodities: Oil, natural gas, coal.
Metals: Gold, silver, copper, aluminum.
Agricultural Commodities: Wheat, sugar, coffee, cotton.
Why It Matters:
Commodity prices influence inflation, industrial costs, and the overall stability of national economies.
F. Derivatives and Financial Instruments Trading
Global financial markets also involve trading in derivatives, which are contracts based on the value of an underlying asset (like stocks, commodities, or currencies).
Common Types:
Futures and Options
Swaps and Forwards
Index derivatives
Purpose:
Hedging against market volatility.
Speculative profits.
Portfolio diversification.
Example:
Traders in the U.S. may use futures contracts to hedge against oil price fluctuations, while investors in Japan may use currency derivatives to protect export earnings.
G. Intra-Industry and Inter-Industry Trade
Inter-Industry Trade: Exchange of goods belonging to different industries (e.g., cars for textiles).
Intra-Industry Trade: Exchange of similar goods between countries (e.g., Japan and Germany trading different car models).
Why It Happens:
Due to specialization, technology variations, and consumer preferences for diversity.
H. Fair Trade and Ethical Trading
An increasingly important type of trade focuses on ethical sourcing, ensuring fair wages, environmental sustainability, and human rights protection.
Examples:
Fair-trade coffee and cocoa.
Eco-friendly textiles.
Ethical diamond sourcing.
Impact:
Encourages sustainable economic development, especially in developing nations.
4. Benefits of Global Trading
Economic Growth: Expands GDP and income levels through exports and investments.
Job Creation: Boosts employment across sectors, from manufacturing to logistics.
Innovation: Encourages technological transfer and competitive improvement.
Consumer Benefits: Provides access to diverse products at competitive prices.
Political Stability: Strengthens international cooperation and alliances.
Efficiency: Enables countries to focus on industries where they have a comparative advantage.
5. Challenges in Global Trading
Despite its advantages, global trading faces several obstacles:
Trade Barriers: Tariffs, quotas, and sanctions limit free trade.
Currency Fluctuations: Exchange rate volatility affects profits and prices.
Supply Chain Disruptions: Events like pandemics or wars can halt global logistics.
Political Risks: Diplomatic tensions and protectionism influence global markets.
Environmental Concerns: High carbon emissions from shipping and production.
Digital Divide: Not all nations benefit equally from e-commerce and digital trade.
6. The Role of Trade Agreements and Organizations
International organizations and trade agreements play a key role in promoting fair and open trade.
Major Institutions:
World Trade Organization (WTO)
International Monetary Fund (IMF)
World Bank
OECD
Regional Trade Blocs like ASEAN, EU, and NAFTA (USMCA)
Purpose:
Standardize rules.
Resolve trade disputes.
Promote development and investment.
7. Future of Global Trading
The future of global trading is shaped by technology, sustainability, and geopolitical shifts.
Emerging Trends:
Artificial Intelligence in Trade Analytics
Blockchain for Transparent Supply Chains
Sustainable and Green Trade Policies
Rise of Regional Trade Agreements
Digital Currencies in Cross-Border Payments
As automation, AI, and digital currencies redefine global commerce, adaptability will determine which nations and businesses lead in the next generation of global trade.
8. Conclusion
Global trading is far more than an exchange of goods — it’s an intricate system of economic relationships that shapes nations’ destinies. From tangible commodities to intangible data flows, from multinational corporations to small digital entrepreneurs — every participant contributes to this dynamic global ecosystem.
Understanding the types of global trading empowers investors, policymakers, and businesses to make informed decisions, minimize risks, and seize new opportunities. As the world becomes increasingly interconnected, the essence of trade continues to evolve — emphasizing innovation, fairness, and sustainability.
In the coming decades, those who understand and adapt to these diverse forms of global trading will not just survive — they will lead the future of the global economy.
Global IPO Trends and the Rise of SME ListingsSection 1: Understanding IPOs in the Global Context
An Initial Public Offering (IPO) represents a company’s transition from private ownership to public trading on a recognized stock exchange. It allows businesses to raise funds from institutional and retail investors while providing liquidity for existing shareholders.
Over the past decade, IPO markets have evolved significantly, with technology-driven platforms, regulatory modernization, and global cross-listings simplifying the process. The increasing participation of retail investors, coupled with innovations like fractional investing, has made IPO participation more inclusive.
However, IPO performance tends to mirror global macroeconomic cycles. When markets are buoyant and investor confidence is high, IPO volumes surge. Conversely, during economic uncertainty or tightening monetary policies, new listings decline. This cyclical nature of IPOs underlines their sensitivity to interest rates, inflation, geopolitical risks, and currency fluctuations.
Section 2: The Changing Dynamics of Global IPO Markets
Between 2020 and 2025, the global IPO landscape underwent significant structural shifts:
Technology and Digitalization:
Technology firms, particularly in fintech, AI, and green tech, have led the IPO wave. Digital-first business models have attracted investors seeking growth and innovation, especially post-pandemic.
Sustainability and ESG Focus:
Environmental, Social, and Governance (ESG) principles now influence investment decisions. Companies emphasizing sustainability and ethical governance tend to receive higher valuations and investor trust during IPOs.
Regional Diversification:
While the U.S. and China remain major IPO hubs, emerging markets — especially India, Southeast Asia, and the Middle East — are seeing record IPO activity. These regions offer young demographics, digital penetration, and pro-market reforms that make them attractive IPO destinations.
Rise of Cross-Border Listings:
Globalization has encouraged companies to list in multiple markets. Dual listings in exchanges such as NASDAQ, LSE, and Hong Kong have become common for firms seeking both capital and global visibility.
Private Market Maturity:
The rise of venture capital and private equity funding means startups are staying private longer. However, once they mature, IPOs remain the ultimate exit route, offering liquidity to early investors and founders.
Section 3: SME Listings — The New Engine of Global Growth
Traditionally, IPOs were dominated by large corporations, but the past few years have witnessed a paradigm shift. Small and Medium Enterprises (SMEs) are increasingly leveraging IPOs to raise capital, particularly in emerging economies.
The SME segment forms the backbone of most economies — accounting for nearly 90% of businesses and 70% of employment globally. Despite their economic importance, SMEs often face funding constraints due to limited access to credit, high collateral demands, and lack of investor visibility. The introduction of dedicated SME boards on stock exchanges has changed this dynamic.
What Are SME Listings?
SME listings refer to the inclusion of smaller companies on specialized stock market platforms designed to accommodate their size, scale, and compliance capabilities. Examples include:
NSE Emerge and BSE SME in India
AIM (Alternative Investment Market) in the UK
TSX Venture Exchange in Canada
Catalist in Singapore
GEM Board in Hong Kong
These platforms feature simplified listing requirements, lower costs, and flexible regulatory frameworks, encouraging smaller businesses to go public.
Section 4: Why SMEs Are Choosing to Go Public
The surge in SME IPOs globally is not accidental. Several factors drive this movement:
Access to Growth Capital:
IPOs offer SMEs a cost-effective way to raise long-term funds without heavy reliance on debt. This capital supports business expansion, technology upgrades, and international market entry.
Enhanced Visibility and Credibility:
Being listed on an exchange elevates a company’s market reputation, improving its brand image and investor confidence. It also attracts strategic partnerships and new business opportunities.
Liquidity for Founders and Early Investors:
Listing enables founders and early investors to partially exit or monetize their holdings, creating a transparent valuation benchmark.
Employee Motivation:
Stock options and employee shareholding plans become attractive tools for talent retention and motivation post-listing.
Corporate Governance and Transparency:
IPO-bound SMEs adopt structured governance models, enhancing long-term sustainability and investor trust.
Section 5: Regional Spotlight – SME IPO Growth Around the World
India: A Model of SME Capitalism
India has emerged as one of the fastest-growing SME IPO markets globally. Platforms like BSE SME and NSE Emerge have listed over 500+ companies since inception, many of which graduated to the main board due to strong performance. Sectors like manufacturing, logistics, IT, and renewable energy dominate the Indian SME IPO space. The government’s Startup India and Make in India initiatives have further boosted investor participation.
United Kingdom: AIM’s Success Story
The Alternative Investment Market (AIM) in London remains one of the world’s most successful SME-focused exchanges. It provides flexibility in governance and attracts high-growth businesses from multiple geographies. AIM’s success proves that small-cap listings can thrive in a well-regulated, investor-friendly environment.
Asia-Pacific and the Middle East
Singapore’s Catalist and Hong Kong’s GEM Board have been pivotal in integrating smaller Asian enterprises into global capital markets. Meanwhile, Saudi Arabia’s Nomu platform is fostering regional SME listings as part of its Vision 2030 diversification strategy.
North America
The TSX Venture Exchange in Canada continues to be a leading platform for SME and resource-sector listings, attracting mining, energy, and tech firms. The NASDAQ First North in Europe serves similar purposes for innovative startups.
Section 6: Global Investor Appetite for SME IPOs
Investors are increasingly viewing SME IPOs as high-risk, high-reward opportunities. While large IPOs offer stability and liquidity, SME IPOs promise agility, innovation, and rapid scalability.
Institutional investors, venture funds, and family offices are diversifying their portfolios by allocating portions to SME IPOs, especially in growth markets like India, Indonesia, and Vietnam. Retail investors are also participating, aided by digital platforms, online brokerage access, and financial literacy initiatives.
However, due diligence is crucial. While some SME IPOs deliver multi-bagger returns, others may face post-listing volatility due to limited trading volumes or governance challenges. Therefore, risk management and portfolio diversification remain key.
Section 7: Challenges in the SME IPO Ecosystem
Despite impressive growth, SME listings face several obstacles:
Limited Analyst Coverage: Smaller companies often lack research visibility, making investor evaluation difficult.
Liquidity Constraints: Lower market capitalization can lead to thin trading volumes.
Regulatory Compliance Costs: Even simplified processes can be burdensome for micro-enterprises.
Investor Education Gaps: Retail investors may underestimate the risks associated with early-stage public offerings.
Addressing these challenges through regulatory support, investor awareness, and digital tools can significantly strengthen the global SME IPO ecosystem.
Section 8: The Future of Global IPO and SME Listings
Looking ahead, several trends are expected to define the future of IPOs and SME listings:
Digital IPO Platforms:
Blockchain-based and AI-enabled IPO mechanisms are simplifying subscription and allocation processes, making listings faster and more transparent.
Green and Impact IPOs:
Environmentally sustainable SMEs will dominate future IPO pipelines, aligning with global ESG priorities.
Decentralized Capital Raising:
Tokenized equity and digital securities might become alternatives to traditional IPO structures.
Global SME Integration:
Cross-border SME listings could become commonplace as global investors seek early exposure to emerging market innovation.
Government Incentives:
Many countries are now offering tax incentives and funding support for SMEs planning to go public — an encouraging sign for sustained IPO growth.
Conclusion: Democratizing Capital Through Global IPOs
The evolution of global IPO markets, coupled with the rise of SME listings, represents a fundamental shift in how businesses access capital and how investors discover value. IPOs are no longer the domain of corporate giants alone — they are becoming the growth engine for millions of SMEs worldwide.
As regulatory frameworks evolve and investor interest deepens, the democratization of finance will accelerate. From New York to Mumbai, London to Singapore, IPO platforms are empowering smaller businesses to dream bigger and compete globally.
In this new era of public offerings, innovation, transparency, and inclusivity are redefining the global capital landscape — making the IPO market not just a financial milestone but a symbol of global economic transformation.
Master Correlation StrategiesUnlocking the Power of Inter-Market Relationships in Trading.
1. Understanding Correlation in Trading
Correlation refers to the statistical relationship between two or more financial instruments — how their prices move relative to each other. It is expressed through a correlation coefficient ranging from -1 to +1.
Positive Correlation (+1): When two assets move in the same direction. For example, crude oil and energy sector stocks often rise and fall together.
Negative Correlation (-1): When two assets move in opposite directions. For instance, the U.S. dollar and gold often have an inverse relationship — when one rises, the other tends to fall.
Zero Correlation (0): Indicates no consistent relationship between two assets.
Understanding these relationships helps traders predict how one market might respond based on the movement of another, enhancing decision-making and portfolio design.
2. Why Correlation Matters
In modern financial markets, where globalization links commodities, equities, currencies, and bonds, no asset class operates in isolation. Correlation strategies allow traders to see the “bigger picture” — understanding how shifts in one area of the market ripple across others.
Some key reasons why correlation is vital include:
Risk Management: Diversification is only effective when assets are uncorrelated. If all your holdings move together, your portfolio is not truly diversified.
Predictive Analysis: Monitoring correlated assets helps anticipate price moves. For example, a rally in crude oil might foreshadow gains in oil-dependent currencies like the Canadian Dollar (CAD).
Hedging Opportunities: Traders can offset risks by holding negatively correlated assets. For instance, pairing long stock positions with short positions in an inverse ETF.
Market Confirmation: Correlations can validate or contradict signals. If gold rises while the dollar weakens, the move is more credible than when both rise together, which is rare.
3. Core Types of Correlations in Markets
a. Intermarket Correlation
This examines how different asset classes relate — such as the link between commodities, bonds, currencies, and equities. For example:
Rising interest rates typically strengthen the domestic currency but pressure stock prices.
Falling bond yields often boost equity markets.
b. Intra-market Correlation
This focuses on assets within the same category. For example:
Technology sector stocks often move together based on broader industry trends.
Gold and silver tend to share similar price patterns.
c. Cross-Asset Correlation
This involves analyzing relationships between assets of different types, such as:
Gold vs. U.S. Dollar
Crude Oil vs. Inflation Expectations
Bitcoin vs. NASDAQ Index
d. Temporal Correlation
Certain correlations shift over time. For instance, the correlation between equities and bonds may be positive during economic growth and negative during recessions.
4. Tools and Techniques to Measure Correlation
Correlation is not merely an observation—it’s a quantifiable concept. Several statistical tools help traders measure and monitor it accurately.
a. Pearson Correlation Coefficient
This is the most widely used formula to calculate linear correlation between two data sets. A reading close to +1 or -1 shows a strong relationship, while values near 0 indicate weak correlation.
b. Rolling Correlation
Markets evolve constantly, so rolling correlation (using moving windows) helps identify how relationships shift over time. For example, a 30-day rolling correlation between gold and the USD can show whether their inverse relationship is strengthening or weakening.
c. Correlation Matrices
These are tables showing the correlation coefficients between multiple assets at once. Portfolio managers use them to construct diversified portfolios and reduce overlapping exposures.
d. Software Tools
Platforms like Bloomberg Terminal, TradingView, MetaTrader, and Python-based tools (like pandas and NumPy libraries) allow traders to calculate and visualize correlation efficiently.
5. Applying Correlation Strategies in Trading
a. Pair Trading
Pair trading is a market-neutral strategy that exploits temporary deviations between two historically correlated assets.
Example:
If Coca-Cola and Pepsi usually move together, but Pepsi lags temporarily, traders may go long Pepsi and short Coca-Cola, betting the relationship will revert.
b. Hedging with Negative Correlations
Traders can use negatively correlated instruments to offset risk. For instance:
Long positions in the stock market can be hedged by taking positions in safe-haven assets like gold or the Japanese Yen.
c. Sector Rotation and ETF Strategies
Investors track sector correlations with broader indices to identify leading and lagging sectors.
For example:
If financial stocks start outperforming the S&P 500, this could signal a shift in the economic cycle.
d. Currency and Commodity Correlations
Currencies are deeply linked to commodities:
The Canadian Dollar (CAD) often correlates positively with crude oil prices.
The Australian Dollar (AUD) correlates with gold and iron ore prices.
The Swiss Franc (CHF) is often inversely correlated with global risk sentiment, acting as a safe haven.
Traders can exploit these relationships for cross-market opportunities.
6. Case Studies of Correlation in Action
a. Gold and the U.S. Dollar
Gold is priced in dollars; therefore, when the USD strengthens, gold usually weakens as it becomes more expensive for other currency holders.
During 2020’s pandemic uncertainty, both assets briefly rose together — a rare situation showing correlation can shift temporarily under stress.
b. Oil Prices and Inflation
Oil serves as a barometer for inflation expectations. When crude prices rise, inflation fears grow, prompting central banks to tighten policies.
Traders who monitor this relationship can anticipate policy shifts and market reactions.
c. Bitcoin and Tech Stocks
In recent years, Bitcoin has shown increasing correlation with high-growth technology stocks. This suggests that cryptocurrency markets are influenced by risk sentiment similar to the equity market.
7. Benefits of Mastering Correlation Strategies
Enhanced Market Insight: Understanding inter-market dynamics reveals the underlying forces driving price movements.
Stronger Portfolio Construction: Diversify effectively by choosing assets that truly offset one another.
Smarter Risk Control: Correlation analysis highlights hidden exposures across asset classes.
Improved Trade Timing: Correlation signals help confirm or challenge technical and fundamental setups.
Global Perspective: By studying correlations, traders gain insight into how global events ripple through interconnected markets.
8. Challenges and Limitations
Despite its power, correlation analysis is not foolproof. Traders must be aware of its limitations:
Changing Relationships: Correlations evolve over time due to policy changes, crises, or shifting investor sentiment.
False Correlation: Sometimes two assets appear correlated by coincidence without a fundamental link.
Lag Effect: Correlation may not capture time delays between cause and effect across markets.
Overreliance: Correlation is one tool among many; combining it with technical, fundamental, and sentiment analysis produces more reliable outcomes.
9. Advanced Correlation Techniques
a. Cointegration
While correlation measures relationships at a moment in time, cointegration identifies long-term equilibrium relationships between two non-stationary price series.
For example, even if short-term correlation fluctuates, two assets can remain cointegrated over the long run — useful in statistical arbitrage.
b. Partial Correlation
This method isolates the relationship between two variables while controlling for others. It’s particularly helpful in complex portfolios involving multiple correlated instruments.
c. Dynamic Conditional Correlation (DCC) Models
These advanced econometric models (used in quantitative finance) measure time-varying correlations — essential for modern algorithmic trading systems.
10. Building a Correlation-Based Trading System
A professional correlation strategy can be structured as follows:
Data Collection: Gather historical price data for multiple assets.
Statistical Analysis: Calculate correlations and rolling relationships using software tools.
Strategy Design: Develop pair trades, hedges, or intermarket signals based on correlation thresholds.
Backtesting: Validate the system across different market phases to ensure robustness.
Execution and Monitoring: Continuously update correlation data and adjust positions as relationships evolve.
Risk Control: Implement stop-loss rules and diversification limits to prevent overexposure to correlated positions.
11. The Future of Correlation Strategies
In an era of high-frequency trading, AI-driven analytics, and global macro interconnectedness, correlation strategies are evolving rapidly. Machine learning models now identify non-linear and hidden correlations that traditional statistics might miss.
Furthermore, as markets integrate further — with crypto, ESG assets, and alternative data sources entering the scene — understanding these new correlations will be crucial for maintaining an edge in trading.
12. Final Thoughts
Mastering correlation strategies isn’t just about mathematics — it’s about understanding the language of global markets. Every movement in commodities, currencies, and indices tells a story about how capital flows across the world.
A trader who comprehends these relationships gains not only analytical power but also strategic foresight. By mastering correlation analysis, you move beyond isolated price charts and see the interconnected web that drives the global financial ecosystem.
In essence, correlation strategies are the bridge between micro-level technical trades and macro-level economic understanding. Those who can navigate this bridge with confidence stand at the forefront of modern trading excellence — armed with knowledge, precision, and an unshakable sense of market direction.
Global Trading News: No More Noise1. The Problem: Too Much Noise, Too Little Clarity
In the age of digital speed, financial information travels faster than ever before. Every second, thousands of updates pour in from stock exchanges, economic data feeds, and social media platforms. While access to this information is crucial, the real challenge is filtering signal from noise.
For traders and investors, the consequences of acting on misleading or incomplete data can be severe—ranging from missed opportunities to significant financial losses. Many find themselves reacting emotionally to market movements rather than making rational, data-driven decisions.
Here’s the reality of modern trading news:
Information overload: The average trader consumes 10x more data today than they did a decade ago.
Unverified sources: Social platforms and influencer-driven “news” often spread unconfirmed rumors.
Delayed reactions: By the time mainstream media reports an event, the market has often already moved.
Conflicting analysis: Multiple experts giving contradictory opinions can paralyze decision-making.
This environment creates a noise-heavy ecosystem, where clarity is lost and focus diluted. That’s why the future of global trading depends not just on access to data—but on access to refined, verified, and context-driven insights.
2. The Concept: No More Noise – Only Insight
“Global Trading News: No More Noise” is more than a headline—it’s a mindset shift. It’s about transforming how traders receive and process global market updates. Instead of drowning in endless feeds, this approach focuses on precision, context, and credibility.
a. Filtered Information Flow
Instead of providing every minor update, this system curates only market-moving news—those that have a proven impact on price action or sentiment. Macro-economic indicators, central bank decisions, corporate earnings, geopolitical shifts, and commodity trends are prioritized.
b. Data-Driven Analysis
News without numbers is just noise. Each report is paired with relevant data visualization—charts, volume trends, volatility indexes, and correlation patterns—so traders can instantly see the real market effect behind the headline.
c. AI-Powered News Screening
Using intelligent algorithms, irrelevant or repetitive information is filtered out. The AI recognizes patterns of manipulation, misinformation, or algorithmic pumping stories, keeping the feed credible and clean.
d. Real-Time Global Coverage
From New York to Tokyo, from London to Mumbai—the platform ensures 24/7 coverage of major exchanges, currencies, bonds, commodities, and crypto markets. But unlike traditional platforms, the content is localized yet globalized—tailored to highlight how a move in one market impacts another.
3. The Mission: Empower the Modern Trader
At the core of “Global Trading News: No More Noise” lies a simple mission—to empower every trader and investor with information that matters. In financial markets, clarity equals confidence, and confidence leads to smarter, faster decisions.
Key Objectives:
Simplify complexity: Break down macroeconomic data into clear trading insights.
Enhance focus: Remove distractions and highlight what truly moves markets.
Increase speed: Provide verified insights in real-time for instant action.
Build trust: Ensure every piece of information is credible, sourced, and traceable.
Whether you’re a day trader chasing volatility, a swing trader identifying trends, or an institutional investor managing global portfolios, the goal is the same—make decisions based on facts, not fear or noise.
4. The Framework: How “No More Noise” Works
The global financial world can be divided into multiple verticals—equities, currencies, commodities, bonds, and digital assets. Each responds differently to macro events. The “No More Noise” system organizes news through a five-layer structure designed for clarity and precision.
Layer 1: Macro Alerts
Tracks and analyzes central bank policies, inflation data, GDP numbers, and geopolitical shifts. Example: “Federal Reserve holds rates steady amid inflation uncertainty—market expects pivot by Q1.”
Layer 2: Market Movers
Covers stocks, commodities, and currency pairs that show significant volume spikes or trend reversals due to fundamental news or institutional activity.
Layer 3: Sector Insights
Focuses on industries driving momentum—tech, energy, metals, banking, and pharmaceuticals—linking global developments to sectoral performance.
Layer 4: Quant & Sentiment Tools
Integrates market sentiment analysis, correlation tracking, and volatility forecasting to help traders validate the emotional tone behind the news.
Layer 5: Strategic Analysis
Provides commentary from credible financial analysts and economists—offering deeper interpretations rather than just surface-level reporting.
5. The Impact: Transforming Trading Behavior
When traders are freed from noise, their behavior changes dramatically:
Reduced overtrading: Decisions become data-backed instead of emotional.
Improved accuracy: Clearer insights lead to better entry and exit timing.
Enhanced portfolio management: Macro and micro factors are balanced effectively.
Stronger confidence: Traders operate with purpose, not panic.
Moreover, by prioritizing quality over quantity, traders save time—turning market monitoring into a strategic edge rather than a distraction.
6. Global Connectivity, Local Relevance
What makes global trading unique today is interconnectivity. A bond yield movement in the U.S. can impact Asian equities; a commodity rally in London can influence Indian inflation data. “Global Trading News: No More Noise” focuses on showing these interlinkages in real-time, allowing traders to:
Understand global cause-and-effect relationships.
Anticipate market reactions before they happen.
Diversify their trading strategies across regions and asset classes.
This creates a borderless trading mindset, where every event—no matter where it originates—is understood through a global lens.
7. The Future: Intelligent, Calm, and Data-Driven Markets
As artificial intelligence, blockchain data feeds, and quantum computing evolve, the future of trading will rely on smart filtering systems. The age of raw information is ending—the age of interpreted intelligence is beginning.
The traders who adapt to this evolution will thrive, not by consuming more, but by understanding better.
“Global Trading News: No More Noise” represents this shift—towards mindful trading, where every click, trade, and reaction is intentional and informed.
In this future, financial media platforms will no longer compete on who delivers the news first—but on who delivers it right. The market will reward depth over drama, insight over intensity, and facts over frenzy.
8. Why This Matters Now
In volatile times—whether it’s global inflation, war tensions, or digital currency disruption—the margin for error in trading decisions is smaller than ever. Every second counts, and every false signal costs. That’s why news quality has become the new competitive advantage.
“Global Trading News: No More Noise” isn’t just a tagline—it’s a philosophy for the next generation of market thinkers who value truth, timing, and transparency over hype.
Conclusion: The New Era of Trading Clarity
The global market doesn’t need more information—it needs better information.
In an age where every second brings a new headline, clarity is the ultimate trading edge.
“Global Trading News: No More Noise” is a commitment to restore that edge—to make traders think smarter, act faster, and trade with conviction. It’s where insight replaces speculation, and where news becomes a tool for empowerment, not confusion.
In this silent revolution of clarity, the markets may still be loud—but the trader will remain calm, focused, and informed.
Because when there’s no more noise, there’s nothing left but the truth—and in trading, truth is power.

Currency Convertibility Issues in the Global MarketIntroduction
Currency convertibility is one of the fundamental pillars of the global financial system. It determines how freely a nation’s currency can be exchanged for foreign currencies, influencing trade, investment, and international economic stability. In a world increasingly interconnected through globalization, the concept of currency convertibility is central to understanding how nations engage in global commerce and finance. However, the issue of currency convertibility is complex and often tied to a country’s monetary policy, balance of payments, capital control measures, and overall economic health.
This essay explores the concept of currency convertibility in the global market, its types, significance, challenges, and the major issues that affect countries’ decisions to make their currencies fully convertible. It also examines case studies of economies that have struggled or succeeded with convertibility and provides an outlook on how currency convertibility impacts the global financial ecosystem.
1. Meaning of Currency Convertibility
Currency convertibility refers to the ease with which a country’s currency can be converted into another currency or gold. It represents the degree of freedom that individuals, businesses, and investors have in exchanging domestic currency for foreign currencies for trade, investment, or travel purposes.
Essentially, convertibility is an indicator of how open an economy is to international financial flows. When a currency is fully convertible, it can be freely exchanged without restrictions for any purpose. When it is partially convertible, certain limitations exist—usually to control capital outflow or to stabilize the domestic economy.
2. Types of Currency Convertibility
Currency convertibility is generally categorized into two main types:
a. Current Account Convertibility
This allows the exchange of domestic currency for foreign currency for trade in goods and services, interest payments, and remittances. It ensures smooth international trade and reflects a country’s openness to global commerce.
Most nations, including India, have achieved current account convertibility. This means residents can pay for imports or receive export payments in foreign currencies freely.
b. Capital Account Convertibility
This involves the freedom to convert domestic financial assets into foreign assets and vice versa. It allows unrestricted movement of capital across borders—such as investment in foreign stocks, bonds, real estate, or repatriation of profits.
While this form of convertibility attracts foreign direct investment (FDI) and portfolio flows, it can also expose the domestic economy to external shocks and speculative capital movements.
3. Importance of Currency Convertibility in the Global Market
Currency convertibility plays a vital role in integrating national economies into the global system. Its importance can be highlighted through several key dimensions:
Facilitating International Trade:
Convertibility enables smooth cross-border transactions, reducing transaction costs and delays. Exporters and importers can easily settle payments in international currencies like the US dollar or euro.
Encouraging Foreign Investment:
Foreign investors prefer investing in economies where they can easily convert their earnings into other currencies. Full convertibility signals economic openness and financial maturity.
Enhancing Market Confidence:
A convertible currency reflects the stability and credibility of a nation’s monetary policy. It builds confidence among traders, investors, and international partners.
Improving Resource Allocation:
When funds can flow freely across borders, resources are allocated more efficiently, and economies can tap into global capital pools.
Promoting Globalization:
Convertibility supports global integration, allowing citizens and companies to participate more actively in the international economy.
4. Challenges and Risks of Currency Convertibility
While currency convertibility brings several advantages, it also presents significant challenges and risks, especially for developing economies.
a. Exchange Rate Volatility
Full convertibility can expose a nation’s currency to global market fluctuations. Speculative attacks and sudden changes in capital flows can destabilize the exchange rate, leading to inflationary pressures or currency depreciation.
b. Capital Flight
When investors lose confidence in a country’s economy, unrestricted capital convertibility can lead to massive capital outflows. This can drain foreign exchange reserves and weaken the domestic currency.
c. Loss of Monetary Control
With full capital account convertibility, central banks may find it difficult to manage monetary policy effectively, as large inflows and outflows can disrupt domestic liquidity and interest rates.
d. External Shocks
Global crises, such as the 2008 financial meltdown, highlight how interconnected financial markets can transmit risks rapidly. Countries with fully convertible currencies may face contagion effects more severely.
e. Inflation and Economic Instability
Sudden currency depreciation due to speculative pressures can raise import costs, leading to inflation and economic instability, particularly in countries dependent on imports for essential goods.
5. Case Studies: Global Experiences with Currency Convertibility
a. India
India has achieved current account convertibility since 1994 but still maintains partial capital account convertibility. The Reserve Bank of India (RBI) exercises control over capital flows to prevent volatility and speculative attacks. The cautious approach helped India withstand crises such as the Asian Financial Crisis (1997) and the Global Financial Crisis (2008).
b. China
China’s yuan (CNY) has been gradually moving toward greater convertibility. While trade-related transactions are largely convertible, capital account restrictions remain. China maintains tight control over capital flows to manage its exchange rate and protect economic stability.
c. Argentina
Argentina’s experience serves as a cautionary tale. In the 1990s, it adopted full convertibility by pegging its currency to the US dollar. While initially stabilizing inflation, it later led to economic collapse due to inflexible policies, capital flight, and loss of competitiveness.
d. Developed Economies (U.S., U.K., Eurozone)
Fully convertible currencies like the US Dollar, Euro, and British Pound dominate global trade and finance. Their stable economies, robust institutions, and deep financial markets enable them to sustain full convertibility with minimal disruption.
6. The Role of International Institutions
International organizations like the International Monetary Fund (IMF) and the World Bank play crucial roles in guiding countries toward managed currency convertibility.
The IMF’s Article VIII encourages member nations to remove restrictions on current account transactions but advises caution regarding capital account liberalization. It promotes gradual, sequenced reforms to avoid destabilizing the economy.
7. Factors Influencing a Country’s Currency Convertibility Decision
A nation’s decision to move toward full convertibility depends on several economic and political factors:
Macroeconomic Stability:
Low inflation, sustainable fiscal deficits, and stable growth are prerequisites for safe convertibility.
Foreign Exchange Reserves:
Adequate reserves ensure that the country can handle fluctuations in capital flows.
Financial Market Depth:
Developed financial markets can absorb capital movements efficiently without destabilizing the economy.
Exchange Rate Regime:
Flexible exchange rate systems are generally better suited for managing convertibility risks.
Institutional Strength and Governance:
Transparent regulatory systems and strong institutions reduce corruption and speculative behavior.
8. The Debate: Full vs. Partial Convertibility
Economists often debate whether developing nations should pursue full convertibility.
Proponents argue that it boosts foreign investment, promotes efficiency, and integrates the economy globally.
Critics warn that premature convertibility can expose the economy to crises, as seen in Latin America and Southeast Asia during the late 20th century.
The consensus among policymakers today is that gradual liberalization, backed by strong macroeconomic fundamentals, is the safest path.
9. The Future of Currency Convertibility in the Global Market
As the world moves toward digital currencies, blockchain, and fintech innovations, the landscape of currency convertibility is rapidly evolving. Central Bank Digital Currencies (CBDCs), for instance, could simplify cross-border transactions and make convertibility more efficient and transparent.
Moreover, the rise of the Chinese yuan and the decline of dollar dominance could reshape how currencies are exchanged globally. Emerging markets are also exploring regional payment systems and currency swap agreements to reduce dependency on traditional reserve currencies.
However, the fundamental challenge remains the same: balancing openness with stability. Policymakers must ensure that liberalization does not come at the cost of economic security.
10. Conclusion
Currency convertibility is a cornerstone of international economic integration, enabling trade, investment, and global cooperation. Yet, it remains a double-edged sword. While full convertibility symbolizes economic maturity and confidence, it also requires strong institutions, sound fiscal management, and robust financial systems.
For developing economies, the path toward full convertibility must be gradual, strategic, and supported by macroeconomic stability. India, China, and several other emerging markets demonstrate that measured liberalization, rather than abrupt openness, provides the best results.
In the evolving global financial landscape—marked by digital transformation, shifting geopolitical alliances, and economic uncertainty—understanding and managing the issues surrounding currency convertibility will continue to be a defining factor in shaping the world’s economic future.

U.S. Federal Reserve Policy and Interest RatesThe Backbone of Global Economic Stability.
Introduction
The United States Federal Reserve (commonly known as the Fed) stands as one of the most influential institutions in the global financial system. Its policies, particularly regarding interest rates, have far-reaching consequences — not only for the U.S. economy but also for financial markets, currencies, trade flows, and economic stability across the world. The Fed’s ability to adjust interest rates and implement monetary policies allows it to control inflation, influence employment levels, and stabilize economic growth.
In this essay, we will explore in detail the evolution, mechanisms, tools, and impacts of the Federal Reserve’s policy decisions, with a special focus on interest rates — their role, rationale, and implications for both domestic and international economies.
1. The Role and Structure of the U.S. Federal Reserve
The Federal Reserve System was established in 1913 through the Federal Reserve Act, in response to recurring financial panics and instability in the U.S. banking system. Its primary mission is to promote a stable monetary and financial environment.
The Fed operates through three key entities:
The Board of Governors – Located in Washington, D.C., consisting of seven members appointed by the President and confirmed by the Senate.
Twelve Regional Federal Reserve Banks – These regional banks represent different districts and carry out the Fed’s policies locally.
The Federal Open Market Committee (FOMC) – Comprising the Board of Governors and five Reserve Bank presidents, this committee is the primary decision-making body for setting interest rates and implementing monetary policy.
The Fed’s dual mandate is to achieve:
Maximum employment, and
Stable prices (low and predictable inflation).
In addition, the Fed seeks to moderate long-term interest rates and maintain the stability of the financial system.
2. The Tools of Federal Reserve Monetary Policy
To achieve its goals, the Federal Reserve uses several key tools:
a. Open Market Operations (OMO)
This is the primary tool for controlling short-term interest rates. The Fed buys or sells government securities (like U.S. Treasury bonds) in the open market.
Buying securities increases money supply, lowers interest rates, and stimulates economic activity.
Selling securities decreases money supply, raises interest rates, and curbs inflationary pressure.
b. The Discount Rate
This is the interest rate the Fed charges commercial banks for short-term loans through its discount window. Lowering this rate encourages banks to borrow more and lend to businesses and consumers, while increasing it discourages lending and cools the economy.
c. Reserve Requirements
This refers to the percentage of deposits that banks must hold as reserves. Lowering reserve requirements increases available funds for lending, boosting liquidity and credit growth. Raising them does the opposite, restricting credit.
d. Interest on Reserve Balances (IORB)
The Fed pays interest on reserves that banks hold at the central bank. Adjusting this rate influences how much banks lend versus how much they keep in reserves, indirectly impacting money supply.
e. Quantitative Easing (QE) and Tightening (QT)
In extraordinary circumstances, such as the 2008 financial crisis or the 2020 pandemic, the Fed uses QE to purchase long-term securities, injecting liquidity into the economy. Conversely, Quantitative Tightening (QT) involves selling assets or allowing them to mature to reduce liquidity and combat inflation.
3. Interest Rate Policy: The Core of Monetary Control
Interest rates lie at the heart of the Federal Reserve’s monetary policy. The Federal Funds Rate — the rate at which banks lend reserves to each other overnight — is the most critical benchmark.
When the Fed changes the target range for this rate, it indirectly affects:
Consumer borrowing costs (credit cards, mortgages, auto loans),
Business investment decisions,
Government borrowing costs, and
The valuation of financial assets globally.
a. When the Fed Raises Interest Rates
Inflation Control: Higher rates make borrowing more expensive, slowing spending and investment, thereby cooling inflation.
Currency Appreciation: The U.S. dollar strengthens as higher rates attract foreign investors seeking better returns.
Stock Market Impact: Equity prices often fall due to higher discount rates and reduced profit expectations.
Global Ripples: Emerging markets may face capital outflows as investors shift to U.S. assets.
b. When the Fed Lowers Interest Rates
Stimulating Growth: Cheaper credit encourages consumption, business expansion, and investment.
Weakening of Dollar: A lower yield reduces demand for the U.S. dollar, making exports more competitive.
Boost to Financial Markets: Lower discount rates increase asset valuations, benefiting equity and bond markets.
Support During Crises: Rate cuts are often used during recessions to stimulate economic recovery.
4. Historical Perspective: Major Fed Rate Cycles
a. The Volcker Era (Late 1970s–1980s)
Inflation had surged due to oil shocks and loose monetary policy. Chairman Paul Volcker implemented drastic rate hikes, pushing the federal funds rate above 20% in 1981. This aggressive stance broke the back of inflation but triggered a short-term recession.
b. The Greenspan Era (1987–2006)
Under Alan Greenspan, the Fed emphasized gradualism and market-friendly communication. It managed crises like the 1987 stock market crash, the dot-com bubble, and early 2000s recessions through strategic rate adjustments.
c. The Bernanke and Yellen Years (2006–2018)
The 2008 Global Financial Crisis marked a shift to unconventional tools. The Fed slashed rates to near zero and launched Quantitative Easing to revive the economy. Later, under Janet Yellen, gradual normalization began.
d. The Powell Era (2018–Present)
Jerome Powell has faced extraordinary challenges: trade tensions, the COVID-19 pandemic, and post-pandemic inflation. After slashing rates to zero in 2020, the Fed initiated its most aggressive tightening cycle in decades starting in 2022 to combat inflation exceeding 9%, raising rates to over 5% by 2023.
5. Impact of Fed Interest Rate Decisions on the U.S. Economy
a. Inflation Control
Rising rates slow consumer and corporate spending, helping control inflation by cooling demand. Conversely, rate cuts stimulate demand and can raise inflation expectations.
b. Employment and Wages
As borrowing costs rise, companies may delay hiring or expansion. High rates can increase unemployment in the short run, but the Fed’s goal is to maintain long-term price stability, which supports sustainable employment.
c. Housing Market
Mortgage rates move closely with the Fed’s actions. A rate hike can significantly slow housing demand, reduce affordability, and depress home prices.
d. Business Investment
When borrowing becomes costly, companies cut capital expenditure. Sectors such as manufacturing, technology, and real estate often feel the strongest impact.
e. Consumer Behavior
Interest rate changes directly affect credit cards, auto loans, and savings yields, influencing household spending patterns and savings rates.
6. Global Implications of U.S. Interest Rate Policy
The Federal Reserve’s decisions ripple through the global economy because the U.S. dollar is the world’s dominant reserve currency.
a. Capital Flows
When U.S. rates rise, capital often flows from emerging markets to the U.S. in search of higher returns. This can weaken developing economies’ currencies and strain their debt servicing.
b. Exchange Rate Volatility
Higher U.S. yields strengthen the dollar, making imports cheaper but hurting exports. For other countries, a strong dollar raises the cost of dollar-denominated debt.
c. Commodity Prices
Commodities like oil and gold are priced in dollars. A stronger dollar typically depresses commodity prices, affecting global trade balances.
d. Global Stock Markets
U.S. rate hikes often lead to a decline in global equity valuations as risk-free yields become more attractive compared to stocks.
7. Challenges in Monetary Policy Implementation
Despite its tools and experience, the Fed faces several challenges:
a. Balancing Inflation and Growth
The dual mandate creates trade-offs. Tightening to control inflation may harm employment, while loosening to support jobs risks fueling inflation.
b. Time Lags
Monetary policy operates with delays — it can take months for rate changes to influence inflation, employment, and GDP.
c. Global Linkages
The interconnected global economy means domestic policy changes can trigger unintended international consequences, such as currency depreciation or capital flight in other nations.
d. Market Expectations
The Fed’s credibility and communication are vital. Miscommunication or unexpected decisions can cause financial volatility.
8. The Role of Forward Guidance and Communication
In modern monetary policy, communication is as powerful as action. Through forward guidance, the Fed provides information about its future policy intentions to shape market expectations.
For instance, during periods of uncertainty, clear communication can stabilize bond markets and prevent panic. Conversely, unexpected policy shifts — often referred to as “Fed shocks” — can cause sharp asset price movements.
9. The Future of Fed Policy and Interest Rates
The future of Federal Reserve policy will likely be shaped by new economic realities:
Digital Currency and Technology: The rise of digital payments and discussions on a Central Bank Digital Currency (CBDC) could redefine how monetary policy is transmitted.
Climate Risk and Sustainability: The Fed is beginning to factor climate-related risks into its analysis, recognizing their long-term economic impact.
Geopolitical Uncertainty: Global tensions, trade wars, and supply chain disruptions can complicate inflation dynamics and policy effectiveness.
Data-Driven Policy: The increasing use of real-time data and AI-driven forecasting tools will make policy more responsive and precise.
In coming years, the Fed must navigate between promoting growth and preventing inflation resurgence — a balancing act made harder by evolving global economic dynamics.
Conclusion
The U.S. Federal Reserve’s policy and interest rate decisions lie at the center of global economic stability. Through meticulous management of the federal funds rate and other instruments, the Fed influences inflation, employment, and investment patterns across the world.
While its actions are designed primarily for the U.S. economy, the ripple effects extend to every major financial center and emerging market. In an era of globalization, digital transformation, and persistent uncertainty, the Fed’s challenge is to maintain credibility, transparency, and flexibility.
Ultimately, effective Federal Reserve policy ensures not only the health of the American economy but also the broader balance of the global financial system — a responsibility that underscores its position as one of the most powerful economic institutions in the world.

Back to Basics: How to Calculate Pips on Forex Pairs📌 Back to Basics: How to Calculate Pips on Forex Pairs 💱📊
Every Forex trader needs to understand pips—it’s the foundation of measuring movement in currency pairs.
✅ On most pairs, 1 pip = the 4th decimal place (0.0001).
✅ On JPY pairs, 1 pip = the 2nd decimal place (0.01).
In this quick video, I’ll break down exactly how to find the pip, how to count them, and how to use them when setting your entry and take-profit (TP) levels.
Perfect for beginners or anyone who wants a simple refresher!
✨ Trading made simple.
👉 Watch now and build your Forex foundation the right way.
⚠️ Disclaimer: This video is for educational purposes only and should not be considered financial advice. Trading carries risk, and you should only trade with money you can afford to lose. Always do your own research before making any trading decisions.

Back to Basics: How to Calculate Entry & TP on Gold (Forex)📌 Back to Basics: How to Calculate Entry & TP on Gold 🥇📈
Gold doesn’t move in pips like Forex pairs—it moves in points.
✅ 1 Point = 10 Pips
In this quick video, I’ll show you a simple way to calculate your entry and take-profit (TP) when trading Gold. No stress, no confusion—just add or subtract points from your entry price to set your TP with confidence.
Perfect for beginners and traders who want a refresher on the basics!
✨ Trading made simple.
👉 Watch now and level up your Gold trading game.
⚠️ Disclaimer: This video is for educational purposes only and should not be considered financial advice. Trading carries risk, and you should only trade with money you can afford to lose. Always do your own research before making any trading decisions.

Why Most Traders Blow Their Accounts?
It’s not bad strategy; it’s bad risk.
Most traders break before their accounts do. They revenge trade, double down, or skip stops because they can’t stand being wrong.
Here’s the truth: Discipline beats setups every time in my perspective.
Try this today →
Risk 0.5% per trade for one week.
If you can’t follow that rule, it’s not the market that’s broken; it’s your system of control.
I’ve been testing something that helps traders stay inside their limits when emotions spike.
Want me to share how it works?
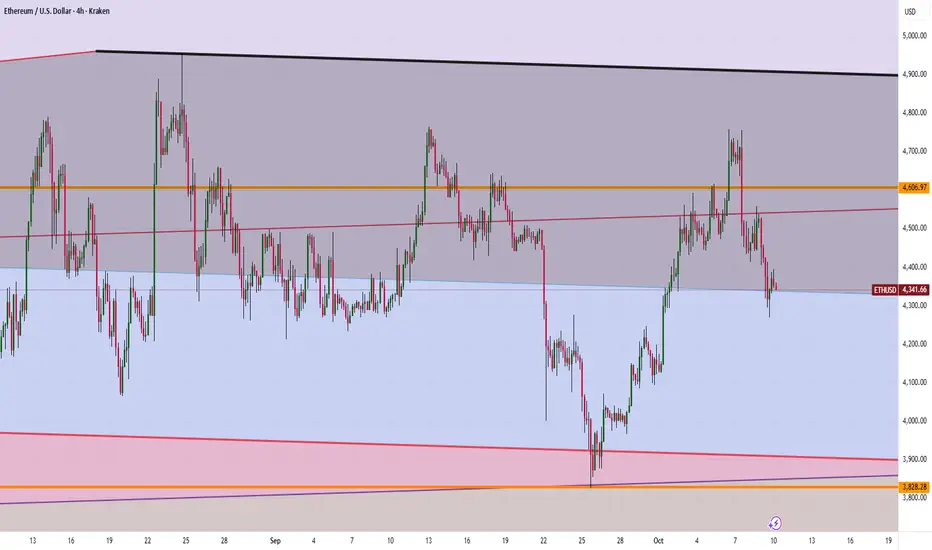
Why 90% of Funded Traders Blow Up 🔥 Why 90% of Funded Traders Blow Up
The Problem:
They stop trading their edge and start trading their fear.
Profit targets and drawdown limits hijack discipline faster than bad setups ever will.
I’ve been testing ways to flip that pattern
Would it help if I shared what’s actually working?

3 Lessons for Successful Trading🧠 3 Lessons for Successful Trading
(Fewer Trades – More Control)
📘 Lesson 1 – Less Is More
Counterintuitive, right?
But most traders fail not because they do too little —
but because they do too much:
Too many trades
Too much analysis
Too much overthinking
📉 No high-probability setup? → No trade.
That’s not stagnation — that’s discipline.
Patience isn’t a weakness –
it’s one of the greatest edges in trading.
True professionals don’t gamble.
They wait for clarity.
📘 Lesson 2 – Accept Uncertainty
The market isn’t a machine.
It’s a living organism built from emotion, liquidity, and expectations.
You’ll never know everything.
Accept that you can only be probably right, never certain.
That’s why risk management is your superpower.
You don’t need your capital for difficult trades –
you need it for clear opportunities when they appear.
“Don’t shoot at bad targets
when better ones are coming.”
📘 Lesson 3 – Set Clear Goals & Stay Focused
Trading is a process, not a lottery.
Set realistic goals – and stick to them.
Structure:
1️⃣ Backtesting
2️⃣ Demo Trading
3️⃣ Live Execution
There are no shortcuts.
Profits and losses come in cycles.
Not every loss is a mistake –
but every emotional reaction to a loss is.
If you lack discipline in demo,
you won’t find it in live trading.
🎯 Final Thoughts
Markets change –
but the rules of the game remain the same:
🧘 Patience
📊 Clarity
🛡 Risk Management
🧭 Focus
Don’t just trade. Think. Wait. Execute.
💬 Share in the comments
which lesson resonates with you the most –
or what you’re currently working on improving.
🔁 Repost for traders who still jump on every setup.
EDUCATION: US500 +2R FOH SET, WALL STREET ORB SETUPHere’s a quick recap of today’s trade on the US500 — just shy of 2R on day 3 of a 3-day cycle, trading the Wall Street session:
I identified a 2-star quality Opening Range Breakout setup with clear confluence: trapped traders working the highs of the week, failing within a broadening formation, providing a short opportunity targeting yesterday’s Value Area and Point of Control (Target 1) and last week’s Value Area High (Target 2).
A clean “nail and bail, one and done” execution.
If this resonates with you — let’s connect. I’d love to hear from you.

LINE CHART Sometimes the best way to draw zones and trendlines is to use the line chart because it gives clear pionts
Watch how the zones and trendlines match
You can also draw your zones on your chartthen switch to line chart 💯

Overtrading: Understand Now to Avoid Mistakes!Hey everyone! 👋
I know that in the world of trading, it’s easy to let emotions take over, especially after a losing streak. Overtrading is one of those invisible enemies that you need to identify and avoid as soon as possible.
1 | What is Overtrading? 💡
Overtrading happens when you take too many trades, usually driven by emotions, especially when you feel the need to "recover" losses from a losing streak. At this point, your decisions are no longer based on technical analysis or your strategy; instead, they are impulsive reactions that lead you to take on more risk.
2 | Psychological and Financial Consequences 😞
Psychological:
When overtrading, you start to feel stressed, exhausted, and lose mental clarity for decision-making. Feelings of disappointment creep in, and gradually, you lose confidence and patience, leaving space only for anxiety.
Financial:
Overtrading also quickly drains your account. Increased transaction fees, prolonged losses, and lack of discipline wear down your capital. Over time, you could lose trust in yourself and compromise your financial stability.
3 | How to Protect Yourself? 💪
To avoid overtrading, the key is having a strict trading plan. Limit the number of trades you take each day, set specific trading hours, and establish clear objectives. Learning patience is crucial — sometimes, the best move is not to trade at all!
Remember: When you have a clear plan and stick to your discipline, you’ll be able to control your emotions and avoid impulsive decisions.
Wishing you all successful and smart trading! 💥
If you found this article helpful, don’t forget to share it and leave your thoughts in the comments. Let’s keep learning and growing together every day! 🙌
Don’t let emotions control you. Let reason guide your trading!
What's RSI indicating about GOLDRSI on Gold's MONTHLY chart hits a whopping 91.3, testing a historic "overbought" level on record, never touched since the 1980s.
Not even in 2001, 2008, or 2020

The Role of Central Bank Policies in the Global MarketIntroduction
Central banks serve as the backbone of every modern economy. Their primary objectives include maintaining monetary stability, controlling inflation, ensuring sustainable growth, and safeguarding the financial system. However, in an increasingly globalized world, central bank policies have far-reaching implications that extend beyond national borders. The global market—characterized by interconnected trade, capital flows, and investment—responds sharply to policy decisions made by major central banks such as the U.S. Federal Reserve (Fed), the European Central Bank (ECB), the Bank of Japan (BOJ), and others.
In the 21st century, as economies became more interdependent, the influence of central banks grew exponentially. Their monetary policies—ranging from interest rate adjustments to quantitative easing (QE), exchange rate interventions, and forward guidance—shape everything from currency valuations to commodity prices, stock market performance, and capital movement across borders. This essay explores the role, objectives, instruments, and global impacts of central bank policies, emphasizing how these policies shape the dynamics of the world market.
1. Understanding Central Banking
A central bank is a national financial institution responsible for regulating the supply of money and credit in the economy. It acts as the lender of last resort, ensures financial stability, and supports economic policy through various tools. Examples include the Federal Reserve (U.S.), European Central Bank (EU), Bank of England (UK), Bank of Japan, Reserve Bank of India, and People’s Bank of China (PBOC).
Central banks typically have two primary objectives:
Price Stability – Controlling inflation and preventing deflation.
Economic Stability – Promoting growth, employment, and financial resilience.
Beyond these goals, central banks also manage foreign reserves, stabilize currency values, and regulate the banking system to avoid crises.
2. Key Monetary Policy Tools
Central banks use several tools to influence the economy:
a) Interest Rate Policy
The most fundamental tool is the manipulation of the policy interest rate—such as the Federal Funds Rate (Fed), the Repo Rate (RBI), or the Refinancing Rate (ECB). Lowering interest rates makes borrowing cheaper, encouraging businesses and consumers to spend and invest. Conversely, raising rates curbs excessive spending and inflation.
Interest rate decisions affect global financial markets instantly. For example, a Fed rate hike can strengthen the U.S. dollar, weaken emerging market currencies, and cause capital outflows from developing nations.
b) Open Market Operations (OMO)
These involve the buying and selling of government securities to regulate liquidity in the banking system. When central banks buy securities, they inject liquidity; when they sell, they withdraw liquidity. OMOs are crucial for maintaining short-term interest rate targets and ensuring stability in money markets.
c) Quantitative Easing (QE)
Introduced extensively after the 2008 Global Financial Crisis (GFC), QE involves large-scale asset purchases by central banks to stimulate economic activity when interest rates are already near zero. The U.S. Fed, ECB, and BOJ used QE to inject trillions of dollars into the financial system, boosting asset prices, reducing yields, and encouraging lending.
d) Reserve Requirements
Central banks can alter the percentage of deposits that banks must hold as reserves. Lowering reserve ratios increases the lending capacity of commercial banks, thereby expanding credit in the economy.
e) Forward Guidance
This communication tool involves signaling future policy intentions to influence market expectations. For example, when a central bank announces that rates will remain low for an extended period, it boosts investor confidence and encourages spending.
f) Exchange Rate Intervention
Some central banks, especially in export-driven economies, intervene directly in the foreign exchange market to control currency appreciation or depreciation. China’s central bank has historically done this to maintain a competitive export advantage.
3. Objectives of Central Bank Policies
The goals of central bank policies are often shaped by domestic priorities but also have implications for the global market:
Inflation Targeting – Most modern central banks aim to keep inflation around a target (usually 2%).
Full Employment – Encouraging job creation through economic stimulus.
Financial Stability – Preventing crises in banking and capital markets.
Exchange Rate Stability – Avoiding extreme currency fluctuations that can hurt trade competitiveness.
Sustainable Growth – Promoting long-term economic expansion without overheating.
4. Central Banks and Global Market Interdependence
In the globalized economy, the actions of one central bank can significantly affect others. This interconnectedness is visible in several areas:
a) Spillover Effects
When the U.S. Federal Reserve changes its policy stance, global financial markets react instantly. For example, higher U.S. interest rates can lead to:
Strengthening of the U.S. dollar.
Capital outflows from emerging markets.
Rising bond yields globally.
Volatility in global equity and commodity markets.
Similarly, the European Central Bank’s decisions on QE or rate cuts can impact the Eurozone and ripple through Asian and American markets.
b) Exchange Rate Volatility
Monetary policy divergence—when different central banks follow opposing directions—creates fluctuations in exchange rates. For instance, when the Fed tightens policy while Japan maintains ultra-low rates, the yen depreciates relative to the dollar, affecting trade balances and export competitiveness worldwide.
c) Inflation and Commodity Prices
Central bank policies influence inflation expectations globally. Loose monetary policies (like QE) often drive up commodity prices—especially gold, oil, and metals—as investors seek inflation hedges. Tightening policies, on the other hand, can deflate commodity bubbles.
d) Cross-Border Capital Flows
When advanced economies adopt low-interest policies, investors search for higher returns in emerging markets—known as “carry trade.” This inflow strengthens developing nations’ currencies temporarily but can reverse sharply when interest rates in advanced economies rise, leading to financial instability in emerging markets.
5. Case Studies of Major Central Banks and Their Global Impact
a) The U.S. Federal Reserve (Fed)
The Fed is arguably the most influential central bank in the world. Its monetary policy decisions set the tone for global markets because the U.S. dollar is the world’s primary reserve currency.
During the 2008 crisis, the Fed reduced interest rates to near zero and initiated several rounds of Quantitative Easing, purchasing trillions in government and mortgage-backed securities. This policy stabilized U.S. markets but also led to a global surge in asset prices and liquidity inflows into emerging economies.
In contrast, post-2015 rate hikes triggered capital outflows from developing countries and strengthened the dollar, causing many emerging markets to face currency depreciation and inflationary pressures.
The Fed’s post-pandemic policies (2020–2023) followed similar trends. During COVID-19, ultra-loose monetary policy supported recovery but later contributed to global inflation. The subsequent rapid rate hikes from 2022–2024 affected every market—from crypto assets to sovereign debt.
b) The European Central Bank (ECB)
The ECB governs the euro area and focuses primarily on price stability. After the 2008 crisis and the Eurozone debt crisis (2010–2012), the ECB introduced negative interest rates and massive bond-buying programs. This policy weakened the euro, boosted exports, and lowered borrowing costs for heavily indebted nations like Greece, Italy, and Spain.
However, ECB policies also led to capital shifts toward U.S. markets, as investors sought higher yields abroad. Recently, in response to high inflation (2022–2024), the ECB followed the Fed in tightening monetary conditions, showing how policy synchronization affects global markets.
c) Bank of Japan (BOJ)
The BOJ pioneered ultra-loose monetary policy to combat decades of deflation. Its “Yield Curve Control” (YCC) strategy caps long-term bond yields while maintaining low short-term rates. This has weakened the yen, supporting Japan’s exporters but also creating global imbalances, as Japanese investors sought higher returns overseas.
d) People’s Bank of China (PBOC)
The PBOC plays a unique role in the world economy. China’s central bank manages monetary policy with dual objectives: supporting domestic growth and maintaining a stable exchange rate for the yuan. The PBOC often uses reserve ratio cuts, liquidity injections, and currency interventions to sustain its economic expansion while avoiding financial instability.
Given China’s role as the world’s manufacturing hub, its monetary decisions influence commodity demand, global supply chains, and emerging market trade balances.
e) Reserve Bank of India (RBI)
The RBI balances inflation control with growth objectives. India’s high exposure to global capital flows makes it sensitive to Fed and ECB decisions. When U.S. rates rise, foreign investors often pull out from Indian markets, causing the rupee to weaken and import costs to rise. The RBI uses repo rate adjustments, foreign exchange interventions, and liquidity management to stabilize the economy.
6. The Role of Central Banks in Crisis Management
Central banks play a crucial role during economic crises. They act swiftly to prevent collapses and stabilize markets.
a) 2008 Global Financial Crisis
The Fed, ECB, and BOJ implemented unprecedented QE programs and zero-interest policies. These measures prevented a global depression but also led to long-term asset inflation and income inequality, as wealth concentrated in financial markets.
b) COVID-19 Pandemic (2020)
Global central banks responded with massive liquidity injections and fiscal coordination. The Fed’s unlimited QE, the ECB’s Pandemic Emergency Purchase Program (PEPP), and similar measures by other central banks ensured credit flow. However, the post-pandemic phase brought supply chain disruptions and record inflation, leading to synchronized tightening by 2022.
c) Financial Market Volatility (2022–2025)
Rapid rate hikes to curb inflation caused global debt pressures. Developing nations faced currency depreciation, capital flight, and debt servicing challenges. Central banks now face the delicate balance between price stability and economic growth.
7. Challenges Facing Central Banks in the Global Market
Global Inflation Pressures – Post-pandemic recovery and geopolitical tensions have caused persistent inflation worldwide.
Debt Burden – High global debt limits the room for aggressive tightening.
Financial Market Dependence – Markets have grown dependent on central bank liquidity; withdrawing it causes volatility.
Digital Currency Evolution – The rise of Central Bank Digital Currencies (CBDCs) introduces new policy challenges related to cross-border payments and cybersecurity.
Geopolitical Fragmentation – Sanctions, trade wars, and currency blocs complicate global coordination.
Climate and Green Finance – Central banks increasingly consider sustainability and environmental risks in policy frameworks.
8. The Future of Central Bank Policy in a Global Context
The future of central bank policies will likely focus on balance and innovation. Policymakers will need to harmonize inflation control with growth and stability. Key future trends include:
Greater International Coordination – To prevent spillover shocks, especially during crises.
Digital Transformation – Adoption of CBDCs and real-time payment systems.
Green Monetary Policy – Supporting sustainable investments and green bonds.
Macroprudential Regulation – Enhanced oversight to prevent asset bubbles and systemic risks.
Transparency and Communication – Forward guidance will remain critical for stabilizing expectations.
In the long term, global financial integration means that no central bank operates in isolation. Policies will need to be flexible and globally coordinated to manage shared challenges like inflation, debt, and digital disruption.
Conclusion
Central bank policies form the foundation of global economic stability. Through tools like interest rate management, quantitative easing, and forward guidance, central banks shape not only domestic economies but also the trajectory of global markets. The ripple effects of decisions made by the Federal Reserve, ECB, or PBOC influence capital flows, currency values, commodity prices, and financial stability across continents.
In an era of globalization, central banks have evolved from national guardians to global actors. Their policies must now consider international spillovers, financial integration, and the balance between stability and innovation. As the world navigates inflation, digitalization, and geopolitical uncertainty, the future of global markets will continue to hinge on how central banks manage their dual role—national stability and global responsibility.