How i Sell Spot btc & Close my Longs at TopThis isn’t a call on where Bitcoin goes next. It’s simply the chart that helped me exit my long positions right near the top.
I’ve kept this setup unchanged for years. No fancy indicators, no complicated overlays. Just the long-term trend lines that have guided every major expansion and slowdown since Bitcoin’s early cycles. When price tapped the upper boundary of this structure, the reaction was enough for me to start unwinding my longs. Nothing mystical here — just respecting a level that has mattered for nearly a decade.
The point of sharing this is to show how even the oldest, simplest charts can keep you grounded. Markets get noisy. Narratives change every week. But the big structure rarely lies. This chart helped me stay disciplined, and it still sits on my screen the same way it did years ago.
Harmonic Patterns

Clean vs Trap Pullbacks — Don’t Get FooledIn trading, a pullback can be an opportunity…
but it is also one of the most common traps that causes traders to lose money.
Some pullbacks allow you to enter with low risk, clean RR, and follow the trend smoothly.
Others look perfectly reasonable… until the market reverses and wipes out your stop loss.
So how do you tell a clean pullback from a trap pullback?
1. Clean Pullback – A Pause Before Continuation
A clean pullback is a healthy correction within a strong, intact trend.
Think of it as the market catching its breath before the next push.
Key characteristics of a clean pullback:
◆ The main trend remains clear
Higher highs – higher lows (uptrend)
Lower lows – lower highs (downtrend)
◆ The retracement is weaker than the impulse move
Smaller candles, shorter bodies, long wicks
No structural break
◆ Volume decreases during the pullback
Selling (or buying) pressure is not aggressive
The market is simply “resting”
◆ Price pulls back into a logical area
Previous support/resistance
Structural zones
Common Fibonacci levels (38.2 – 50 – 61.8)
👉 A clean pullback does not damage the trend’s integrity — it only tests it.
2. “Trap” Pullback – Looks Like a Retracement, Acts Like a Reversal
Trap pullbacks usually appear after a trend has extended too far or when momentum starts to fade.
They make traders think:
“It’s just a normal pullback…”
But in reality, smart money is already distributing.
Signs of a trap pullback:
◆ Trend strength is clearly weakening
New highs fail to exceed previous highs
Previous lows start getting broken
◆ The retracement is strong and aggressive
Large-bodied candles closing deep
Price moves confidently against the trend
◆ Volume increases during the pullback
This is no longer a technical retracement
Real money is changing direction
◆ Market structure breaks
Key highs/lows are violated
Break → retest → continuation in the opposite direction
👉 Trap pullbacks exploit a trend trader’s overconfidence.
3. A Common Mistake: “Price Pulls Back = Enter Trade”
Many traders don’t lose because of bad analysis,
but because they enter too early.
Familiar thoughts:
“It pulled back to support — buy.”
“The trend is still bullish.”
“That candle is just a retracement.”
But the market doesn’t care what you think.
It only cares about where the money is flowing.
4. How to Avoid Trap Pullbacks – Survival Rules
If you remember these three rules, you’ll avoid most pullback traps:
◆ Never enter just because price pulls back
Wait for confirmation:
rejection candles
small break & retest
clear reaction at structure
◆ Always check market structure first
Is the structure intact or broken
Are key highs/lows still respected?
◆ Compare impulse vs retracement
Strong impulse – weak pullback → trend is alive
Strong pullback – weak impulse → reversal risk
Closing Price Exploitation and Gaps Across Regions1. What Is Closing Price Exploitation?
Closing price exploitation refers to strategic actions taken by market participants—often large institutions, hedge funds, or algorithmic traders—to influence or take advantage of the closing price of a market. The closing price is a benchmark for:
Portfolio valuation
ETF/Index calculation
Mutual fund NAV
Margin requirements
Options settlement (for some markets)
Technical analysis (candles form based on closing price)
Because the closing price is so influential, it becomes a target for potential manipulation or strategic trading.
1.1 Why the Closing Price Matters
The closing price is considered the most important price of the trading day. It represents:
The final consensus of value
The point where liquidity peaks
A reference for next day’s sentiment
The price used by analysts and chartists
Any move near the close can change the market’s perception and technical structure.
1.2 How Exploitation Happens
Marking the Close
Large players place aggressive buy or sell orders in the last few minutes to push the closing price toward a desired level.
Example: A fund wants its quarterly report to show strong performance, so it pushes up prices of its holdings near the close (window dressing).
Exploiting Low Liquidity
In many markets, liquidity thins out near the close.
Even moderate orders can shift prices significantly.
High-frequency traders (HFTs) also exploit thinning order books to trigger stop-losses or manipulate closing auctions.
Taking Advantage of Index Rebalancing
Index funds must buy or sell assets at the close when weights change.
Smart money trades ahead of index funds, capturing profitable price moves.
Closing Auction Strategies
Some markets use auction mechanisms for the final trade.
Traders exploit mispricing during this auction by submitting large imbalance orders.
Influencing Options Expiry
In markets where options settle based on closing prices, aggressive buying/selling near expiry can shift settlement prices, generating profits on derivatives positions.
1.3 Who Performs Closing Price Exploitation
Hedge funds
HFT firms
Proprietary trading desks
Market makers
Large institutional investors
Retail traders rarely benefit from such strategies because they lack capital and execution speed.
2. Price Gaps Across Global Regions
Because different markets open and close at different times, prices across regions rarely move in a smooth, continuous way. Instead, they often show gaps caused by offshore developments.
2.1 What Is a Price Gap Across Regions?
A regional gap occurs when the price of an asset jumps or drops between the previous region’s close and the next region’s open due to:
Overnight news
Economic data releases
Commodity price moves
FX volatility
Geopolitical events
Market sentiment arising in other time zones
2.2 How Time Zones Create Gaps
Financial trading follows a global cycle:
Asia opens first (Japan, China, India)
Europe opens next (UK, Germany, France)
US opens last
When US markets close, Asia is still inactive. During the hours Asia is offline:
US equities move
Commodities like crude oil trade overnight
Bond yields react to news
Forex markets continue 24/5
When Asia opens again, prices adjust suddenly, creating a gap up or gap down.
2.3 Examples of Regional Gaps
US closes strong → Asia gaps up
If NASDAQ rallies 2% at night, markets like Nikkei, Hang Seng, or Nifty may open with a positive gap.
Europe experiences a crisis → US gaps down
Events like Brexit-related shocks caused large pre-market gaps in US indices.
Oil shocks → Middle East markets gap
Crude oil futures trade almost non-stop. Sudden spikes cause Gulf markets to open sharply higher.
US tech earnings → Global tech sector gaps
Apple, Google, or Tesla results released after US close impact Asia and Europe the next morning.
2.4 Categories of Gaps
Globally, gaps can be classified as:
Common gaps – small, frequent gaps due to routine overnight flow
Breakaway gaps – large gaps signaling trend reversals or breakouts
Runaway gaps – mid-trend, caused by strong momentum
Exhaustion gaps – appear at the end of strong moves, often reversing soon
Across regions, breakaway gaps and runaway gaps are more common because global news often triggers sharp repricing.
3. Why Gaps Occur More in Some Regions Than Others
Different exchanges have different characteristics:
3.1 Asia Has More Gaps
Because Asia reacts to both US and Europe overnight moves, Asian markets frequently open with big adjustments.
3.2 Europe Has Mid-Cycle Gaps
Europe reacts to Asia’s early moves and anticipates US market openings.
3.3 US Has Fewer Opening Gaps
Although US markets gap as well, they trade after-hours through futures, reducing the magnitude of opening shocks.
4. How Traders Exploit Price Gaps Globally
Professional traders use regional gaps as profitable opportunities.
4.1 Futures Arbitrage
Futures on indices (like Nifty, DAX, Nikkei, S&P 500) trade almost 24 hours.
When spot markets open with gaps, traders exploit:
Spot–futures discrepancy
Mispriced options
Imbalance in global cues
4.2 ADR vs. Local Stock Arbitrage
Many global companies have ADRs listed in the US.
Example: Tata Motors, Infosys, HDFC Bank.
ADR moves overnight in the US
Local shares in India gap up/down next morning
Arbitragers exploit the difference
4.3 Currency Influence
If INR/USD, EUR/USD, or JPY/USD moves sharply overnight:
Stocks sensitive to FX (IT, exporters) show gaps
Traders position for pre-market moves based on FX indicators
4.4 Commodities and Global ETFs
Gold, crude oil, natural gas, and global ETFs trade almost 24/7.
Their overnight fluctuations cause:
Gaps in commodity-dependent equities
Gap-up/gap-down opening in resource-heavy markets
5. Risks of Closing Price Exploitation and Global Gaps
Both phenomena introduce risks.
5.1 False Signals for Retail Traders
Closing price manipulation can make a stock appear bullish or bearish falsely.
5.2 Stop-Loss Hunting
Gaps can trigger stop-losses instantly at open, causing slippage.
5.3 Overreaction and Volatility
Markets may overreact to overnight news during open, leading to rapid reversals.
5.4 Liquidity Shock
Gaps often occur during low liquidity, amplifying price distortions.
6. How Traders Protect Themselves
Avoid placing tight stop-losses overnight
Track global futures (SGX GIFT Nifty, Dow Futures, DAX Futures)
Observe ADR movements
Watch commodity and FX trends
Monitor geopolitical calendars
Use options hedging (protective puts or strangles)
Conclusion
Closing price exploitation and regional gaps are inherent features of a globally interconnected financial system. The closing price is a key benchmark, making it vulnerable to strategic manipulation. Meanwhile, regional gaps arise naturally due to time zone differences and continuous global market flow.
OPEC Price Manipulation and Market Instability1. What Is OPEC and Why Does It Matter?
OPEC is a cartel of major oil-producing nations including Saudi Arabia, UAE, Iraq, Iran, Kuwait, Venezuela, and others. Together, OPEC members control:
Around 40% of world crude oil production
Nearly 80% of global proven oil reserves
Because oil is still the world’s most important energy resource, OPEC’s decisions have the power to shift global prices dramatically. Their strategy is simple: coordinate output to influence the supply side of the market. Since oil demand is relatively inelastic (people still need fuel, heating, transport), small changes in supply can create major price swings.
2. How OPEC Influences or “Manipulates” Oil Prices
OPEC does not directly set the market price. Instead, it manipulates supply, which indirectly manipulates price. The key tools include:
a) Production Cuts
When oil prices are falling due to weak demand or excess supply, OPEC often reduces output. By removing millions of barrels per day from the market, they tighten supply and push prices upward.
Example: In 2020 during the pandemic, OPEC+ cut nearly 10 million barrels/day to stop a price collapse.
b) Production Increases
When prices rise too sharply, OPEC can increase production to cool the market. However, OPEC often avoids aggressive increases because higher prices benefit member revenues.
c) Verbal Intervention (“Jawboning”)
Sometimes OPEC doesn’t act immediately but simply signals cuts or increases. Markets react instantly to statements from the Saudi oil minister or OPEC’s monthly outlook, causing speculative price moves.
d) Strategic Collaboration Through OPEC+
Since 2016, OPEC has partnered with other major producers such as Russia, forming OPEC+. This expanded group controls nearly 50% of global production, giving it even more power to influence prices.
The combination of coordinated supply management, strategic announcements, and alliances is often described as price manipulation, especially by countries that rely on OPEC oil.
3. Why OPEC Engages in Price Manipulation
OPEC’s actions are not random—they serve long-term and short-term goals:
a) Stabilizing Member Revenues
Oil exports are the backbone of many OPEC economies. Budget planning depends on a stable oil price range.
b) Preventing Price Crashes
Uncontrolled production could trigger price wars and economic instability.
c) Maintaining Political Leverage
Oil is a geopolitical tool. Countries with strong influence in OPEC—especially Saudi Arabia—use production control to strengthen their global bargaining power.
d) Supporting Long-Term Investment
Oil exploration and refining require billions in investment. Producers need predictable price ranges to justify projects.
While these goals benefit OPEC members, they can create volatility and uncertainty for consuming nations.
4. How OPEC Contributes to Market Instability
Although OPEC claims to promote market stability, its actions often do the opposite. Instability arises from several mechanisms:
a) Sudden Production Announcements
Unexpected production cuts or increases can cause immediate price shocks. Traders, speculators, and governments react instantly, amplifying volatility.
b) Geopolitical Tensions Among Members
Internal conflicts—such as tensions between Saudi Arabia and Iran or production disputes with Iraq—create unpredictable output behavior.
c) Dependency of Major Economies
Countries like India, China, Japan, and many European nations depend heavily on imported oil. Any OPEC action impacts:
Inflation
Currency value
Fiscal deficit
Energy costs
Stock markets
This dependency magnifies global instability.
d) Speculation in Oil Futures
When OPEC signals a supply cut, speculators rush into long positions in crude futures, pushing prices even higher. When OPEC signals oversupply, short sellers dominate. This creates price swings disconnected from fundamental supply-demand realities.
e) OPEC vs. Non-OPEC Rivalry
The rise of U.S. shale oil has challenged OPEC’s dominance. OPEC responses—like flooding markets to bankrupt shale producers (2014-2016)—cause multi-year instability.
5. Historical Examples of OPEC-Driven Instability
1) 1973 Oil Embargo
OPEC cut exports to the U.S. and Western Europe during the Yom Kippur War. Oil prices quadrupled, leading to global recession.
2) 2014 Price War
Saudi Arabia increased production aggressively to weaken U.S. shale producers. Oil prices crashed from $110 to $30, destabilizing markets worldwide.
3) 2020 Pandemic Crash
Disputes between Russia and Saudi Arabia led to overproduction during collapsing demand. Oil prices fell to historic lows (even negative in futures markets).
Each of these events shows how OPEC’s decisions can reshape the global economy.
6. Impact on Global Markets and Economies
a) Inflation
Higher oil prices directly increase transportation, manufacturing, and utility costs. Inflation rises globally, leading to higher interest rates.
b) Currency Volatility
Oil-importing countries see their currencies weaken when oil becomes expensive. Oil-exporting nations experience the opposite.
c) Stock Market Fluctuations
Sectors such as aviation, shipping, chemicals, manufacturing, and logistics react instantly to oil price changes.
d) Impact on GDP Growth
High oil prices slow global economic growth, reduce consumer spending, and increase production costs.
e) Fiscal Stress for Importing Nations
Countries like India face larger trade deficits when oil prices surge.
7. Is OPEC’s Price Manipulation Always Negative?
Not necessarily. Some analysts argue that OPEC actually prevents extreme instability.
Positive Roles
Prevents supply gluts
Maintains long-term price stability
Supports investment in oil infrastructure
Avoids destructive price wars
However, the challenge is that OPEC decisions are often politically motivated rather than economically balanced.
8. The Future of OPEC and Market Stability
As renewable energy adoption grows and electric vehicles expand, OPEC’s long-term dominance may weaken. Yet in the near future (2025–2040), oil will remain a core energy source. Hence:
OPEC will continue influencing prices
Market volatility will persist
Geopolitical tensions will amplify supply risks
Additionally, climate policies, U.S. shale production, and technological advances will shape future oil dynamics.
Conclusion
OPEC’s influence over global oil markets is undeniable. Through coordinated production strategies, strategic alliances, and political motivations, it often manipulates supply in ways that impact global prices. While OPEC claims to stabilize the market, its actions frequently generate uncertainty, volatility, and economic stress for oil-importing nations and financial markets.
Understanding OPEC’s behavior is essential for policymakers, traders, and investors who seek to navigate global market instability—because in the world of energy, a single announcement from OPEC can reshape the global economy within minutes.

Global Supply Chain Sequence Explained1. Raw Material Extraction and Sourcing
The supply chain begins with the extraction or harvesting of raw materials. These materials include:
Minerals (iron, copper, lithium)
Agricultural goods (wheat, cotton, soybeans)
Energy resources (oil, natural gas)
Forest products (timber, pulp)
Companies may source these materials from multiple countries to minimize cost, access better quality, or diversify risk. For example, lithium may come from Chile, cobalt from Congo, rubber from Thailand, and cotton from India. Sourcing decisions are influenced by prices, geopolitical relationships, trade policies, and environmental conditions.
Once extracted, raw materials are shipped to processing facilities through bulk cargo vessels, freight trains, or trucks.
2. Processing and Primary Manufacturing
The next stage is converting raw materials into usable inputs. This includes:
Oil → Plastics
Cotton → Yarn
Iron ore → Steel
Timber → Paper or fiberboard
Processing plants may be located in countries with:
Cheap labor
Access to natural resources
Established industrial infrastructure
Favorable tax policies
For instance, Southeast Asia and China are major hubs for primary manufacturing due to large skilled labor forces and efficient logistics.
Processed materials are then shipped to secondary or final manufacturing units, often across borders.
3. Component Manufacturing and Assembly
Most modern products consist of many components, each produced in specialized factories. A smartphone alone may have:
Chips from Taiwan
Screens from South Korea
Batteries from China
Cameras from Japan
Software from the U.S.
This stage involves:
CNC machining
Electronics fabrication
Chemical processing
Textile weaving
Automotive parts production
Manufacturers build components based on specifications provided by global brands. These components then move to assembly plants where the final product is built.
Global manufacturing hubs like China, Vietnam, India, Mexico, and Eastern Europe dominate this stage due to strong infrastructure and large workforce availability.
4. Global Transportation and Logistics
After components or assembled goods are ready, they need to move across borders. This involves:
Modes of Transport
Sea Freight
Cheapest and widely used for large volumes (containers, bulk cargo).
90% of world trade moves by sea.
Air Freight
Fastest but expensive. Used for electronics, perishables, and urgent shipments.
Rail Freight
Popular for trade between Europe–Asia via the Silk Route.
Road Transport
Essential for last-mile connectivity.
Shipping Containers
Standardized containers have revolutionized trade by allowing goods to seamlessly transition between ships, trucks, and trains. This intermodal system cut costs and reduced damage.
Ports and Customs
Goods pass through:
Export customs clearance
Transshipment hubs
Import customs clearance
This stage is heavily influenced by:
Trade regulations
Duty structures
Geopolitical relations
Port congestion
Documentation accuracy
Delays at customs can disrupt entire supply chains.
5. Warehousing and Distribution Centers
Once goods arrive in the destination region, they are stored in warehouses or distribution centers. These facilities perform:
Sorting and grading
Packaging or repackaging
Inventory management
Barcode/label printing
Quality checks
Modern warehouses use automated robots, RFID scanners, and data analytics for efficient operations.
Distribution centers are usually strategically located near major highways, ports, or airports to enable fast delivery to wholesalers, retailers, and online consumers.
Large companies like Amazon, Walmart, Flipkart, and Alibaba operate highly sophisticated fulfillment centers with AI-driven inventory systems.
6. Sales, Marketing, and Demand Management
This stage involves analyzing customer demand and planning inventory accordingly. Companies use:
Forecasting models
Market research
Data analytics
ERP systems
Accurate demand forecasting helps avoid:
Overstocking (causes high storage cost)
Stockouts (lost sales)
Production inefficiencies
Retailers and global brands rely on digital tools to align supply with changing consumer preferences.
7. Retail and Last-Mile Delivery
Finished goods are finally delivered to retailers, wholesalers, e-commerce warehouses, or directly to consumers. This involves:
Retail distribution networks
Online marketplaces
Courier services
Local transportation
Last-mile delivery is often the most expensive and time-consuming part of the supply chain, especially in urban areas with traffic congestion or rural areas with poor infrastructure.
E-commerce companies solve this through:
Micro-fulfillment centers
Hyperlocal delivery partners
AI route optimization
Cash-on-delivery logistics
8. After-Sales Services and Returns
The supply chain doesn’t end with delivery. After-sales activities include:
Warranty repairs
Return management
Replacement of defective products
Customer support
The reverse movement of goods—known as reverse logistics—is crucial for electronics, fashion, and e-commerce. Returned products may be:
Refurbished
Recycled
Resold
Disposed of responsibly
Efficient reverse logistics reduces waste and enhances customer satisfaction.
9. Recycling and Circular Supply Chains
As sustainability becomes a global priority, many companies now close the loop by recycling products. Examples:
Plastics → Recycled granules
Electronics → Recovered metals
Paper → Recycled pulp
Batteries → Reused chemicals
Circular supply chains reduce environmental impact and dependence on raw materials. Governments in Europe, the U.S., and Asia also push for extended producer responsibility (EPR) policies.
10. Digital Technologies Connecting the Supply Chain
Modern global supply chains increasingly rely on digital solutions for transparency and efficiency. Key technologies include:
Blockchain → Secure tracking of shipments
IoT sensors → Real-time temperature and location monitoring
AI & Machine Learning → Demand forecasting, route optimization
Robotics & Automation → Smart warehouses
Cloud platforms → Integrated supply chain management
Big data analytics → Reducing waste and cost
These technologies allow companies to respond faster to disruptions.
11. Risks and Disruptions in the Global Supply Chain
Global supply chains face many risks:
Geopolitical tensions (trade wars, sanctions)
Natural disasters (floods, earthquakes, pandemics)
Port congestions
Labor strikes
Currency fluctuations
Inflation in shipping costs
Regulatory changes
Events like COVID-19, the Suez Canal blockage, and U.S.–China tensions showed how vulnerable global trade systems can be. Companies now diversify suppliers and build resilient, multi-country networks.
Conclusion
The global supply chain sequence is a complex network involving raw materials, manufacturing, global transportation, warehousing, distribution, retail, and reverse logistics. Supported by modern technologies, each stage plays a vital role in ensuring products move efficiently from one part of the world to another. As globalization advances and digital transformation accelerates, supply chains are becoming smarter, faster, and more interconnected than ever before—yet they remain sensitive to global risks and require continuous adaptation.

Trade With Real Estate Globally1. What Is Global Real Estate Trading?
Global real estate trading means buying, selling, leasing, or investing in property across international borders. This includes:
Direct property purchases (homes, villas, commercial buildings, land).
Indirect investments such as Real Estate Investment Trusts (REITs).
Development partnerships with foreign builders.
Short-term rentals (Airbnb-style international properties).
Institutional investments where large funds buy foreign property portfolios.
The goal is to generate returns through:
Capital appreciation
Rental income
Diversification
Currency gains
Access to emerging market opportunities
2. Why Investors Trade Real Estate Globally
a. Higher Returns in Foreign Markets
Real estate returns vary widely from country to country. For example:
Dubai and UAE offer high rental yields (6%–10%).
European capitals give stable appreciation over time.
The U.S. offers powerful mortgage systems with low interest.
Investors chase these global advantages.
b. Diversification Against Domestic Risk
If one country faces inflation, recession, or political issues, the investor’s global property helps balance the risk. For example, an Indian investor with U.S. REITs is less affected by Indian market fluctuations.
c. Stronger Currency Gains
Buying property in a stronger currency like USD, AED, EUR, or GBP can increase overall wealth. When the home currency depreciates, global property appreciates in value.
d. Investment Visas & Residency Benefits
Many countries offer residency or citizenship on property purchase:
Portugal Golden Visa
Greece Residency by Investment
UAE 10-year Golden Visa
Turkey Citizenship by Property
This makes global real estate even more attractive.
e. Digitalization & Transparency
Earlier global real estate trading involved huge paperwork and physical visits. Today:
Virtual property tours
Online documentation
International real estate platforms
Global developers
have made the process fast and transparent.
3. Types of Global Real Estate Investments
a. Residential Properties
These include apartments, villas, condos, holiday homes, etc. Investors prefer:
Dubai
London
Singapore
New York
Australia
because of high demand and liquidity.
b. Commercial Properties
These include office buildings, retail shops, warehouses, and logistics centers. Commercial investment is popular because it offers:
Higher rental yield
Long-term leases (5–10 years)
Corporate tenants
Markets like the UAE, USA, Germany, and Netherlands are top choices.
c. Industrial Real Estate
Warehouses, fulfillment centers, manufacturing parks are booming due to:
E-commerce expansion
Supply chain globalisation
Countries like China, India, Vietnam, and Mexico attract global industrial investors.
d. Hospitality Real Estate
Hotels, resorts, service apartments—these gain from tourism growth. Investors choose places like:
Maldives
Thailand
Bali
Dubai
for hospitality trading.
e. REITs (Real Estate Investment Trusts)
REITs allow investors to buy shares of global property portfolios without owning physical buildings. They offer:
Low investment entry
High liquidity
Professional management
Examples: U.S. REITs, Singapore REITs, Dubai REITs, Indian REITs.
4. Key Drivers of Global Real Estate Trade
a. Economic Growth
Countries with fast-growing GDP naturally attract property investors. More jobs = more housing and commercial demand.
b. Urbanization
Cities expanding create strong real estate opportunities in:
Infrastructure
Residential
Transportation-linked developments
c. Foreign Direct Investment (FDI) Policies
Countries encouraging foreign investment—like UAE, Singapore, Portugal—get massive global capital in their property markets.
d. Tax Benefits
Countries offer:
Lower property tax
Zero capital gains tax
Tax-free rental income
This motivates global investors.
e. Currency Strength
Properties in strong-currency countries are seen as wealth preservers. Investors diversify to protect against local currency inflation.
5. Risks in Global Real Estate Trading
Like any investment, global property trading also has risks:
a. Currency Risk
If the foreign currency weakens, property returns fall when converted back.
b. Legal and Regulatory Challenges
Different countries have:
Different ownership laws
Restrictions on foreigners
Complex registration rules
Investors must understand these rules before buying.
c. Political and Economic Uncertainty
War, elections, sanctions, recession—these can affect property values.
d. Market Liquidity
Some markets don’t have fast buyers. Selling global property may take time.
e. Management Issues
If buying a property abroad, maintenance and tenant management can be challenging. Most investors hire property managers.
f. Taxation Complexity
Owning property abroad may mean paying taxes in both the foreign country and the home country.
6. How Global Real Estate Trading Works
Step 1: Market Research
Investors research:
GDP trends
Political stability
Rental yields
Transaction costs
Legal regulations
Step 2: Property Selection
They choose:
Residential, commercial, or industrial
Developed or emerging market
High-growth or high-yield area
Step 3: Legal & Documentation
Involves:
KYC
Property agreements
Notary procedures
Taxes
Some countries require local lawyers or brokers.
Step 4: Financing
Options:
Self-funded purchase
International mortgages
Developer financing
Step 5: Rental Management
To earn steady income, investors hire:
Property managers
Rental agents
Facility teams
Step 6: Exit Strategy
Investors must plan when to:
Sell the property
Reinvest in another market
Convert currency profits
7. Best Countries for Global Real Estate Trade in 2025
High-Yield Markets
Dubai (UAE)
Indonesia
Vietnam
Turkey
Stable and Safe Markets
USA
Canada
UK
Germany
Australia
Emerging Opportunity Markets
India
Philippines
Mexico
Saudi Arabia
8. Future of Global Real Estate Trading
Global property trading will grow rapidly due to:
Digital platforms
Blockchain-based property titles
Tokenization (fractional property ownership)
International mobility
Increased foreign investments
Investors will increasingly diversify across countries rather than depending on just one local market.
Conclusion
Global real estate trading has become a powerful way to build wealth, diversify risk, and take advantage of global economic growth. It offers opportunities in residential, commercial, industrial, and hospitality segments, supported by rising urbanization, open investment policies, and financial globalization. While it brings risks like legal challenges, currency fluctuations, and management issues, the rewards—high returns, global diversification, and strong-currency appreciation—make it a preferred choice for smart investors.

Risk in the International Market1. Currency Exchange Rate Risk
One of the biggest risks in global markets is foreign exchange risk. When two countries conduct trade or an investor buys foreign assets, the value of the investment depends on exchange rates.
For example:
If an Indian company exports goods to Europe and the Euro weakens against the Rupee, the exporter may receive less money.
If an investor buys US stocks and the USD depreciates, the value of their investment falls in their home currency.
Exchange rate movements are driven by global demand and supply, interest rates, central bank policies, inflation, and geopolitical news. Even small fluctuations can cause huge changes in profitability.
2. Global Economic Risk
Economic health differs across countries. Some are growing rapidly, while others may be in recession. International markets are deeply connected, so a slowdown in one major economy can affect the entire world.
Examples:
A recession in the US often impacts global demand, stock markets, and commodity prices.
Slowdown in China reduces global industrial metal demand, affecting exporters like Australia, Brazil, and Africa.
Global economic risk includes:
Inflation spikes
Interest rate hikes
Unemployment rises
Lower GDP growth
Shifts in global trade patterns
International investors must monitor economic indicators across multiple countries to assess risk properly.
3. Geopolitical and War Risk
Geopolitical tensions, wars, territorial disputes, sanctions, and diplomatic conflicts cause high volatility in international markets. These events can disrupt trade routes, supply chains, and commodity prices.
Recent examples include:
Russia–Ukraine war impacting oil, gas, wheat, and nickel prices.
US–China trade war affecting global technology and semiconductor supply.
Middle East tensions pushing crude oil prices higher.
Even a single geopolitical headline can trigger sharp market movements. Investors closely track global political developments to manage this risk.
4. Regulatory and Compliance Risk
Each country has its own laws, financial regulations, tax structures, environmental rules, and trade policies. Companies operating internationally must comply with multiple legal frameworks, and sudden regulatory changes can bring financial losses.
Examples:
A country increasing import duty on electronics can hurt global manufacturers.
Sudden changes in foreign investment rules can impact multinational projects.
New data protection laws can affect IT and cloud-based businesses.
Regulatory risk requires businesses to stay updated with international laws and maintain strong compliance teams.
5. Interest Rate and Monetary Policy Risk
Central banks around the world, such as the US Federal Reserve, European Central Bank, RBI, or Bank of Japan, control interest rates and monetary policy. Their decisions directly impact global markets.
When interest rates rise:
Borrowing becomes expensive
Foreign investors move money to safer, higher-yield economies
Stocks and commodities may fall
When interest rates fall:
Markets often rally
Borrowing increases
Economic growth improves
International traders must monitor global central bank announcements because they influence currencies, bonds, equities, and commodities across the world.
6. Political Risk
Apart from wars or conflicts, routine political activities also influence global markets. These include:
Elections
Government instability
Policy changes
Nationalization of industries
Corruption or administrative inefficiency
Political uncertainty discourages foreign investment. A country with stable governance attracts more international capital, while a politically unstable regime increases risk.
7. Commodity Price Volatility Risk
Many countries rely heavily on global commodities such as crude oil, natural gas, gold, wheat, corn, copper, and more. Price fluctuations in these commodities affect economies, companies, and international trade.
For instance:
Rising oil prices hurt oil-importing countries like India.
Falling metal prices hurt metal exporters like Chile or Brazil.
Weather events (like El Niño) affect global food supply and prices.
Commodity risk is heavily influenced by global supply-demand trends, weather patterns, geopolitical events, and currency fluctuations.
8. Supply Chain and Logistics Risk
International trade depends on complex supply chains involving ports, ships, trucks, customs, warehouses, and multiple stakeholders. Any disruption can create massive financial losses.
Key supply chain risks include:
Pandemic-related lockdowns
Port congestion
Freight rate spikes
Strikes or labour shortages
Natural disasters
Cyberattacks on logistics systems
The COVID-19 pandemic highlighted the vulnerability of global supply chains, causing worldwide shortages of chips, medicines, and essential goods.
9. Technological and Cybersecurity Risk
The digital nature of global markets increases cybersecurity threats. Hackers, cyber-criminals, and state-sponsored attacks can disrupt banking systems, trading platforms, and corporate networks.
Risks include:
Data theft
Ransomware attacks
Online fraud
Trading system failures
Intellectual property theft
Companies trading globally must invest heavily in cybersecurity to protect sensitive data and maintain investor trust.
10. Cultural and Operational Risk
Operating in different countries means dealing with different cultures, languages, work ethics, and consumer behaviour. Misunderstanding local customs or market expectations can cause financial setbacks.
Examples:
Marketing strategies that work in the US may not work in Japan.
A product popular in Europe may not suit Indian tastes.
Local negotiation styles may differ widely from global norms.
Companies must adapt to local cultures through proper research, staffing, and training.
11. Credit and Payment Risk
When trading internationally, companies face credit risk because foreign buyers may delay payments, default, or go bankrupt. Cross-border legal recovery is often difficult and time-consuming.
This risk is managed through:
Letters of credit
Bank guarantees
Trade insurance
Advance payment agreements
But even with these measures, international transactions remain riskier than domestic ones.
12. Environmental and Climate Risk
Climate change and environmental laws increasingly affect international trade. Natural disasters disrupt transportation, production, and supply chains.
Examples:
Floods damaging manufacturing hubs
Heatwaves reducing agricultural output
Cyclones halting port operations
Environmental regulations also force companies to upgrade technology or pay penalties, adding to operational costs.
Conclusion
The international market offers enormous opportunities but also exposes participants to a wide range of risks—including currency fluctuations, geopolitical tensions, economic shocks, regulatory changes, and supply chain disruptions. Successful global investors or businesses must constantly monitor global trends, diversify exposures, use hedging tools, and maintain strong compliance and risk-management systems. Mastering these risks is essential to sustaining growth and profitability in a highly interconnected world.

Risk in Global Events and Geopolitical News1. Understanding Geopolitical Risk
Geopolitical risk is fundamentally tied to countries, governments, conflict, policy, and global relationships. It involves evaluating how political decisions or international disputes may impact economic conditions.
Common sources of geopolitical risk include:
Wars and military conflicts
Terror attacks or large-scale violence
Trade wars and tariff disputes
Sanctions and diplomatic tensions
Elections and political instability
Shifts in alliances and treaties
Border conflicts
Energy supply disruptions
Natural disasters with political implications
Markets dislike uncertainty, and geopolitical news creates exactly that. Even a small headline can trigger massive market reactions if it suggests potential disruption to economic activity or global trade.
2. Major Categories of Global Event Risks
a) Political Instability and Elections
Elections, leadership changes, coups, or political protests can quickly impact markets. Investors prefer stable governments, predictable policies, and clear regulatory environments.
For example:
A surprise election result can shift a country’s economic policy direction.
Political unrest can affect tourism, investment, and consumer confidence.
Countries with weak institutions often face market sell-offs during instability.
b) Wars and Military Conflicts
Armed conflicts are among the most severe geopolitical risks. They disrupt trade routes, destroy infrastructure, create inflationary pressures, and affect global commodity markets.
Conflicts in key regions like the Middle East can instantly affect global oil prices, while tensions between major powers (like the US, China, or Russia) can shake global markets.
c) Trade Wars and Economic Sanctions
Modern geopolitical tensions often play out through tariffs, sanctions, and economic restrictions instead of full-scale wars.
Examples:
US–China trade war caused supply chain disruptions worldwide.
Sanctions on Russia affected energy markets and global inflation.
Restrictions on semiconductor exports changed technology investments.
Trade barriers make goods more expensive, limit production, and reduce GDP growth — all of which increase market volatility.
d) Global Health Crises and Pandemics
Events like COVID-19 demonstrate how a health crisis can become a global economic shock.
Impact areas:
Lockdowns disrupt supply chains.
Travel and tourism collapse.
Labor shortages slow production.
Governments increase fiscal spending.
Pandemics are rare but extremely high-impact risks.
e) Natural Disasters
Earthquakes, floods, hurricanes, and climate-related disasters also create geopolitical and economic ripple effects.
For example:
A major earthquake in Japan affects global automobile and electronics supply chains.
Floods in agricultural regions push food prices higher.
Climate change policies alter energy markets and industrial investments.
f) Currency and Debt Crises
A country’s financial instability can also spark global panic.
Events include:
Sovereign debt defaults
Currency devaluation
Banking crises
Such crises reduce investor confidence, harm trade partners, and can lead to capital flight from emerging markets.
3. How Geopolitical News Impacts Financial Markets
a) Stock Markets
Equity markets react immediately to global events. Negative geopolitical news often triggers:
Market sell-offs
Flight to safety (investors move money to safer assets)
Increased volatility (VIX index spikes)
Sectors directly related to global risk — defense, energy, cyber security — sometimes rise during geopolitical tensions.
b) Currency Markets
Forex markets are extremely sensitive to geopolitical instability.
Safe-haven currencies like USD, JPY, and CHF strengthen.
Currencies of unstable or exposed countries weaken.
Currency volatility increases trading opportunities but also risk.
For example, during conflicts in Europe, the Euro often faces downward pressure.
c) Commodity Markets
Commodities like crude oil, natural gas, gold, wheat, and metals react sharply to global events.
Oil prices rise when conflict threatens supply in the Middle East.
Gold becomes a safe-haven during uncertainty.
Agricultural prices rise after climate disasters or geopolitical disruptions.
d) Bond Markets
Government bonds, especially US Treasuries, become highly attractive during geopolitical crises. Investors seek safety and stable returns, causing bond yields to fall as prices rise.
4. Sector-Wise Impact of Geopolitical Risk
Energy Sector
Among the most sensitive sectors. Conflicts in oil-producing nations cause:
Supply disruptions
Price spikes
Inflation in importing countries
Technology Sector
Geopolitics affects:
Semiconductor supply chains
Data security regulations
Cyber-security threats
Export restrictions on advanced technology
Defense & Aerospace
Risks and conflicts often boost:
Defense budgets
Weapon system demand
Military research investments
Agriculture
Weather, climate, political instability, and war all shape global food supply. Sanctions or blockades affect trade routes and prices.
5. How Traders and Investors Manage Geopolitical Risk
a) Diversification
Holding a variety of assets (stocks, bonds, commodities, currencies) reduces exposure to any single geopolitical event.
b) Hedging Strategies
Using derivatives like:
Options
Futures
Currency hedges
These protect portfolios from sudden market swings.
c) Monitoring Global News
Professional traders constantly track:
Government decisions
Diplomatic meetings
Conflict zones
Major speeches
Data releases
Timely information is the key to navigating geopolitical risk.
d) Investing in Safe Havens
During turmoil, traders often shift to:
Gold
US Treasury bonds
Swiss franc
Japanese yen
Defensive stocks (utilities, healthcare)
e) Scenario Analysis
Institutions often simulate “what if” scenarios:
What if oil supply drops by 20%?
What if a conflict intensifies?
What if sanctions expand?
This helps them prepare in advance.
6. Long-Term Economic Impact of Geopolitical Risks
Geopolitical tensions can reshape global economics for decades. Examples include:
Redefined trade routes (like India–Middle East–Europe corridor)
New energy alliances (shift to renewables)
Rise of regional manufacturing (China+1 strategy)
Increased defense expenditure worldwide
These long-term shifts create opportunities as well as risks.
Conclusion
Global events and geopolitical news are powerful drivers of market movements, economic decisions, and investor behavior. From wars and elections to trade wars and natural disasters, these events bring both risks and opportunities. Successful traders and businesses understand these dynamics, monitor trends closely, diversify their exposure, and adapt strategies to manage uncertainty.
In a world where information travels instantly and economies are deeply interconnected, geopolitical awareness has become essential for anyone involved in markets. Understanding and preparing for these risks not only prevents losses but also allows individuals and institutions to make smarter, more confident decisions in a constantly changing global landscape.

Global Trading Economics Risk1. Macroeconomic Risks in Global Trade
Macroeconomic risks arise from changes in global economic conditions. These are the most common risks that affect trade flows, demand, profits, and investment decisions.
a) Economic Slowdowns and Recessions
When major economies like the US, China, or the EU slow down, global trade demand drops sharply. Lower consumer spending reduces imports, companies cut production, and global supply chains weaken. Recessions also increase unemployment, reduce investment, and cause businesses to delay expansion.
b) Inflation Risk
High inflation increases production costs, reduces the purchasing power of consumers, and forces central banks to raise interest rates. When interest rates rise:
borrowing costs go up
companies reduce investment
currency values fluctuate
export and import dynamics shift
Countries with high inflation become less competitive in global markets.
c) Interest Rate Risk
Central banks around the world adjust interest rates to control inflation, stabilize the currency, or stimulate growth. Higher interest rates strengthen a country’s currency, making exports expensive and imports cheaper. Lower interest rates weaken the currency and stimulate exports. These fluctuations directly impact global trade volumes and profitability.
2. Currency Risk in Global Trade
Currency risk is one of the biggest challenges in international trade. Because transactions usually happen in global currencies like USD, EUR, or GBP, sudden changes in exchange rates can create huge gains or losses.
a) Exchange Rate Volatility
If a country's currency depreciates suddenly, its exports become cheaper globally, but its imports become costly. On the other hand, a strong currency makes exports expensive and reduces foreign demand.
b) Currency Wars
Sometimes countries intentionally devalue their currency to boost exports. This creates competitive tension between nations and increases uncertainty for international traders.
c) Hedging Challenges
Companies use forex instruments (like forward contracts, options, and swaps) to protect themselves from currency movements. But hedging itself carries costs and complexity.
3. Geopolitical and Political Risks
Political instability and geopolitical conflicts are major sources of global trading risk. Any disruption in political relations impacts trade policies, supply routes, and investor confidence.
a) Trade Wars
Trade wars happen when countries impose tariffs and sanctions on each other’s imports. The US-China trade war is a clear example, with tariffs creating uncertainty for businesses and raising costs for consumers.
b) Conflicts and Wars
Geopolitical conflicts disrupt supply chains, increase commodity prices (especially oil and gas), and restrict trade routes. For example:
Middle East conflicts disrupt crude oil supply.
Russia–Ukraine conflict affected global wheat, gas, and fertilizer markets.
c) Policy Changes
Government decisions such as new taxes, export restrictions, sanctions, or regulatory reforms can abruptly change trade conditions.
d) Political Instability
Countries with unstable governments experience disruptions in production, currency fluctuations, investment losses, and lower international trust.
4. Supply Chain and Logistics Risks
Global trade depends on efficient supply chains. Any disruption can cause shortages, delays, and increased costs.
a) Shipping Delays and Container Shortages
Events such as port congestion, strikes, and logistical bottlenecks lead to delivery delays and higher freight costs.
b) Natural Disasters
Earthquakes, floods, cyclones, and pandemics can shut down ports, factories, and production hubs, affecting global supply networks.
c) Supply Chain Dependencies
Many countries depend heavily on specific nations for essential goods like semiconductors, crude oil, food, and pharmaceuticals. Disruptions in these supply hubs can impact global trade stability.
d) Transportation Risk
Breakdowns in transportation networks—such as railway issues, air cargo restrictions, or shipping route closures—cause massive trade disruptions.
5. Regulatory and Compliance Risks
International trade is heavily regulated. Countries follow trade agreements, tariffs, environmental rules, and safety standards.
a) Tariff Risk
Changes in customs duties, import taxes, and trade barriers can alter the profitability of cross-border sales.
b) Trade Agreement Risk
Countries may withdraw from agreements (like Brexit), renegotiate tariffs, or impose new conditions.
c) Compliance Risk
Businesses must follow:
environmental standards
labor laws
product quality rules
customs documentation
Non-compliance leads to fines, shipment delays, or bans.
6. Technological Risks in Global Trading Economics
Technology plays a critical role in modern trade, but it also introduces new risks.
a) Cybersecurity Threats
Hackers target:
financial transactions
supply chain software
logistics systems
digital shipping documents
A cyberattack can halt operations and compromise sensitive data.
b) Automation and AI Risks
Automation increases efficiency but also creates job losses and inequality. Over-reliance on AI systems can escalate risks if they malfunction.
c) Digital Trade Barriers
Countries sometimes restrict data transfers or impose digital taxes, affecting companies operating globally.
7. Commodity Market Risks
Global trade heavily depends on commodities like crude oil, natural gas, metals, and agricultural produce.
a) Price Volatility
Commodity prices fluctuate due to demand-supply imbalances, geopolitical tensions, weather conditions, or speculation. High volatility affects production costs and profit margins.
b) Resource Dependency
Countries dependent on a single commodity face extreme risk when prices fall (e.g., oil-exporting nations during a crude price crash).
8. Environmental and Climate Risks
Climate change is becoming one of the most significant long-term global trading risks.
a) Extreme Weather
Storms, droughts, and floods disrupt trade, damage crops, and shut down industries.
b) Carbon Taxes and Emission Rules
Global environmental regulations are changing how companies operate. Carbon taxes increase costs for exporters, especially in energy-intensive industries.
c) Sustainability Pressure
Consumers and governments demand eco-friendly production. Companies that fail to adapt face loss of market access.
9. Global Financial Market Risks
Financial markets influence trade through stock market performance, liquidity conditions, and investor sentiment.
a) Credit Risk
Companies and governments rely on global financing. Liquidity crises or credit downgrades increase borrowing costs.
b) Banking Risk
Banking collapses or regulatory failures impact trade finance, currency markets, and investor confidence.
10. Risk Management in Global Trading Economics
Companies and investors use several strategies to manage global trading risks:
Hedging using futures, options, and swaps
Diversifying markets and suppliers
Setting up supply chain redundancies
Political risk insurance
Strong financial planning
Digital security systems
Scenario analysis and stress testing
Effective risk management ensures long-term stability and profitability in global trade.
Conclusion
Global trading economics risks are unavoidable in today’s interconnected world. They emerge from economic cycles, political tensions, currency movements, supply chain disruptions, commodity volatility, and environmental changes. For traders, investors, and businesses, understanding these risks and adopting effective risk-management strategies is crucial to surviving and succeeding in global markets.

Recessions and Recoveries in the Global Market1. What Is a Recession?
A recession is a significant decline in economic activity that lasts for months or even years. It is generally marked by:
Falling GDP
Rising unemployment
Decline in consumer spending
Drop in corporate profits
Turbulence in financial markets
Reduced industrial production
In the modern globalized world, recessions rarely stay confined within one country because trade, capital flows, and supply chains are all interconnected.
2. Causes of Global Recessions
Recessions can have many triggers, and sometimes a combination of several. The common causes include:
a) Financial Crises
Banking system failures or credit crunches reduce lending and investment.
Example: The 2008 Global Financial Crisis began with subprime mortgages in the U.S. and spread worldwide through global banking linkages.
b) High Inflation
When inflation rises too quickly, central banks raise interest rates to control it. Higher rates increase borrowing costs and slow down economic activity.
Example: Multiple central banks tightened monetary policy drastically in 2022–2023 due to inflation spikes.
c) Geopolitical Conflicts
War, economic sanctions, territorial tensions, and global political instability disrupt trade and energy markets.
Example: Russia–Ukraine war disrupted global oil, gas, and wheat supply.
d) Supply Chain Disruptions
Shortage of components (like semiconductors), transportation bottlenecks, or pandemics disrupt manufacturing.
Example: COVID-19 lockdowns that halted global production.
e) Asset Bubbles
Overvalued housing markets, stock markets, or crypto markets can crash, reducing wealth and investor confidence.
f) Sharp Changes in Commodity Prices
A sudden spike in oil or a crash in metal prices can hurt economies dependent on these resources.
Most global recessions occur when multiple regions slow down simultaneously, creating a domino effect through trade, finance, and currency markets.
3. How Global Recessions Spread Across Markets
In a highly connected global economy, economic distress can travel across borders through several channels:
a) Trade Linkages
When one major economy slows, it imports less. Export-dependent countries immediately feel the impact.
Example: China's slowdown affects Southeast Asia, Africa, Latin America, and Europe.
b) Financial Markets
Stock markets around the world react almost instantly to negative global news.
Banks reduce cross-border lending.
Foreign investors withdraw money from emerging markets, weakening their currencies.
c) Commodity Prices
Lower demand reduces oil, metals, and agricultural prices, hurting producer economies.
d) Currency Markets
During recessions, investors move towards “safe-haven” currencies like USD, JPY, or CHF.
This can weaken emerging market currencies and make imports costlier.
e) Investor Sentiment
Fear spreads faster than data.
When global confidence falls, everyone—from households to corporations—cuts spending.
This chain reaction makes global recessions deeper and more synchronized.
4. Impact of Recessions Across Sectors
Recessions do not hit all sectors equally. Some are highly sensitive, while others remain relatively stable.
Highly Affected:
Automobiles
Real estate
Consumer discretionary
Metals and mining
Banking and finance
IT services (due to lower corporate spending)
Less Affected or Often Resilient:
Consumer staples
Pharmaceuticals
Healthcare
Utilities
Gold and safe-haven commodities
This difference in sectoral impact is why investors rebalance portfolios during recessions.
5. The Recovery Phase — How Economies Bounce Back
A recovery is the period after a recession when economic activity begins improving. It can be slow, fast, or uneven depending on:
Government policies
Central bank interest rate cuts
Consumer confidence
Global geopolitical stability
Technological shifts
Commodity price movements
Key signs of recovery include:
Rising GDP numbers
Falling unemployment
Stabilizing stock markets
Improvement in industrial production
Increase in global trade
Business expansion and hiring
Recoveries are often driven by renewed optimism and government stimulus.
6. Types of Economic Recoveries
Economists classify recoveries based on the shape of the economic rebound:
a) V-Shaped Recovery
Fast decline followed by a strong and quick rebound.
Example: India’s post-COVID recovery in 2021.
b) U-Shaped Recovery
Economy stays at the bottom for some time before recovery begins.
c) W-Shaped Recovery
Double dip: recovery begins, fails, and restarts.
Often caused by uncertainty or premature policy tightening.
d) L-Shaped Recovery
The worst type — a steep fall followed by stagnation for a long time.
Example: Japan’s “Lost Decade.”
e) K-Shaped Recovery
Some sectors recover strongly, while others lag.
Seen in many countries after COVID-19.
Understanding these patterns helps investors anticipate market behavior.
7. Role of Governments and Central Banks
During recessions, policymakers play a critical role in stabilizing the economy.
a) Fiscal Policies
Governments may:
Reduce taxes
Increase spending on infrastructure
Provide subsidies
Offer unemployment benefits
Stimulate demand through relief packages
b) Monetary Policies
Central banks:
Cut interest rates
Inject liquidity
Purchase government bonds
Relax bank lending norms
These actions aim to reduce borrowing costs, encourage investment, and boost consumption.
8. Impact on Global Financial Markets
Recessions often lead to:
a) Stock Market Declines
Investors sell risky assets due to uncertainty.
Bear markets can last months or years.
b) Bond Market Rally
Government bonds become attractive because they are safer.
c) Currency Volatility
Safe-haven currencies appreciate, while emerging market currencies weaken.
d) Flight to Gold
Gold rises as investors look for security.
e) Drop in Corporate Earnings
Lower profits reduce equity valuations.
During recovery, the opposite happens — risk assets rise, commodity prices stabilize, and currencies normalize.
9. Lessons from Past Global Recessions
a) The world is more interconnected than ever.
A recession in one large economy spreads quickly.
b) Excessive debt creates fragility.
Corporate, household, and government debt levels determine how deep a recession becomes.
c) Innovation accelerates recoveries.
Technology, digitization, and new business models often drive post-recession growth.
d) Policy timing is crucial.
Early stimulus shortens recessions; delayed response deepens them.
10. Conclusion
Recessions and recoveries are natural parts of the global economic cycle. Although they bring uncertainty, disruptions, and market volatility, they also create opportunities for restructuring, innovation, and long-term growth.
In today’s interconnected world, understanding how recessions spread, how recoveries unfold, and how markets respond is essential for traders, investors, and businesses. Those who stay informed, diversify wisely, and adapt to economic shifts often emerge stronger when the next recovery begins.

Global Currency Strategies1. Hedging Strategies
Hedging is one of the most widely used global currency strategies. The purpose of hedging is to protect against adverse currency movements rather than generate profit.
a. Forward Contracts
A forward contract locks in an exchange rate today for a transaction that will take place later.
Example: An Indian importer due to pay USD in 3 months may lock the rate today to avoid future appreciation of USD.
b. Futures Contracts
Similar to forwards but traded on exchanges, making them standardized and more liquid.
c. Options Strategies
Currency options give traders the right (not obligation) to buy/sell a currency at a specific price.
Common strategies: Long Call, Long Put, Straddle, Strangle.
d. Natural Hedging
Businesses offset currency exposure by matching revenue and expenses in the same currency.
Why hedging matters:
It protects corporate profits, prevents losses during volatile periods, and ensures financial stability for global businesses.
2. Carry Trade Strategy
Carry trade is one of the most popular global currency strategies among professional traders.
It involves:
Borrowing in a low-interest rate currency → Investing in a high-interest rate currency.
How it works
Low-yield currency: JPY, CHF
High-yield currency: USD, AUD, INR, MXN (depending on economic cycles)
Example
Borrow Japanese Yen at 0.1% interest → Invest in an AUD bond yielding 3%.
Traders profit from the interest rate differential plus potential currency appreciation.
Risks
Carry trades unwind rapidly during global uncertainty because traders rush toward safe-haven currencies like USD and JPY, causing volatility.
3. Currency Arbitrage Strategies
Arbitrage involves exploiting price discrepancies across markets. Though opportunities are rare and short-lived, algorithmic traders and banks often use them.
a. Triangular Arbitrage
Uses three currency pairs to exploit price differences.
Example: USD/EUR, EUR/GBP, and USD/GBP mispricing.
b. Covered Interest Arbitrage
Traders lock in forward contracts to profit from interest rate deviations across currencies.
c. Statistical Arbitrage
Involves algorithms analyzing mean-reversion patterns.
Why arbitrage is important:
It helps maintain pricing efficiency and stability in global currency markets.
4. Fundamental Analysis Strategies
Fundamental currency strategies depend on macroeconomic and geopolitical factors affecting exchange rates.
Key Indicators Used
Interest rates (most powerful driver of FX)
Inflation levels
GDP growth
Employment data
Manufacturing PMI
Trade balance
Political stability
Central bank announcements
Strategies Based on Fundamentals
a. Interest Rate Differentials
Currencies with rising interest rates tend to appreciate because they attract foreign capital.
b. Inflation-Based Trading
Higher inflation typically weakens a currency because purchasing power declines.
c. Economic Divergence Strategies
Focus on differences between two economies.
Example: Strong U.S. growth vs. slow European growth may strengthen the USD against EUR.
d. Commodity-Linked Currency Strategies
Some currencies move with commodity prices:
CAD ↔ Crude Oil
AUD, NZD ↔ Gold, Iron Ore
NOK ↔ Oil
Traders exploit these relationships.
5. Technical Analysis Strategies
Technical analysis uses charting tools and price action patterns to predict currency movements.
Common Tools
Support & resistance zones
RSI, MACD, Stochastic Oscillator
Moving Averages (SMA, EMA)
Bollinger Bands
Fibonacci Retracement
Trendlines & channels
Chart patterns (Head & Shoulders, Flags, Wedges)
Technical-Based Strategies
a. Trend-Following
Traders identify long-term trends in currency pairs and follow the momentum.
Popular tools: 50-day and 200-day moving averages.
b. Range Trading
Many currency pairs consolidate in ranges for long periods.
Traders buy at support and sell at resistance.
c. Breakout Trading
When price breaks past a key level, it often triggers a directional move.
d. Algorithmic Technical Trading
Robots execute technical strategies automatically based on coded rules.
6. Safe-Haven Currency Strategies
Certain currencies are considered safe during crises:
USD (global reserve)
JPY (Japan’s stable economy & low yields)
CHF (Switzerland’s financial safety)
Strategy Approach
During global uncertainty—war, recession fears, geopolitical tension—traders shift their capital to safe-haven currencies.
Why It Works
Investors prioritize stability over return, causing demand for safe-haven currencies to rise.
7. Diversification Strategies
Diversification reduces risk by spreading exposure across multiple currencies, sectors, and regions.
Different Ways to Diversify
Holding a basket of currencies instead of one
Investing in multi-currency ETFs
Using managed futures
Building portfolios across emerging and developed markets
Why Diversification Matters
It protects traders from sudden shock events—economic downturns, political conflicts, and natural disasters.
8. Currency Correlation Strategies
Currencies are interlinked due to global trade and economic relationships.
Examples of Positive Correlations
EUR/USD and GBP/USD
AUD/USD and NZD/USD
USD/CAD moves inverse to Oil prices
How Traders Use Correlation
Identifying divergence opportunities
Hedging correlated currency pairs
Creating pair-trading strategies
9. Emerging Market Currency Strategies
Emerging markets like India, Brazil, Turkey, and South Africa offer high return potential but increased volatility.
Strategies
Investing in high-yield currencies (INR, BRL, MXN)
Using carry trade advantages
Trading volatility cycles
Avoiding periods of political risk or economic instability
10. Algorithmic and High-Frequency Strategies
Modern currency markets heavily rely on automation.
Types of Algo Strategies
Trend-following
Mean-reversion
Arbitrage
Market-making
Sentiment-based analysis using AI
Benefits
Speed, accuracy, and emotion-free trading
Ability to react instantly to global news
Conclusion
Global currency strategies are essential tools for navigating the world’s most liquid market. From hedging and carry trades to arbitrage, fundamentals, technicals, safe-haven flows, and algorithmic trading, each strategy serves a unique purpose. While hedging focuses on risk protection, carry trades aim for yield, and technical strategies find opportunities in price patterns. Understanding these concepts helps traders, investors, and businesses make informed decisions in an increasingly interconnected global economy.

Commodity Market Analysis1. Fundamental Analysis of Commodities
Fundamental analysis focuses on demand and supply. Unlike stocks, commodities have no earnings or balance sheets — they are influenced by production, consumption, and global events.
Below are key fundamental factors that move different commodities:
A. Energy Commodities (Crude Oil, Natural Gas)
Crude Oil
Crude oil prices depend mainly on:
OPEC+ decisions (production cuts or increases)
US crude inventory reports
Middle East geopolitical tensions
Global economic growth (energy consumption)
US Dollar Index (inverse relation)
Example:
If OPEC announces a production cut, supply decreases → crude oil prices rise.
Natural Gas
Natural gas is influenced by:
Weather conditions (winter increases heating demand)
Storage inventory levels
Gas production & LNG exports
High summer temperatures also increase electricity demand (air conditioners), boosting gas usage.
B. Precious Metals (Gold, Silver)
Gold is not just a commodity — it's a safe-haven asset.
Factors affecting gold:
Inflation data (higher inflation → higher gold)
Interest rate decisions (Federal Reserve)
Dollar Index (strong dollar → weak gold)
Global uncertainties (wars, recession fears)
Silver moves with:
Industrial demand (solar panels, electronics)
Gold correlation
Economic cycles
C. Base Metals (Copper, Aluminium, Zinc, Nickel)
Base metals depend heavily on global economic activity.
Key drivers:
China’s economic data (largest consumer of industrial metals)
Infrastructure spending worldwide
Manufacturing & construction demand
Mining output and strikes
Example:
If China announces a stimulus package → copper demand rises → copper prices increase.
D. Agricultural Commodities (Wheat, Soybean, Cotton, Sugar)
Agri-commodities depend on:
Weather (rainfall, drought, frost)
Government MSP policies
Crop cycles
Exports & imports
Example:
A weak monsoon in India → lower wheat production → wheat prices rise.
2. Technical Analysis in Commodity Markets
Technical analysis studies price action, chart patterns, volume, market structure, and indicators to identify trade setups.
Traders commonly use:
A. Candlestick Patterns
Bullish engulfing at support in gold
Shooting star in crude oil after a rally
Hammer in natural gas at bottom levels
Candlestick analysis helps identify market psychology.
B. Chart Patterns
Popular patterns in commodities:
Double tops (crude oil reversal)
Triangles (gold consolidation during FOMC weeks)
Channels (copper trending phases)
Head and Shoulders (major reversals)
Patterns show potential breakout and breakdown zones.
C. Indicators Used in Commodity Trading
Moving Averages (20, 50, 100, 200 MA)
Used to identify the trend direction.
RSI
Identifies overbought/oversold conditions.
MACD
Shows momentum shifts.
Bollinger Bands
Useful in gold and silver for breakout entries.
Volume Profile
Helps identify high-volume zones (strong support/resistance).
Since you like volume profile, this becomes important in crude & metals.
D. Market Structure Analysis
Study of:
Higher highs / higher lows
Supply and demand zones
Break of structure (BOS)
Liquidity zones
Commodities often respect clean market structure because institutions heavily participate.
Example:
Crude oil forms HH-HL structure above 50 EMA → bullish trend confirmed.
3. Sentiment & Intermarket Analysis
Commodity markets react strongly to sentiment and cross-asset relationships.
A. Dollar Index (DXY) Impact
Gold and silver move opposite to DXY
Crude also weakens when dollar strengthens
Reason: Commodities are priced in USD globally.
B. Bond Yields
High bond yields → gold falls
Low bond yields → gold rises
Gold is a zero-yielding asset, so yields compete with gold.
C. Risk-On vs Risk-Off Sentiment
Risk-off: War, recession fear → gold ↑
Risk-on: Economic growth → crude, copper ↑
Sentiment plays a huge role in short-term movements.
D. Inventory Reports
Weekly reports that move markets sharply:
EIA Crude Oil Inventory
API Inventory
Natural Gas Storage Report
Lower inventories → prices rise
Higher inventories → prices fall
4. How to Do Practical Commodity Market Analysis
Here’s a simple but powerful approach you can use daily:
Step 1: Check Global News & Macroeconomic Events
Look for:
Fed speeches
Inflation data
OPEC announcements
Weather updates
War-related headlines
These set the market bias.
Step 2: Identify Trend Using Technicals
Use:
50 & 200 EMA
Market structure
Volume profile zones
Mark supply-demand areas.
Step 3: Use Sentiment Indicators
Check:
Dollar Index
Bond yields
Equity market sentiment
VIX (volatility index)
These help you understand whether safe-haven commodities or industrial commodities will move.
Step 4: Wait for Price Action Confirmation
Look for:
Breakouts
Retests
Reversal candlestick patterns
Volume confirmation
This protects you from false moves.
Step 5: Apply Risk Management
Commodity markets are volatile.
Keep:
Proper stop-loss
Limited position sizing
Avoid over-trading during news events
5. Why Commodity Market Analysis Is Important
High Volatility = Good Opportunities
Commodities give wide movements, helpful for intraday and swing traders.
Hedge Against Inflation
Gold, silver, and crude move sharply during inflation cycles.
Global Market Connectivity
Commodity prices influence stock sectors like:
Oil & gas
Metals & mining
FMCG and agriculture
Useful for Investors and Traders Both
Whether you trade MCX, futures, or ETFs, analysis gives clarity.
6. Conclusion
Commodity market analysis is a powerful combination of fundamentals, technicals, sentiment and intermarket relationships. A successful commodity trader understands how global events, economic trends, weather patterns, and institutional activity influence price movements.
By studying:
Supply–demand fundamentals
Chart structure and volume profile
Dollar index and bond yields
Inventory reports and geopolitical news
…you can predict commodity market trends more accurately and make informed trading decisions.
Global Market Strategies1. Global Macro Strategy
One of the most powerful and widely used strategies, especially by hedge funds, is Global Macro Trading.
This approach focuses on big-picture economic and geopolitical trends.
Key components include:
Interest rate cycles (Fed, ECB, BOE, BOJ decisions)
Inflation and CPI trends
GDP growth patterns
Currency strength/weakness
Commodity cycles (oil, gold, metals)
Geopolitical events (wars, sanctions, elections)
A macro trader might buy U.S. equities if the Federal Reserve cuts interest rates, short the Japanese Yen if BOJ maintains ultra-low rates, or buy gold during heightened geopolitical tension.
Why macro works globally:
Because global markets respond instantly to large events, macro traders aim to stay ahead of the curve by predicting economic outcomes.
2. Global Equity Long/Short Strategy
Equity Long/Short is popular among hedge funds and global investors. It involves:
Going long (buying) stocks expected to rise
Going short (selling) stocks expected to fall
Example:
A fund manager might:
Go long on the U.S. technology sector (Apple, Nvidia)
Go short on underperforming sectors (e.g., struggling retail companies)
Advantages:
Protects from market-wide crashes
Generates returns in both rising and falling markets
Helps balance risk via sector or regional hedging
Global investors often diversify across continents:
U.S. large-cap tech
European industrials
Emerging market banks
Asian semiconductors
This diversification smoothens volatility.
3. Global Asset Allocation Strategy
This long-term strategy distributes capital across countries and asset classes to balance risk and reward.
Typical allocation:
40% Global Equities
30% Bonds (US, EU, Japan)
15% Commodities
10% Real Estate (REITs)
5% Cash or short-term bills
Global diversification helps because:
U.S. markets may outperform during tech cycles
European markets may lead during industrial expansion
Emerging markets outperform during commodity supercycles
Asset allocation ensures the portfolio performs consistently in changing environments.
4. Currency (Forex) Trading Strategies
Currencies are influenced by global trade flows, central bank policy, geopolitical news, and economic data releases.
Popular global forex strategies include:
a) Carry Trade
Borrowing money in a low-interest-rate currency like the Japanese Yen (JPY) and investing in a high-interest-rate currency like the Indian Rupee (INR) or Mexican Peso (MXN).
b) Trend Following
Riding the direction of strong currency trends:
USD strengthening during rate hikes
EUR falling during recession fears
c) News Trading
Trading on major events like:
Non-Farm Payrolls (NFP)
Interest rate decisions
GDP releases
Forex trading is extremely liquid and operates 24x5, making it central to global strategies.
5. Commodity Trading Strategies
Commodities like crude oil, gold, natural gas, wheat, copper are driven by global demand-supply forces, weather patterns, and geopolitics.
Strategies include:
a) Seasonal Trading
Natural gas rises in winter
Agricultural commodities rise during crop shortages
b) Trend/Fundamental Strategy
Buying oil during Middle East tensions
Buying gold during inflation or recession fears
c) Spread Trading
Taking advantage of price differences between related commodities, such as crude oil vs. refined products (crack spread).
Commodities play a critical role in inflation hedging.
6. Global Arbitrage Strategies
Arbitrage strategies exploit price differences across markets, exchanges, or assets.
Types include:
a) Statistical Arbitrage
Using algorithms to find mispricing between correlated assets.
b) Triangular Forex Arbitrage
Exploiting tiny currency price discrepancies in three-way pairs like USD/EUR, EUR/GBP, GBP/USD.
c) Cross-border arbitrage
Example:
Buying a stock cheaper on the Tokyo Exchange and selling it at a higher price on the NYSE.
These strategies require:
High-speed execution
Strong quantitative models
Access to multiple exchanges
7. Emerging Market (EM) Strategies
Emerging economies like India, Brazil, China, Vietnam, and Indonesia offer high growth but high risk.
Strategies involve:
Investing in sectors with strong demographics (banking, tech, consumption)
Focusing on currency stability and inflation control
Tracking foreign institutional investor (FII) flows
Watching political stability and trade policies
EMs are attractive due to:
Rapid GDP growth
Expanding middle class
Strong manufacturing and digital markets
But they are vulnerable to:
Global rate hikes
Commodity price swings
Currency depreciation
Thus, EM strategies mix both growth and risk management.
8. Global Fixed-Income Strategy
Global bond investors focus on:
Interest rate cycles
Sovereign bond yields
Inflation expectations
Key strategies:
a) Yield Curve Trading
Predicting steepening or flattening of government bond yield curves.
b) Credit Spread Trading
Buying corporate bonds when spreads are wide and selling when they contract.
c) Currency-Hedged Bond Investing
Investing in foreign bonds while hedging currency risk.
Fixed-income strategies are essential for pension funds, sovereign wealth funds, and long-term global investors.
9. Quantitative Global Strategies
Quant traders rely on:
Algorithms
Mathematical models
Machine learning
Statistical analysis
Popular quant strategies:
High-Frequency Trading (HFT)
Algorithmic arbitrage
Momentum/trend algorithms
Mean reversion strategies
Multi-factor models (value, momentum, size, quality)
Quant strategies help remove emotional decision-making and operate at high speed across global markets.
10. ESG & Sustainable Investing Strategy
Global investors increasingly focus on:
Environmental sustainability
Social responsibility
Corporate governance (ESG)
Examples:
Investing in renewable energy companies
Avoiding tobacco or weapons manufacturers
Prioritizing firms with low carbon footprints
ESG strategies attract long-term institutional capital and are becoming mainstream globally.
Conclusion
Global market strategies are powerful tools for navigating the complex, interconnected world of international finance. Whether based on macroeconomics, equities, currencies, commodities, arbitrage, or quantitative methods, each strategy aims to balance risk and reward while taking advantage of global opportunities.
Successful global investors:
Understand cross-country correlations
Track central bank policies
Monitor global macro trends
Diversify across asset classes
Use risk management and hedging techniques
By combining these strategies, traders and investors can navigate global markets confidently and consistently.

Algo's Logic: Why price moves ''crazy'' with red folder news?WHY PRICE MOVES LIKE THIS
The market is not a chaotic auction of buyers and sellers seeking fair value; it is a highly engineered delivery system designed to seek and destroy liquidity. The current consolidation you see is not indecision; it is a 'Liquidity Coil'. The algorithm is purposefully compressing price action ahead of the 'Red Folder' events to engineer a 'Straddle Inducement'.
By keeping the range tight, the Interbank Price Delivery Algorithm (IPDA) encourages retail traders to place tight buy-stops above the range and tight sell-stops below it. This creates two massive pools of liquidity—fuel for the machine. The news event is not the cause of the move; it is the 'Key' that unlocks this volatility. The initial move is almost always a 'Judas Swing'—a fraudulent manipulation designed to trigger one side of these stops (usually the sell-stops below) to harvest the necessary liquidity to fuel the *real* move in the opposite direction. We do not trade the news; we trade the algorithmic reaction to the liquidity harvest.
THE THESIS
The algorithm is currently in a 'Suspended State' of pre-event accumulation utilizing the impending volatility of the Macro Data Injection to engineer a classic 'Judas Swing' manipulation. The narrative is strictly governed by the 'Seek and Destroy' protocol: The market will utilize the news release to aggressively harvest the internal Sell-Side Liquidity (SSL) resting below the 25,550.00 shelf to fuel the terminal expansion towards the external Buy-Side Liquidity (BSL) at 25,900.00.
THE EXECUTION VECTOR
Entry: 25,525.00 (Buy Limit / Post-News Reclaim)
Stop loss: 25,380.00 (145.00 points)
Take profit: 25,950.00 (425.00 points)
Risk to reward ratio: 2.93R
THE CAUSAL RATIONALE
The Pre-News Narrative (The Trap)
Current price action (25,650.00) is a 'Volatility Compression' zone. The algorithm is holding price in a narrow range. Do not trade the drift. The drift is the bait. The algorithm is waiting for the 08:30 AM / 10:00 AM timestamp to unlock the high-velocity engine. The 'Red Folders' are simply the authorized time windows for the Market Makers to reprice the asset.
The News Event (The Judas Swing)
Upon the data release, expect an immediate, violent displacement. The highest probability vector is a 'False Bearish Breakout' (The Judas Goat). The algorithm will likely spike price DOWN into the 25,550.00 - 25,500.00 region. This serves two purposes:
1. Trigger the sell-stops of the overnight longs.
2. Induce breakout sellers to provide the necessary Buy-Side liquidity for the Smart Money to fill their long orders at a discount.
The Post-News Expansion (The Real Move)
Once the SSL is harvested and the 25,500.00 region (Bullish Order Block / FVG) is mitigated, look for an impulsive reclaim of the 25,600.00 level. This 'Sponsorship' signal confirms that the low is in, and the algorithm will switch to a 'Low Resistance Liquidity Run' targeting the clean highs at 25,900.00.
THE INVALIDATION (THE OMEGA POINT)
The bullish news model is ontologically corrupted if the news candle displaces below 25,380.00 and *sustains* acceptance there (15-minute close). A simple wick is not invalidation; it is a feature. But a closure below this level implies the macro data has triggered a 'Risk-Off' regime shift, targeting deeper discount arrays at 25,000.00.
KEY TRAJECTORY WAYPOINTS
Target 1: 25,750.00 | Type: Equilibrium / Initial Rebound | Probability: 90%
Target 2: 25,900.00 | Type: External Buy-Side Liquidity | Probability: 75%
Target 3: 26,100.00 | Type: Blue Sky Expansion | Probability: 40%
THE SHADOW REALITY
A 30% probability exists for the 'Bull Trap' scenario. In this reality, the news spikes price UP first into 25,850.00. If the first move is UP, fade it. The algorithm rarely gives the true move first during high-impact news.
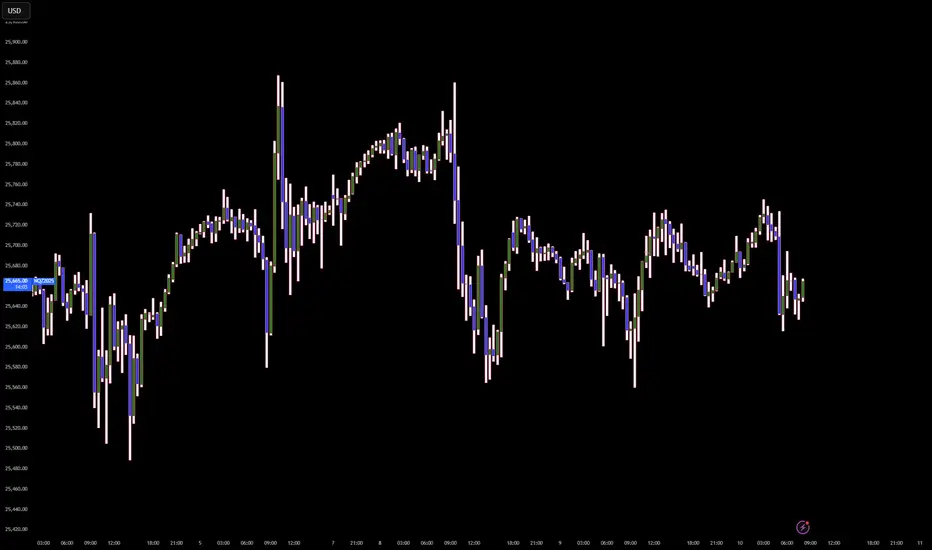
Emerging Market vs Developed Market1. Definitions
Developed Markets
Developed markets are countries with high economic maturity, advanced financial systems, strong institutions, and stable political environments. Their characteristics include high GDP per capita, industrial sophistication, deep capital markets, and steady (though slower) economic growth. Examples include USA, UK, Canada, Japan, Germany, France, Australia, and Singapore.
Emerging Markets
Emerging markets are economies transitioning from developing to developed status. They show rapid industrialization, expanding middle-class populations, improving institutions, and increasing integration with global markets. Examples include India, China, Brazil, Indonesia, South Africa, Mexico, Turkey, and Vietnam.
2. Key Characteristics
2.1 Economic Growth
Emerging Markets:
Faster GDP growth, driven by urbanization, industrial expansion, rising consumption, digital adoption, and favorable demographics. Annual growth often ranges from 4–7%.
Developed Markets:
Slower but stable growth, typically 1–3%, due to market maturity, ageing demographics, and saturated industries.
Implication: EMs offer growth potential; DMs offer stability.
2.2 Income Levels and Living Standards
Developed Markets:
High income, advanced infrastructure, strong social welfare systems, high productivity.
Emerging Markets:
Lower but rapidly rising incomes, infrastructure still developing, large segments transitioning to formal economy.
2.3 Financial Markets and Institutions
Developed Markets:
Deep, liquid, and highly regulated financial markets. Stock exchanges (e.g., NYSE, NASDAQ, LSE) exhibit high transparency and strong corporate governance.
Emerging Markets:
Growing markets but with lower liquidity, higher volatility, and varying investor protections. Institutional reforms are ongoing.
2.4 Currency Stability
Developed Markets:
Stable currencies, low inflation, credible central banks.
Emerging Markets:
More prone to currency fluctuations, inflation spikes, and external shocks due to reliance on imported commodities and foreign capital.
2.5 Political and Regulatory Environment
Developed Markets:
Predictable policies, rule of law, strong regulatory systems.
Emerging Markets:
More political uncertainty, policy shifts, regulatory inconsistencies. However, some EMs like India are rapidly improving regulatory transparency.
2.6 Demographics
Emerging Markets:
Young, expanding populations — a positive for long-term consumption and labor supply.
Developed Markets:
Ageing populations — leading to higher healthcare spending, slower consumption growth, and labor shortages.
3. Opportunities in Emerging vs Developed Markets
3.1 Investment Opportunities
Emerging Markets
Higher returns due to rapid growth.
Sectors like technology, fintech, manufacturing, renewable energy, and infrastructure show exceptional potential.
Underpenetrated markets allow companies to grow at scale.
Developed Markets
Stable and predictable returns.
Strong corporate governance and reduced risk of fraud or systemic failures.
Advanced industries like AI, biotechnology, cloud computing, clean tech, and high-end manufacturing.
3.2 Consumer Market Potential
EMs have massive, growing middle classes. Consumption is expected to double in many EMs in the next two decades.
DMs have saturated markets, with growth reliant on innovation rather than new customers.
3.3 Capital Flows
Investors often chase high growth in EM equities, debt, and startups.
DMs attract long-term, stable institutional capital due to reliability of returns.
4. Risks in Emerging vs Developed Markets
4.1 Market Volatility
Higher in EMs, due to currency risks, political events, commodity dependence, and lower liquidity.
DMs show lower volatility thanks to robust financial systems.
4.2 Geopolitical and Policy Risks
EMs often face elections, reforms, or geopolitical pressures that can shift markets abruptly.
DMs are more predictable, although events like Brexit or US political gridlocks still create uncertainty.
4.3 Currency and Inflation Risks
EM currencies can depreciate sharply in global stress periods.
DMs maintain low inflation and strong central bank credibility.
4.4 Structural Challenges
EMs face challenges like corruption, weak judiciary, infrastructure gaps, and bureaucratic hurdles.
DMs deal with challenges like high public debt, low productivity growth, and ageing populations.
5. Comparative Overview
5.1 Growth vs Stability
Emerging markets = growth, opportunity, volatility
Developed markets = stability, safety, lower returns
5.2 Innovation and Technology Adoption
DMs lead in innovation due to research ecosystems.
EMs leapfrog technology — e.g., India’s digital payments boom, China’s e-commerce leadership.
5.3 Trade and Globalization
EMs are increasingly integrated into global supply chains.
DMs dominate global trade policies, IMF, World Bank, and monetary influence (USD, Euro, Yen).
5.4 Corporate Structures
DMs have multinationals with global footprints.
EMs are producing new giants (e.g., Reliance, Tata, Alibaba, BYD, Samsung).
6. Examples
Emerging Markets
India: Fastest-growing major economy, tech innovation, digital transformation.
China: Manufacturing hub, consumption growth.
Brazil: Natural resources, agriculture economy.
Indonesia & Vietnam: Manufacturing and consumption boom.
Developed Markets
USA: World’s largest and most innovative economy.
Japan: High-tech industries, strong institutions.
Germany: Industrial powerhouse.
UK & Canada: Stable financial systems.
7. Which Is Better for Investors?
Emerging Markets Are Ideal If You Want:
High long-term growth potential
Exposure to rising consumption
High-return equity opportunities
Portfolio diversification
Developed Markets Are Ideal If You Want:
Safety and predictability
Lower volatility
Strong governance
Blue-chip stability
Best Strategy:
A balanced portfolio that mixes both — e.g., EM for growth + DM for stability — provides optimal long-term results.
8. Conclusion
Emerging and developed markets represent two ends of the global economic spectrum. Emerging markets offer high growth, rising consumer demand, innovation, and long-term opportunities, but with higher risks and volatility. Developed markets deliver stability, security, and robust institutions, though with slower growth.
Understanding the differences helps investors, businesses, and policymakers choose the right strategies. In today’s interconnected world, both market types are essential components of global economic progress. A combination of the dynamism of emerging markets and the reliability of developed markets provides a balanced and powerful approach to global investment and economic engagement.
Sustainable Investing in the World Market1. What Is Sustainable Investing?
Sustainable investing integrates Environmental, Social, and Governance (ESG) criteria into investment decisions to generate long-term financial returns while having a positive global impact.
Environmental (E)
Focuses on:
Carbon emissions
Renewable energy adoption
Waste management
Water usage
Biodiversity protection
Social (S)
Covers:
Labor standards
Diversity and inclusion
Community impact
Health and safety
Human rights
Governance (G)
Includes:
Board structure
Executive compensation
Shareholder rights
Ethical business practices
Transparency in reporting
Companies with strong ESG practices often demonstrate operational efficiency, lower regulatory risk, and a forward-thinking culture—all of which contribute to stable and sustainable long-term value.
2. Why Sustainable Investing Is Growing in the Worldwide Market
a. Climate Change and Global Environmental Risks
Climate change has become a financial risk, not just an environmental issue. Floods, extreme heat, rising sea levels, and supply chain disruptions influence corporate earnings. As a result, global investors now demand that companies disclose climate risks and decarbonization plans.
b. Government Regulations and Global Policies
Countries like the U.S., European Union, Canada, Japan, and India have introduced regulations requiring:
ESG disclosures
Carbon neutrality targets
Green finance frameworks
Penalties for environmental violations
The EU’s Sustainable Finance Disclosure Regulation (SFDR) and India's BRSR (Business Responsibility and Sustainability Reporting) are strong examples.
c. Consumer and Stakeholder Expectations
Modern customers prefer brands that:
Use renewable energy
Maintain ethical supply chains
Treat workers fairly
Millennials and Gen Z, who will dominate future investment flows, strongly prefer sustainable portfolios.
d. Corporate Responsibility and Reputation
Companies with strong ESG scores often enjoy:
Better credit ratings
Lower cost of capital
Stronger brand loyalty
Higher employee productivity
This drives more corporations to adopt ESG policies, reinforcing the trend.
e. Performance and Profitability
Contrary to old beliefs, sustainable investing does not sacrifice returns. Many ESG-focused indexes—such as MSCI ESG Leaders—have matched or outperformed traditional benchmarks over the years. Sustainable businesses tend to be:
More resilient
Less exposed to environmental fines
Better at governance
More adaptable to technological change
3. Global Sustainable Investment Strategies
Sustainable investing is broad and flexible. Major strategies include:
1. ESG Integration
The most widely used approach. Here, ESG scores are systematically used in traditional financial analysis. Portfolio managers evaluate:
Carbon footprint
Board diversity
Risk governance
Labor policies
Investment decisions balance ESG data with revenue, valuations, debt, cash flows, and other financial metrics.
2. Negative or Exclusionary Screening
This strategy excludes industries like:
Tobacco
Weapons
Coal mining
Alcohol
Gambling
Hazardous chemicals
It allows investors to avoid supporting harmful sectors while focusing on ethical businesses.
3. Positive Screening
Investors actively choose companies with:
High ESG ratings
Sustainable operations
Strong governance practices
For example, choosing energy companies that are rapidly shifting to renewables.
4. Green and Climate Themed Funds
These funds invest specifically in:
Green energy (solar, wind, hydrogen)
Electric vehicles
Sustainable agriculture
Water technology
Circular economy businesses
Climate-focused funds are expanding fast across the U.S., Europe, and Asia.
5. Impact Investing
Investments intentionally aimed at measurable positive impact, such as:
Affordable housing
Clean energy access
Education technology
Microfinance
Impact investors target financial returns alongside social/environmental benefits.
6. Shareholder Activism
Investors directly push companies to:
Reduce emissions
Improve labor rights
Increase transparency
Adopt ethical sourcing
Large institutional investors (BlackRock, Vanguard, State Street) often lead these engagement strategies.
4. Major Global Markets Leading Sustainable Investing
1. Europe
Europe holds the highest share of ESG capital globally due to:
Strict regulations
Strong public awareness
Policy commitment to carbon neutrality
Countries like Germany, Sweden, Netherlands, and the UK dominate green investments.
2. United States
Despite political debate, the U.S. houses massive ESG funds run by:
BlackRock
Vanguard
Fidelity
Clean energy and tech-driven sustainability are fast-growing segments.
3. Asia-Pacific
Countries like Japan, Singapore, South Korea, and India are catching up quickly. India, specifically, has growing ESG ETFs, BRSR reporting rules, and rising green bond issuance.
4. Emerging Markets
Brazil, South Africa, UAE, and China are investing heavily in:
Renewable power
Green infrastructure
Electric mobility
This makes emerging markets hotspots for future ESG growth.
5. Financial Instruments for Sustainable Global Investing
a. ESG Stocks
Companies with strong ESG scores (ex: Tesla, Ørsted, NVIDIA’s governance upgrades).
b. ESG Mutual Funds & ETFs
Popular global ETFs include:
MSCI Global ESG Leaders ETF
iShares ESG Aware MSCI USA ETF
Vanguard ESG International ETF
c. Green Bonds
Issued to finance:
Renewable energy
Clean transportation
Waste reduction
The green bond market has surpassed trillions of dollars globally.
d. Sustainability-Linked Loans
Loan interest rates shift based on a company’s ESG performance.
6. Challenges in Global Sustainable Investing
1. Greenwashing
Some companies exaggerate their sustainability. Regulators now require stricter guidelines to prevent misleading claims.
2. Lack of Standardized ESG Ratings
Different rating agencies often score the same company differently, creating confusion.
3. Short-Term Market Cycles
Oil prices or political shifts may temporarily favor non-ESG sectors.
4. Limited Data in Emerging Markets
Smaller companies often lack transparent ESG reporting.
7. Future of Sustainable Investing in the World Market
The future is optimistic. Key drivers include:
Global push for Net Zero by 2050
Rise of ESG-focused fintech
AI-based sustainability analytics
Corporate decarbonization roadmaps
Growth in green hydrogen, EVs, and carbon markets
By 2030, sustainable investing is projected to form a major share of global assets under management.
Conclusion
Sustainable investing in the world market is no longer a moral choice—it is a strategic financial decision. As environmental pressures intensify and societies demand ethical business practices, companies with strong ESG foundations gain competitive advantage. Investors focusing on sustainability benefit from lower risk, stronger governance, long-term resilience, and alignment with the future global economy. Sustainable investing enables individuals and institutions to earn returns while supporting a cleaner planet, fairer society, and more transparent global marketplace.

Unlocking Global Market Potentiality1. Understanding Global Market Potentiality
Global market potentiality refers to the capacity of a business, sector, or economy to expand internationally by tapping into new customer segments, geographic regions, or emerging market trends. It includes evaluating:
Market size and future growth trajectory
Consumer behaviour, demographics, and purchasing power
Technological readiness and adoption
Competitive intensity and entry barriers
Regulatory environments and trade policies
Economic cycles and geopolitical stability
The core idea is to identify where the next wave of demand will arise and position your business to serve it early.
2. Why Global Expansion Matters More Than Ever
Several structural shifts make global expansion a necessity rather than an option:
a) Saturation in Domestic Markets
Many industries face slow growth at home due to mature consumption patterns. Global markets offer fresh demand and diversification.
b) Rising Middle Class in Emerging Economies
Asia, Africa, the Middle East, and Latin America are witnessing unprecedented income growth. This expands consumer demand for retail, financial services, healthcare, and technology.
c) Digital Connectivity
E-commerce, online services, fintech, and automation allow a business to reach global customers without heavy physical infrastructure.
d) Supply-Chain Diversification
Businesses can optimize costs, reduce risk, and improve efficiency by sourcing and manufacturing across multiple regions.
e) Competitive Advantage
Companies operating globally gain exposure to innovation, talent, and ideas—accelerating long-term competitiveness.
3. Key Pillars to Unlock Global Market Potentiality
a) Deep Market Research & Intelligence
The first step is thorough market analysis:
TAM, SAM, SOM evaluation
Demand forecasting
Cultural insights and consumer behaviour
Competitor benchmarking
Pricing and localization requirements
Tools such as data analytics, AI-driven forecasting, and global market databases help businesses identify high-potential regions with precision.
b) Understanding Local Regulations
Every market has unique legal requirements:
Import/export rules
Trade agreements and tariffs
Licensing and certifications
Data privacy and digital compliance
Taxation and repatriation of profits
Compliance reduces risk and prevents costly delays. Successful companies take a proactive approach through local legal teams or partnerships.
c) Building a Localized Strategy
A global strategy succeeds only when it feels local. Localization can include:
Tailored product designs
Customized marketing messages
Local languages and cultural alignment
Region-specific pricing
Local payment systems and logistics
For example, payment adoption differs widely—UPI in India, Alipay in China, and card-heavy systems in Europe.
d) Strong Global Brand Positioning
A credible global brand signals trust. Brand positioning should combine universal values (quality, reliability, innovation) with tailored regional messaging.
e) Digital-First Global Entry
Technology accelerates international growth:
E-commerce platforms
Social media for global brand visibility
Cloud-based operations
AI-driven customer segmentation
Cross-border digital payments
SaaS distribution models
Digital entry reduces costs and creates scalable access to multiple markets.
f) Strategic Partnerships & Alliances
Local partners accelerate learning and reduce risk:
Distributors and channel partners
Local manufacturers
Franchise operators
Government or regulatory coordination
Joint ventures for shared expertise
These partnerships help companies navigate cultural, legal, and logistical challenges.
g) Flexible Global Supply Chain & Operations
Operational excellence is key to serving global demand:
Multi-country manufacturing
Nearshoring or friend-shoring
Smart warehousing
Real-time logistics tracking
Vendor diversification
Resilient supply chains protect a business against disruptions like political instability, pandemics, and climate events.
4. Emerging High-Potential Global Markets
Several regions now present outsized opportunities:
1. Asia-Pacific
India, China, Indonesia, Vietnam, Philippines → Rapid urbanization and digital-first consumers.
2. Middle East & GCC
Saudi Arabia & UAE → Economic diversification, luxury demand, infrastructure investment.
3. Africa
Kenya, Nigeria, South Africa → Rising digital adoption, youthful population, fintech growth.
4. Latin America
Brazil, Mexico, Chile → Expanding middle class and commodity-driven growth.
Each region offers distinct opportunities in sectors like fintech, renewable energy, EVs, healthcare, edtech, logistics, and consumer goods.
5. Industry Sectors with the Highest Global Potential
a) Technology & Digital Services
AI, cloud computing, cybersecurity, automation, SaaS, digital payments.
b) Healthcare & Pharmaceuticals
Demand increasing due to aging populations, chronic diseases, and biotechnology.
c) Renewable Energy
Solar, wind, hydrogen, green technology, EV ecosystem.
d) Consumer Goods & Retail
Apparel, FMCG, lifestyle products, luxury retail.
e) Infrastructure & Real Estate
Smart cities, construction, urban development.
f) Agriculture & Food Processing
Global food security and supply chain modernization.
g) Financial Services
Fintech, insurance, wealth management, cross-border investing.
6. Risks in Global Expansion & How to Mitigate Them
Unlocking global potential also involves addressing risks:
a) Geopolitical Instability
Use diversified markets and supply chains to minimize exposure.
b) Currency Volatility
Hedge using forex instruments or multi-currency accounts.
c) Cultural Misalignment
Invest in localization and local leadership teams.
d) Regulatory Complexity
Maintain compliance through legal counsel and continuous monitoring.
e) Competitive Pressure
Innovate faster, build brand loyalty, and offer differentiated value.
f) Operational Challenges
Adopt scalable digital infrastructure and supply-chain automation.
7. The Role of Innovation in Global Success
Innovation is the engine that unlocks global potential:
AI-driven product development
Manufacturing automation
Sustainability and green innovation
Data-led decision-making
Digital-first customer interfaces
Companies that innovate grow faster, capture new segments, and outperform global competitors.
8. Building a Future-Ready Global Strategy
A strong global strategy includes:
Vision: Clear long-term goals
Market Prioritization: Choosing high-ROI markets
Execution Framework: Market entry → expansion → consolidation
Resource Allocation: Capital, talent, technology
Continuous Learning: Monitoring trends and adapting
This ensures that the business remains resilient, competitive, and scalable across markets.
Conclusion
Unlocking global market potentiality is not a one-time decision—it is a continuous strategic journey. Companies that successfully globalize benefit from expanded customer bases, diversified revenue streams, innovation exposure, and long-term resilience. With the right combination of market research, localization, regulatory alignment, digital strategy, partnerships, and supply chain strength, businesses can turn global opportunities into sustainable success. The future belongs to companies that think internationally, act strategically, and adapt quickly to global change.
Trading Wedges - Quick Guide in 5 StepsWelcome back everyone to another guide, today we will speed run "Trading wedges" in a quick 5 step guide. Be sure to like, follow and join the community!
1) Identify the wedges:
- Falling Wedge
- Rising Wedge
- Symmetrical Wedge (Triangle)
2) Identify Breakout Direction:
- Falling Wedge > Bullish Breakout Expected
- Rising Wedge > Bearish Breakout Expected
- Symmetrical Wedge (Triangle) > Consolidation Expected
Breakout should show a candle closing outside the wedge.
3) Wait for retest to take place on previous key level or resistance (which would now be support)
If the retest holds with a strong rejection candle or consolidation - begin to long.
4) Enter Trade:
Enter on successful retest confirmation
SL for longs should be below previous low's
SL for shorts should be above previous highs.
5) TP levels:
TP 1) First high target
TP 2) Second high target
TP 3) Third high target.
RESULTS:
Price has soared up high and hit all three Take profits.
For trader who are wanting more profits you can potentially enable TP trailing afterwards - however I don't recommend this as you need to factor in your emotions of "GREED"
Thank you all so much for reading! Hopefully this is a useful guide in the future or present! If you would like me to make any simplified guides, let me know in the comments below or contact me through trading view!
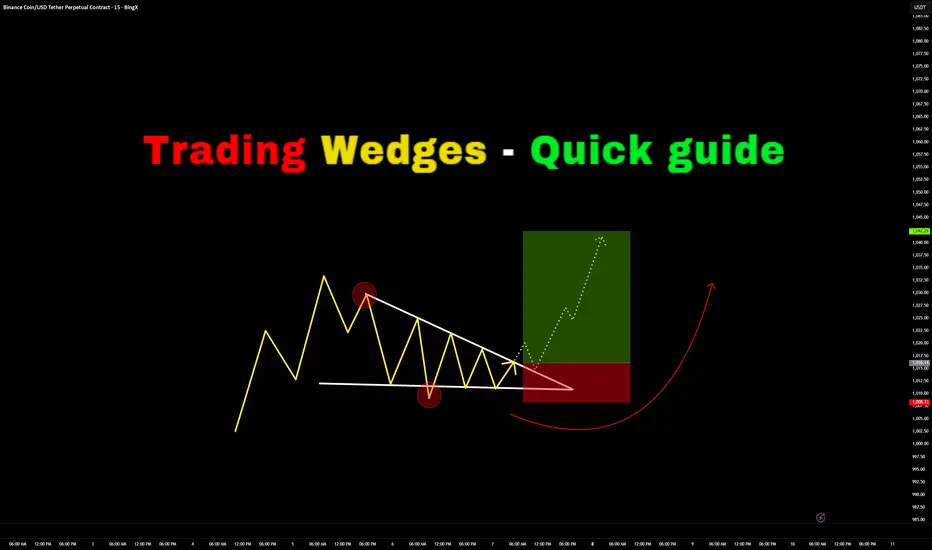
ESG Investing and Green Finance1. Understanding ESG: Environmental, Social, and Governance
ESG investing involves evaluating companies not only on financial performance but also on how well they manage environmental, social, and governance risks and opportunities. It helps investors identify sustainable businesses that are better positioned for long-term growth.
1.1 The Environmental Component (E)
This dimension examines how a company impacts the planet. Key factors include:
Carbon emissions and climate impact
Energy efficiency and renewable energy usage
Waste management and recycling
Water usage and conservation
Biodiversity protection
Investors focus on whether a company has strategies to reduce climate risk, comply with environmental regulations, and transition towards greener operations.
1.2 The Social Component (S)
This pillar evaluates a company's relationship with people—employees, customers, suppliers, and communities. It includes:
Labor rights, wages, and workplace safety
Diversity, equity, and inclusion (DEI)
Customer privacy and data protection
Human rights across supply chains
Community development and social welfare initiatives
Companies with strong social practices tend to have better employee retention, improved brand reputation, and lower legal risks.
1.3 The Governance Component (G)
Governance is about the ethical and transparent management of a company. Criteria include:
Board independence and diversity
Shareholder rights and protections
Anti-corruption policies
Executive compensation linked to performance
Transparent reporting and accountability
Good governance reduces the chances of scandals, fraud, and mismanagement, making the company a safer long-term investment.
2. ESG Investing in Practice
2.1 ESG Screening Methods
Investors use different strategies to integrate ESG:
Negative Screening: Excludes harmful industries (tobacco, weapons, coal).
Positive Screening: Selects companies with high ESG scores.
Best-in-Class Selection: Chooses top performers in each sector.
Integration Approach: Combines ESG data into financial analysis.
Active Ownership: Investors influence companies through voting and engagement.
2.2 ESG Ratings and Data Providers
Agencies like MSCI, Sustainalytics, Refinitiv, and S&P Global provide ESG scores. These ratings help investors compare companies and assess risks.
2.3 Why ESG Investing Is Growing Rapidly
Several forces are driving global adoption:
Climate change concerns
Government regulations and carbon policies
Demand from millennials and Gen-Z investors
Corporate transparency and pressure from stakeholders
Better long-term risk-adjusted returns
Research shows that companies with high ESG performance often deliver higher resilience during economic downturns and more stable cash flows.
3. Green Finance: Capital for a Sustainable Future
Green finance refers to financial instruments and investments specifically designed to support environmentally friendly projects. While ESG investing evaluates companies broadly, green finance channels capital exclusively toward environmental sustainability.
3.1 Key Components of Green Finance
Green Bonds
These are debt instruments where funds are used for climate or environmental projects such as solar plants, wind farms, green buildings, or pollution reduction.
They are issued by governments, corporations, and global institutions.
Green Loans
Loans provided to businesses for sustainable and energy-efficient projects.
Sustainability-Linked Bonds (SLBs)
Interest rates vary depending on a company’s achievement of sustainability targets such as emission reductions.
Climate Funds
Investment pools dedicated to renewable energy, carbon reduction, and environmental innovation.
Carbon Markets and Credits
Companies purchase carbon credits to offset emissions, promoting global decarbonization.
Green Banks
Specialized financial institutions supporting low-carbon infrastructure.
3.2 Priority Sectors in Green Finance
Green finance focuses on sectors with high environmental impact:
Renewable energy (solar, wind, hydro)
Electric mobility and battery technologies
Green buildings and energy-efficient infrastructure
Waste management and recycling
Water treatment and desalination
Sustainable agriculture
Climate adaptation and resilience projects
4. How ESG and Green Finance Work Together
While ESG investing evaluates a broad spectrum of ethical factors, green finance is narrowly targeted at environmental impact. Yet, both frameworks complement each other:
ESG encourages companies to adopt sustainable behavior, improving overall corporate responsibility.
Green finance provides funding for environmentally beneficial projects.
Together, they push global markets toward decarbonization, resource efficiency, and ethical governance.
For example, an energy company with strong ESG scores may issue green bonds to finance its transition from coal to renewable energy. Institutional investors, looking for sustainable portfolios, buy these bonds—creating a cycle of positive environmental impact and financial returns.
5. Benefits of ESG Investing and Green Finance
5.1 For Investors
Better risk management (climate, legal, and reputational).
Potential for long-term stable returns.
Alignment with future regulatory trends.
Access to innovative sectors like clean energy and sustainable tech.
5.2 For Companies
Lower cost of capital due to ESG-focused investors.
Stronger brand identity and customer loyalty.
Enhanced operational efficiency through sustainable practices.
Better compliance with environmental regulations.
5.3 For Society and the Environment
Reduced carbon emissions and pollution.
Promotion of clean energy and green technologies.
Improved labor conditions and community welfare.
More ethical and transparent corporate behavior.
6. Challenges and Criticisms
Despite rapid growth, ESG and green finance face several obstacles.
6.1 Greenwashing
Some companies exaggerate sustainability claims to attract investors. This undermines trust and calls for stricter reporting standards.
6.2 Lack of Standardization
Different ESG rating agencies use different methodologies, leading to inconsistent scores.
6.3 Data Quality Issues
Many companies do not disclose complete or accurate ESG data.
6.4 Balancing Returns vs Sustainability
Some investors believe ESG restrictions may limit short-term profits. However, long-term benefits are increasingly evident.
7. The Future Outlook
ESG investing and green finance are expected to dominate global markets.
Key trends include:
Mandatory climate disclosures by companies
Rise of sustainable index funds and ETFs
Growth in green bond markets
AI-driven ESG analytics
Government incentives for clean energy
Integration of biodiversity and natural capital into finance
Financial institutions, governments, and corporations are aligning capital flows with sustainability goals such as the Paris Agreement and UN SDGs.
Conclusion
ESG investing and green finance mark a new era where profits and purpose converge. Investors are no longer satisfied with traditional financial metrics; they want companies to deliver long-term value while safeguarding the environment and society. ESG frameworks help identify responsible businesses, and green finance mobilizes capital for sustainable projects. Together, they build a financial ecosystem that promotes resilience, ethical conduct, and environmental protection. As global challenges intensify, ESG and green finance will continue shaping the future of economic development—driving the world towards a greener, more inclusive, and more sustainable future.
Invest Globally for Great Growth1. Why Invest Globally?
1. Diversification Beyond Local Risks
Every country faces its own economic cycles, policy changes, political uncertainties, and currency fluctuations. By investing globally, you spread your capital across different markets, reducing the risk that any one economy’s downturn will harm your overall portfolio. For example, if India or the US slows down, growth in Europe, Southeast Asia, or Latin America may balance the impact.
2. Access to Innovation Worldwide
No single country leads in every industry.
The US dominates technology and biotech.
Europe is strong in automation, renewable energy, and luxury goods.
China excels in manufacturing, EVs, and AI hardware.
Emerging markets lead in digital payments, mobile users, and consumption-led growth.
Global investing allows you to “own the best of the world.”
3. Capture Growth in Emerging Markets
Fast-growing countries like India, Vietnam, Indonesia, Brazil, and the Philippines grow faster than many developed nations. Rising incomes, urbanization, young populations, and new industries create high-growth opportunities that are unavailable in slow-growing economies.
4. Protection Against Currency Risk
A global portfolio naturally hedges currency exposure. When one currency depreciates, another may strengthen, which stabilizes your investment value in your home currency.
2. Key Global Asset Classes for Great Growth
1. Global Equities
Stocks provide the highest long-term returns among major asset classes. Global equity investing includes:
Developed Markets (US, UK, Japan, Germany)
Emerging Markets (India, China, Brazil, South Africa)
Frontier Markets (Vietnam, Nigeria, Bangladesh)
You may invest through:
Global index funds
Country-specific ETFs
International mutual funds
ADRs (American Depository Receipts)
The biggest advantage: exposure to global giants like Apple, NVIDIA, Samsung, Toyota, Nestlé, LVMH, and more.
2. Global ETFs
Exchange-Traded Funds provide diversified exposure at low cost. Popular categories include:
MSCI World ETF
MSCI Emerging Markets ETF
S&P 500 ETF
Global Tech ETF
Global Healthcare & Pharma ETF
Clean Energy ETF
ETFs allow you to invest in hundreds of companies across nations in one trade.
3. International Bonds
Bonds provide stability and income. Investing globally gives access to:
US Treasuries (most stable globally)
Eurozone bonds
Asian government bonds
Global corporate bonds
These act as ballast in a volatile portfolio.
4. Real Assets and REITs
You can invest in:
Global REITs
Infrastructure funds
Global commodity ETFs (gold, oil, metals)
These assets protect against inflation and provide diversification.
5. Alternative Global Investments
Venture capital funds
Private equity
Global hedge funds
International startups (via crowdfunding platforms in some regions)
These offer high potential returns but also higher risk.
3. Global Investing Strategies for Great Growth
1. Core–Satellite Strategy
Your portfolio is built in two layers:
Core (70–80%): diversified global index funds or ETFs (MSCI World, S&P 500, Global Emerging Markets).
Satellite (20–30%): high-growth sectors like AI, EVs, biotech, clean energy, robotics, or country-specific themes.
This balances stability with aggressive growth.
2. Thematic Global Investing
The world is driven by megatrends. High-growth themes include:
Artificial Intelligence
Electric Vehicles & Battery Technology
Green Energy & Climate Tech
Robotics & Automation
Digital Health & Genomics
Cybersecurity
Space Technology
Semiconductors
Investing in global thematic funds lets you catch long-term exponential trends.
3. Country Rotation Strategy
Different countries outperform at different times.
Examples:
US leads in technology
India leads in consumption & digital payments
China leads in EVs
Japan leads in robotics
Europe leads in luxury & renewable energy
Rotating positions across countries can capture high phases of growth.
4. Dollar-Cost Averaging (DCA) Globally
Investing fixed amounts regularly (monthly/quarterly) reduces timing risk and steadily builds global exposure.
5. Risk-Parity Global Allocation
Allocate based on risk, not just geography:
Stocks (global): 60%
Bonds (global): 20%
REITs: 10%
Commodities: 10%
This provides long-term balance across cycles.
4. Risks in Global Investing and How to Manage Them
1. Currency Risk
Foreign currencies fluctuate compared to your home currency.
Solution: Use hedged funds or diversify across many currencies.
2. Political & Regulatory Risk
Geopolitical tensions, sanctions, trade wars, and domestic policy changes impact returns.
Solution: Invest through diversified ETFs instead of concentrating in one high-risk nation.
3. Market Liquidity Risk
Some emerging markets have lower liquidity.
Solution: Prefer large, reputable ETFs and funds.
4. Overexposure to One Country
Many investors buy too many US tech stocks, ignoring Europe or Asia.
Solution: Maintain a balanced global mix.
5. Example of a Balanced Global Growth Portfolio
Aggressive Growth Portfolio Example:
40% US Equities (S&P 500 / Nasdaq)
20% India & Emerging Markets
20% Global Tech / AI / Semiconductor ETFs
10% Europe & Japan Equities
5% Global REITs
5% Gold or global commodities ETF
This mix taps into worldwide growth engines.
6. Benefits of Long-Term Global Investing
1. Higher Compounding Potential
When you own the fastest-growing companies globally, your wealth compounds at a higher pace.
2. Reduced Volatility
A global portfolio is more stable because downturns in one region are offset by growth in another.
3. Access to Worldwide Innovation
You can own stocks driving future revolutions—AI, space, clean tech, biotech.
4. Inflation Protection
Global assets usually hedge long-term inflation.
7. How to Start Investing Globally
Open an international brokerage account (e.g., Interactive Brokers, Webull, Vested, or your region’s global access broker).
Start with broad global ETFs.
Add specific regions (US, Europe, Japan, emerging markets).
Gradually include thematic funds.
Rebalance yearly.
Invest consistently.
Conclusion
Investing globally is one of the smartest ways to achieve great long-term growth. It lets you diversify across continents, participate in worldwide innovation, and capture opportunities unavailable in your home market. A well-structured global portfolio combines stability, growth, and resilience, ensuring your wealth compounds over decades.
Whether you are a beginner or an experienced investor, the world is now open to you. Start small, remain consistent, stay diversified, and allow global compounding to work in your favor.

Global Stock Exchanges1. What Is a Stock Exchange?
A stock exchange is a regulated marketplace where securities such as equities, bonds, and derivatives are traded. It provides:
A platform for buying and selling: Ensures fair and efficient transactions between investors.
Regulation and oversight: Protects market participants via rules, surveillance, and disclosure requirements.
Price discovery: Supply and demand determine the price of a stock; exchanges provide the infrastructure to update prices in real time.
Liquidity: Investors can enter and exit positions easily because exchanges bring thousands to millions of participants together.
Capital raising for companies: By issuing shares in an IPO, businesses grow, expand, and innovate.
2. Key Functions of Global Stock Exchanges
a. Facilitating Capital Formation
Corporate expansion depends heavily on capital. Exchanges allow companies to raise funds from the public by selling ownership (shares). This is more efficient than borrowing because equity does not require regular repayment.
b. Providing Liquidity
A liquid market ensures that securities can be traded quickly without large price fluctuations. High liquidity lowers transaction costs, reduces volatility, and makes markets more attractive to investors.
c. Ensuring Transparency and Fairness
All listed companies must meet stringent disclosure requirements. Real-time price updates, audited annual reports, and regulatory filings prevent information asymmetry.
d. Enabling Diversification
Exchanges offer thousands of instruments across sectors—technology, finance, healthcare, manufacturing, commodities—helping investors build balanced portfolios.
e. Supporting Economic Growth
A well-developed stock exchange promotes efficient capital allocation, encourages entrepreneurship, and attracts global investment.
3. Major Global Stock Exchanges
Around the world, there are dozens of stock exchanges, but a handful dominate in size, technology, and global influence.
a. New York Stock Exchange (NYSE), USA
The world’s largest exchange by market capitalization. Home to giants like Apple, Microsoft, and ExxonMobil. Known for high regulatory standards and deep liquidity.
b. NASDAQ, USA
A fully electronic exchange famous for technology-heavy listings—Google, Amazon, Tesla, Facebook, and Netflix. NASDAQ is often seen as the heart of global innovation.
c. Tokyo Stock Exchange (TSE), Japan
Asia’s largest exchange hosting companies such as Toyota, Sony, and SoftBank. It plays a crucial role in global manufacturing and technology sectors.
d. Shanghai Stock Exchange (SSE) & Shenzhen Stock Exchange (SZSE), China
Two of the fastest-growing exchanges. They reflect China’s economic rise and attract massive domestic and foreign investment despite capital flow restrictions.
e. Hong Kong Stock Exchange (HKEX)
Global gateway to Chinese companies. HKEX allows international investors to access mainland firms via Stock Connect programs.
f. London Stock Exchange (LSE), UK
One of the oldest exchanges. LSE is known for global listings, strong derivatives trading, and its role in European financial markets.
g. Euronext
A pan-European exchange operating across multiple countries like France, Netherlands, Belgium, and Portugal. It unifies European financial markets.
h. Bombay Stock Exchange (BSE) & National Stock Exchange (NSE), India
Two of the world’s most active exchanges by volume. NSE’s NIFTY50 and BSE’s SENSEX serve as benchmarks for one of the fastest-growing major economies.
4. How Global Stock Exchanges Operate
a. Listing Requirements
Companies must meet criteria such as minimum market capitalization, profitability, governance standards, and public shareholding norms. These requirements ensure only credible businesses list on the exchange.
b. Trading Mechanisms
Most modern exchanges use electronic limit order books where computers match buy and sell orders based on price and time priority.
c. Clearing and Settlement
Clearing houses act as intermediaries ensuring both sides of a trade fulfill their obligations. Settlement cycles, such as T+1 or T+2, dictate how quickly ownership transfers and money exchanges hands.
d. Circuit Breakers & Market Surveillance
To prevent crashes or excessive volatility, exchanges impose trading halts if indices move beyond a threshold. Surveillance systems track suspicious activity such as insider trading or price manipulation.
5. Global Interconnectivity of Exchanges
Stock exchanges worldwide are interconnected. Events in one region quickly influence others due to:
International investors and institutions moving capital across borders.
Cross-listings, where a company is listed on multiple exchanges.
ETF and derivative products tied to global indices.
Macroeconomic linkages like interest rates, GDP, inflation, and oil prices.
Technology, enabling instant order execution across continents.
For example, a similar technology sell-off in the U.S. NASDAQ may affect Asian markets the next day, as investors re-allocate risk globally.
6. Globalization and the Rise of Electronic Trading
Technology has radically transformed stock exchanges.
a. High-Frequency Trading (HFT)
Uses algorithms to execute trades within microseconds. It increases liquidity but sometimes amplifies volatility.
b. Online Brokers
Platforms like Robinhood, Zerodha, and Interactive Brokers allow retail investors worldwide to participate in global markets at low cost.
c. Crypto Exchanges
Though not traditional exchanges, platforms like Binance and Coinbase mirror exchange functions for digital assets.
d. 24-Hour Trading
Some exchanges now offer extended hours, allowing investors in different time zones to trade almost anytime.
7. Importance of Global Stock Exchanges in the World Economy
a. Wealth Creation for Investors
Stock exchanges help households grow wealth through equity investments, retirement funds, and long-term portfolios.
b. Channels for Foreign Investment
Foreign institutional investors (FIIs) move billions into emerging markets, fueling growth and globalization.
c. Benchmarking Economic Performance
Indices like S&P 500, FTSE 100, Nikkei 225, and NIFTY 50 act as indicators of economic health.
d. Risk Distribution
Through derivatives and diversified holdings, risk spreads across market participants, reducing systemic vulnerabilities.
e. Encouraging Innovation
Capital raised on stock exchanges helps fund research, expansion, and technological advancement.
8. Challenges Facing Global Stock Exchanges
a. Volatility from Geopolitics
Trade wars, conflicts, and political instability often trigger sudden market movements.
b. Differences in Regulations
Global exchanges operate under varying laws, creating complexity for multinational investors.
c. Cybersecurity Risks
Electronic systems are vulnerable to hacking, technical outages, and data breaches.
d. Dominance of Big Tech
Concentration of market capitalization in a few mega-caps sometimes distorts index performance.
e. Slowing IPO Markets
Tighter regulations and private funding alternatives make some firms stay private longer.
Conclusion
Global stock exchanges play a vital role in shaping the modern financial world. They facilitate capital flow, support economic growth, and act as hubs for investment, innovation, and wealth creation. As technology continues to evolve, stock exchanges are becoming faster, more connected, and more accessible. Yet, they also face growing challenges in regulation, cybersecurity, and global competition. Understanding their structure and dynamics helps investors, policymakers, and businesses navigate an increasingly interconnected global financial system.

Institutions Impact Stability1. Understanding Institutions and Stability
Institutions are not just buildings or government departments. They include formal systems like courts, central banks, legislatures, regulators, and law-enforcement bodies, as well as informal norms such as cultural values, social trust, and community expectations. Stability, on the other hand, means a condition where economic, political, and social systems operate smoothly without frequent shocks, conflicts, or disruptions.
Strong institutions create stability by:
Providing predictability
Reducing risk and uncertainty
Encouraging investment and innovation
Maintaining law and order
Ensuring fairness and accountability
Preventing fraud, corruption, and exploitation
Weak institutions produce the opposite: uncertainty, volatility, corruption, inequality, and conflict.
2. Political Institutions: The Foundation of Governance Stability
Political institutions include governments, parliaments, electoral systems, and administrative bodies. They shape how power is gained, exercised, and transferred.
Key Impacts on Stability:
a) Predictable Governance and Rule of Law
A stable political system enforces rules consistently. When laws apply equally to all—citizens, businesses, and politicians—confidence increases. Investors step forward, businesses expand, and citizens feel secure.
But when laws are arbitrary or frequently changed, societies experience unrest and economic stagnation.
b) Peaceful Power Transitions
Countries with strong electoral systems manage leadership changes smoothly. This reduces political shocks, coups, and civil unrest. Conversely, weak democratic mechanisms fuel instability, protests, and violence.
c) Reduced Corruption
Institutions like anti-corruption bureaus, independent media, and transparency laws help suppress misuse of power. Corruption erodes trust and creates social anger, which disrupts stability.
d) Effective Public Administration
Efficient bureaucracies ensure services like healthcare, education, infrastructure, and welfare programs reach people. When governments fail to deliver basic services, societies become vulnerable to crises and radicalization.
3. Economic Institutions: Ensuring Market Stability
Economic stability depends heavily on institutions like property rights frameworks, competition authorities, labour laws, taxation systems, and regulatory bodies.
a) Protection of Property Rights
When individuals and businesses are confident that their property, capital, and intellectual work will not be illegally taken or misused, they invest more. Secure property rights reduce uncertainty and support entrepreneurship.
b) Stable Regulatory Framework
Clear and consistent economic regulations prevent market manipulation and monopolistic practices. This protects consumers and ensures healthy competition, reducing economic volatility.
c) Sound Fiscal Policies
Institutions responsible for government budgeting and taxation maintain stability by controlling deficits, managing public debt, and preventing financial shocks. Mismanaged fiscal systems often lead to inflation, defaults, and economic collapse.
d) Labour and Employment Systems
Labour institutions—trade unions, employment laws, social security systems—balance the relationship between employers and workers. They protect workers from exploitation and ensure businesses retain flexibility.
4. Financial Institutions: Anchors of Economic and Market Stability
Financial institutions are the nerve centers of modern economies. They include central banks, commercial banks, securities markets, insurance regulators, and investment funds.
a) Central Banks: Guardians of Monetary Stability
A credible central bank ensures currency stability, controls inflation, and responds to financial crises. Predictable monetary policy boosts investor confidence and reduces economic shocks.
Weak central banks, on the other hand, create hyperinflation, currency collapse, and market panic.
b) Banking System Stability
Robust banking institutions maintain trust in the financial system. Strict regulations, risk-management standards, and deposit insurance prevent bank runs and protect savings.
c) Strong Capital Markets
Stock exchanges, bond markets, and mutual fund systems create liquidity and investment opportunities. Market regulators like SEBI, SEC, or FCA ensure transparency and prevent fraud, insider trading, and market manipulation—all essential for market stability.
d) Crisis-Management Institutions
Institutions such as financial-stability boards and resolution authorities help prevent systemic failures. They step in to support failing banks, restructure debt, and maintain market confidence during crises.
5. Legal Institutions: Protecting Rights and Ensuring Justice
The judiciary, law-enforcement agencies, arbitration systems, and dispute-resolution bodies form the core of legal institutions.
a) Contract Enforcement
A fair and efficient legal system enforces contracts reliably. Businesses operate smoothly when disputes are resolved quickly and justly, reducing uncertainty and transaction costs.
b) Human Rights Protection
Courts and constitutional bodies protect basic freedoms and prevent discrimination. A society with strong legal safeguards enjoys social stability because citizens feel protected from injustice.
c) Crime Control
Effective policing and law enforcement reduce crime, violence, and disorder. When legal institutions fail, societies experience insecurity, vigilantism, and social collapse.
6. Social Institutions: Strengthening Community and Cultural Stability
Social institutions include families, schools, religious organizations, community groups, media, and cultural norms.
a) Social Trust and Cohesion
Communities with high trust levels experience less crime, fewer conflicts, and stronger cooperation. Trust creates resilience during economic or political crises.
b) Education Systems
Educational institutions develop skilled individuals, reduce inequality, and support social mobility. A well-educated population is more productive and less vulnerable to manipulation or extremist ideologies.
c) Media and Information Institutions
Independent media promotes transparency, accountability, and informed citizenship. It exposes corruption and supports democratic stability. On the other hand, biased or captured media can spread misinformation, increasing polarization and instability.
7. Global Institutions and International Stability
Institutions like the IMF, World Bank, WTO, UN, and regional alliances promote global stability.
a) Financial Aid and Crisis Support
The IMF stabilizes currencies and helps countries overcome debt crises. The World Bank funds development, reducing poverty-related instability.
b) Trade Peace
WTO resolves trade disputes and ensures smooth global trade. Without such frameworks, global markets would face frequent conflicts and disruptions.
c) Peacekeeping Efforts
The UN and regional bodies prevent wars, mediate negotiations, and send peacekeeping forces to stabilize conflict zones.
These international institutions reduce systemic risk, promote cooperation, and maintain global economic and political stability.
8. How Institutional Weakness Leads to Instability
Weak or corrupt institutions cause:
High levels of corruption
Political turmoil
Currency devaluation
Investor flight
Poor economic growth
Civil unrest and riots
Social divisions and crime
Market collapses
Inefficient public services
Countries with weak institutions often experience recurring crises, regardless of their natural wealth or population size.
9. Conclusion: Institutions Are the Engines of Stability
Stability is not simply a product of strong leadership or economic growth; it is the result of robust, transparent, and accountable institutions that create order, protect rights, enforce laws, and support economic activity. From central banks to courts, from parliaments to schools, institutions shape the stability of nations.
Strong institutions create a cycle of:
Trust → Investment → Growth → Stability → Prosperity
Weak institutions generate the opposite:
Uncertainty → Corruption → Conflict → Instability → Decline
Therefore, the strength, credibility, and effectiveness of institutions are the single most important determinants of long-term stability in any society or economy.
Global Debt Crisis 1. Understanding Global Debt
Debt is money borrowed by governments, corporations, and individuals with a commitment to repay in the future. At the global level, debt is classified broadly into:
• Public (Sovereign) Debt
Borrowing by national or local governments through bonds, multilateral loans, or short-term instruments.
High public debt limits the government’s ability to spend on health, education, and infrastructure.
• Corporate Debt
Borrowing by private and public companies.
When interest rates rise sharply, companies may struggle to repay, leading to bankruptcies and job losses.
• Household Debt
Loans taken by individuals including home loans, personal loans, and credit card debt.
Household debt crises often precede banking crises, as seen in the 2008 mortgage meltdown.
The global debt crisis happens when multiple countries and sectors simultaneously struggle to service their debts because of rising borrowing costs, slow growth, or currency depreciation.
2. How Global Debt Reached Crisis Levels
a) Ultra-low interest rates after 2008
To revive growth after the global financial crisis, major central banks — such as the US Federal Reserve, ECB, and BoJ — cut interest rates to near zero.
This made borrowing inexpensive, encouraging countries and companies to take on huge amounts of debt.
b) Massive pandemic-era borrowing
During COVID-19, governments borrowed heavily to fund healthcare, social protection, and economic stimulus.
Low-income nations relied on emergency lending from the IMF and World Bank.
c) Rising inflation and interest rates (2022–2024)
A global inflation surge, caused by supply-chain breakdowns and energy shortages, forced central banks to aggressively raise interest rates.
Debt servicing suddenly became expensive, pushing weaker economies into distress.
d) Strong US dollar effect
Most global debt is denominated in US dollars.
When the dollar strengthens, countries with weaker currencies need more local currency to repay the same debt amount.
This creates pressure on foreign exchange reserves.
e) High commodity prices
Countries that rely heavily on importing oil, food, and raw materials saw their import bills rise.
They were forced to borrow more, worsening their external debt positions.
3. Key Examples of Debt Distress
• Sri Lanka (2022)
Sri Lanka defaulted on its foreign debt due to a combination of political instability, tourism collapse, and excessive borrowing.
It ran out of foreign exchange reserves to pay for fuel, medicine, and food.
• Argentina
Argentina has defaulted several times. High inflation, currency depreciation, and IMF loans have kept the country in continuous debt crisis cycles.
• African nations
Countries like Ghana, Zambia, Kenya, and Ethiopia face high external debt levels, much of it owed to China and private creditors.
Rising global interest rates made refinancing extremely difficult.
• Developed economies
Even advanced economies are not immune.
The US, Japan, Italy, and the UK have public debt levels exceeding 100% of GDP.
While they may not default due to strong currencies and central banks, high debt limits their fiscal flexibility.
4. Why Global Debt Crises Are Dangerous
a) Debt servicing crowds out essential spending
Countries must allocate more budget to repay interest rather than invest in development.
This leads to:
Cuts in welfare programmes
Delayed infrastructure projects
Reduced spending on education & healthcare
b) Currency depreciation & inflation
When investors lose confidence, they pull out capital.
This weakens local currency and triggers inflation, worsening living standards.
c) Banking sector instability
If governments or corporations default, banks holding their bonds may collapse.
This can spread across borders through financial markets.
d) Social and political turmoil
Debt crises often lead to:
Protests
Political instability
Fall of governments (e.g., Sri Lanka)
e) Global spillover effects
A crisis in one region can quickly affect global markets due to interconnected finance and trade.
For example, the 1997 Asian crisis rapidly spread across economies.
5. Major Drivers of the Current Global Debt Crisis
1. High Interest Rates
For the first time in decades, global interest rates have risen sharply.
This makes servicing existing debt extremely costly.
2. Weak Economic Growth
Slowing global growth reduces government tax revenues and corporate profits, affecting the ability to repay loans.
3. Geopolitical tensions
Conflicts in Eastern Europe, Middle East, and trade fragmentation between the US and China have created uncertainty, reducing investment and raising commodity prices.
4. Dependency on External Borrowing
Many emerging markets rely heavily on foreign borrowing.
If foreign lenders pull back, financing gaps emerge instantly.
5. Climate-related shocks
Extreme weather events have increased fiscal burden on vulnerable economies, pushing them further into debt.
6. How the IMF and Global Institutions Respond
The IMF, World Bank, and G20 play a key role in stabilizing global debt crises.
IMF tools include:
Bailout packages for countries in distress
Debt restructuring programs
Special Drawing Rights (SDRs) to boost reserves
Fiscal discipline guidelines
The G20’s Common Framework
Introduced to restructure debts of low-income countries jointly involving:
China
Paris Club Nations
Private creditors
World Bank support
The World Bank provides long-term loans at low interest rates for development and infrastructure, easing pressures on nations.
However, many experts argue that reforms are too slow, and creditor coordination remains difficult, especially with China’s large role in lending.
7. Potential Global Outcomes if Debt Crisis Worsens
a) Worldwide recession
If multiple countries default, global trade and investment could shrink significantly.
b) Bank failures
Financial institutions with large exposure to sovereign or corporate debt may face insolvency.
c) Capital flight from emerging markets
Investors may pull out funds, causing currency crashes and inflation spikes.
d) Social unrest
Economic hardship may lead to political instability in vulnerable nations.
e) Reduced global development
Poverty levels may rise, and progress on health and education could reverse.
8. Solutions to Mitigate Global Debt Crisis
1. Debt Restructuring
Rescheduling payments or reducing principal for distressed economies.
2. Fiscal discipline
Governments must reduce unnecessary spending and improve tax collection.
3. Diversifying economies
Reducing reliance on commodities or single industries makes economies more resilient.
4. Strengthening domestic capital markets
Countries should develop deeper bond markets to reduce dependence on foreign borrowing.
5. Improved global cooperation
Faster and coordinated action from IMF, G20, China, and private lenders is necessary.
Conclusion
The global debt crisis is not a single event but a structural challenge that has built up over decades. Rising borrowing, economic shocks, high interest rates, and weak global coordination have pushed many economies into dangerous territory. Without timely debt restructuring and coordinated global policy responses, the world could face prolonged financial instability, slower growth, and increased poverty.
Managing global debt is now one of the most critical challenges for policymakers, international institutions, and governments worldwide.
