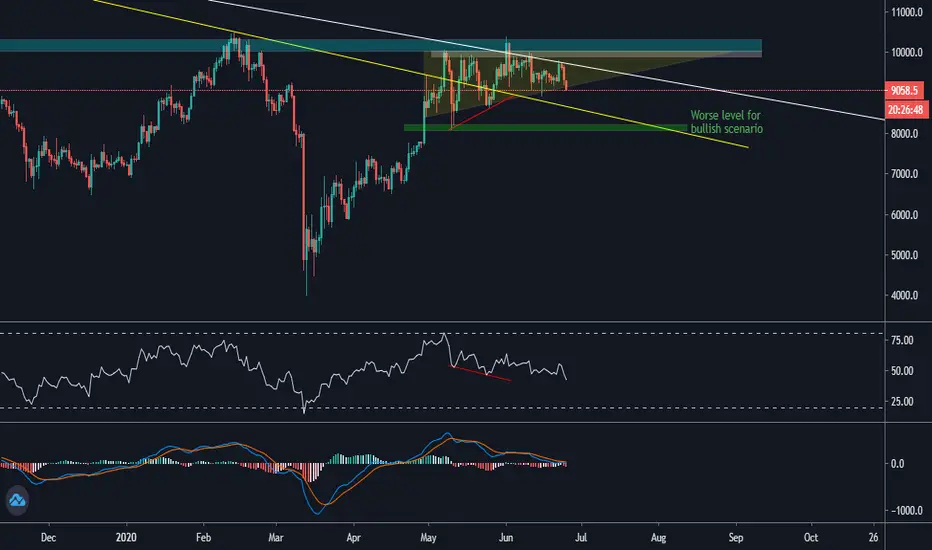
Bitcoin is Inside Downtrend Channel Hi everyone,
This is a clear picture about our Bitcoin.
It is inside a Downtrend Channel and the channel is not that big to do great trades, buuuut.
You can short near the U$9400 zone.
Or you can long near the U$8800 zone.
Only quick trades.
You must stop if Bitcoin breaks to any side opposite to your trade.
Altcoins are clearly better than Bitcoin to trade now!
FINANCIAL MOVE CRYPTO
Bitcoin (Cryptocurrency)

Key to destroying bears is break new high. See all 11 close upSee all eleven matches stacked close up to same scale. NOT ADVICE. DYOR.

EW Analysis: BTC Is Losing Dominance, But Only TemporarilyHello traders and investors!
Today we will talk about Bitcoin Dominance and its wave structure from Elliott Wave perspective. We will also show you how it can be useful in analyzing XXX/BTC cross pairs with the help of EW.
If we take a look on BTC.D daily chart, we can see a sideways consolidation for almost a year which usually suggests a corrective movement, especially if we see a three-wave w-x-y drop in the first leg »a«. Well, we believe that BTC.D is unfolding a bigger bullish triangle pattern and current decline can be just as part of wave (c)/«c« that can find support very soon, ideally in the projected support zone around 64-63 area.
Be humble and trade smart!
If you like what we do, then please like and share!
Disclosure: Please be informed that information we provide is NOT a trading recommendation or investment advice. All of our work is for educational purposes only.

Bitcoin stoked by SHComp & bullish state sponsored propagandaBitcoin stoked by SHComp & bullish state sponsored propaganda. NOT ADVICE. DYOR.

Since March 2013 these patterns only started in 2019Since March 2013 these patterns only started in 2019
In last 2 patterns 2nd month can dle ended green
All 3 had an ATR of 5 weeks and fifth week bar was red.
Also all had next green candle break out.
Will today 6 th July 2020 break out same with green bullish candle
NOT ADVICE DYOR

What drive BTC price vs. value?Every day, tons of information are flowing around. Most of the times, we get conflicting signals. Some are bullish, the others bearish. So how to view them in a simplified way? The chart above is our method.
What’s your view? Do you agree or disagree? All thoughts and critics are welcomed!

Who drive BTC Price vs. Value? First of all, please support our work by smashing that like button or following! These really help us to reach more traders like you!
There are two group of people in the crypto space: long-term investors and short-term speculators. One often overlooked fact is while short-term speculators dominate the actively daily traded BTC, long-term investors actually dominate the entire BTC holding. Understanding how these two groups contribute to BTC value and price separately is crucial in profiting in the long run.
“Never invest in a business you cannot understand.” – Warren Buffett
Are you a long-term investor or a short-term speculator? Do you agree or disagree? All thoughts and critics are welcomed!
===========================================================
🌐 We believe in the power of blockchain on-chain data analysis!
===========================================================

Is this buy signal on 4hr Chart a trap? NOT ADVICE. DYOR.
Is this buy signal on 4hr Chart a trap? NOT ADVICE. DYOR.
CONSTRUCTION
Using triple MACD's based on high, low, and close. When all signal and MACD begin to switch to negative (open range) to when all negative (close range) = red box, and vice versa = green box.

A brief introduction to RISK MANAGEMENT:If you like my ideas and the work I do, please check out the links in the signature and give me a like ;).
As I tend to get a lot of questions about this topic, most traders don’t seem to understand basic risk management in trading! From my experience capital protection and risk management are probably the most important part of any trader's skillset. So that is why I wanted to address this in a more elaborate educational Idea.
The kind of questions I get:
- I’ve got half my portfolio in this coin and the other in this do you think I need to sell.
- Do you think I need to sell my … and buy …
- I've been holding this since it was at that price do you think it will go down more ...
I know these don't necessarily seem like bad questions to most people, but that is not actually how you should be trading.
Note: In crypto trading lots of people (myself included) keep their portfolio in BTC or ETH. Now in doing this, you should not look at the dollar amount of the asset, but the goal should be to increase the amount of the asset you hold. If you are going to switch every five minutes because you think about the dollar amount of said asset, I would advise you to stay in dollar and trade from there.
Now with that little particularity out of the way, we can look at how trading should be done.
It is known most retail traders take positions with their entire capital and then when it drops they get scared and don’t want to sell because psychologically they can’t handle the risk. Now, this is the best way to blow up your entire portfolio in the shortest amount of time.
In trading, you can never be sure a trade will be a winner so you should always make sure you can handle a string of losers without it affecting the bottom line too much.
Example of how human psychology works in regards to this is a study done around the Kelly Criterion formula: ( This example is from the Wikipedia page of the Kelly Criterion )
Each participant in this study was given $25 and asked to bet on a coin that would land heads 60% of the time. Participants had 30 minutes to play, so could place about 300 bets, and the prizes were capped at $250. The behavior of the test subjects was far from optimal:
Remarkably, 28% of the participants went bust, and the average payout was just $91. Only 21% of the participants reached the maximum. 18 of the 61 participants bet everything on one toss, while two-thirds gambled on tails at some stage in the experiment.
Using the Kelly criterion and based on the odds in the experiment (ignoring the cap of $250 and the finite duration of the test), the right approach would be to bet 20% of one's bankroll on each toss of the coin. If losing, the size of the next bet gets cut; if winning, the stake increases. If the bettors had followed this rule (assuming that bets have infinite granularity and there are up to 300 coin tosses per game and that a player who reaches the cap would stop betting after that), an average of 94% of them would have reached the cap, and the average payout would be $237.36.
In this particular game, because of the cap, a strategy of betting only 12% of the pot on each toss would have even better results (a 95% probability of reaching the cap and an average payout of $242.03).
Now, this is why we do not want to trade like this. We should choose a risk level we are comfortable with per trade and keep this consistent. You can use the Kelly Criterion which can be difficult to do because it requires the win probability per trade for the calculation. Now you could get this by trading a certain trade setup you like to trade, let’s keep it simple, a 100 times.
By doing this, you could gage the probability of this setup being a winner and that would allow you to use the Kelly Criterion formula.
For beginners, a simpler way of doing this is the 1 percent rule. This means you risk 1% of your portfolio per trade. Simple example:
You have a risk-reward per trade of 1/1.5 and your strategy has a win rate of 50% of the time and you make 100 trades on a 10000 dollar portfolio. You would end up with a 25% gain after 100 trades even though the 50 losing trades lost you a total of 5000 dollars. Because of the risk-reward the winners got you 7500 dollars which brings you to 12500 dollars in the end.
This is a simple example but it shows the importance of both risk/reward and position size.
Of course in reality it would play out slightly different. You would recalculate after every trade if your portfolio decreases due to a loss, which means you reduce your positions to make sure your risk stays at 1% of your portfolio and if you win you increase your positions to do the same.
Another thing people get wrong with this rule is they start just betting the same position on each trade of let's say 5% and think they will get out when they lose 1%. This does not work!!!
You should look at your setup and where you want to place your stop and look at the percentage between your stop and your entry. If this is for example 20%, you take your 1% risk tolerance and divide it by 20, then multiply it by 100 and that will be your position size. If you are using leverage you will need to divide this position size by the amount of leverage used.
An example of risk-reward is shown above.
From my experience, some general rules I use which tend to improve your results on top of a risk management system as described above:
1. Cut your losers quickly and keep your winners.
2. Don't change your stop unless you take profit and move it above break even.
3. Always place your stop at a technical level and not a random percentage, for example, the last highest low.
Of course, you can adapt this to fit your trading strategy and style but the basics will be the same.
I hope this was helpful and if anything is unclear feel free to ask me a question through chat.

Tesla not done yetMany people now see "Tesla" as the definition of a "Bubble". The same was true when Bitcoin spiked from 3k to 12k. However, was bitcoin done? No, because everyone knew "its a bubble", it meant that there is a lot more to come.
In the short-term I would expect Tesla to drop from $1200 or $1300 to about $700-600. The downside target might extend a bit to say 500-400, but at this point this seems very unlikely.
I would dare say that this could be interpreted as the Bitcoin pullback from 12k to 8k before making 20,000. It could be that after this move Tesla also pushes higher to $1500-$2000. However, for now let us focus on the opportunity for a pull-back and increasing our positions.
I am long Tesla since Q2 2018. I plan to increase for the last time and sell everything at 1.8k-2k per $TSLA

Tutorial how to catch a signal $ftm as an example.When all indicators give buy signals together so this could mean a great pump or at least a good percent.
this is a sample of how all indicators give the signals together one by one.
the take profit action should once get sell signal from two signals at least or once you see that you got a good profit and you want to close the deal.
we use a 1H timeframe for our indicators.
thank you for reading.

Weekly close outside of this range. What are odds of a trapExample: Create a signal - doesn't matter how. Create a range. Use A.I. to minimize whipsaw by optimizing signal and range. Execute A.I. strategy using both traded options and futures. Simple.
CONSTRUCTION
Created signal with two MACD's. One the default and the other customized. Start range when one MACD crosses to positive and close range when the next to cross to positive is the other MACD, and vice versa. Colored ranges represent different combinations of pairs. CAVEAT- small sample size. NOT ADVICE. DYOR.
Have superimposed MACD's over SPX chart.
Follow direction when weekly close breaks out of range. No whipsaw/trap so far. CAVEAT - small sample size. NOT ADVICE. DYOR.

Special Analysis for Bitcoin: Is Bitcoin prepare for bull run?Hello guys, in this technical analysis I want to talk you about why Bitcoin is so prepare for bull run soon? Now, I selected the Weekly and Daily timeframe.
Now, in weekly we see a Bitcoin bearish for MACD and price action, but there are a lot doubts that respald that a drop what a much traders hope, it's can be fake drop and the price is can to prepare to go to break up the simetric triangle from 2017.
But for this information we need to see in Daily timeframe, that is the key what Bitcoin do.
But in Daily timeframe, we see a reality so different than Weekly, because Bitcoin is now into this bullish rising wedge in formation and find up the Elliot Wave D, to later go to drop for the E to find down, and later we proyect for Bitcoin so bullish scenario reaching at $11,500 USD. That is a possible target to see in few weeks. Also the MACD is show us a possible buy!!! Now, if I asking you about if this scenario it's could be to pass. Are you prepare for there? Now, in that case that this rising wedge fail and broke down, we can see a Bitcoin so bearish until the $7,000 USD again. But, the key is in Daily timeframe how we see the trend key, structure and condition for midterm.


EW Analysis: XMRBTC May Break 2019 LowsHello traders!
Today we will talk about XMRBTC and its price action from Elliott Wave perspective.
XMRBTC is sideways since 2019 and it's ideally forming a big bearish triangle pattern in wave "iv", which means that we should see even more weakness and sooner or later we may see new 2020 lows that can send the price down to 0.0060 - 0.0050 area, if not even lower.
XXX/BTC crosses are highly dependent on BITCOIN.Dominance, which we still see it bullish and it's looking for more upside, so BTC will most likely stay stronger than ALTcoins and most of XXX/BTC cross pairs may remain under bearish pressure.
Be humble and trade smart!
If you like what we do, then please like and share!
Disclosure: Please be informed that information we provide is NOT a trading recommendation or investment advice. All of our work is for educational purposes only.

Will June 2020 end like Sept 2013 or Aug 2015Will June 2020 end like Sept 2013 or Aug 2015 or with 3 green bars. NOT ADVICE. DYOR.


Concern if bitcoin dips below $8,710.1 on BITFINEXConcern if bitcoin dips below $8,710.1 on BITFINEX. NOT ADVICE. DYOR.

That TD indicator doe!I should have posted this the moment I drew it which was when the TD sequential indicator printed a 9, indicating/suggesting a reversal, in combination with the trend lines and the bearish candles, it was obvious, but I didn't make the trade so i didn't publish this look. TD often ignores 9's and will go against you, but it is still right much of the time and I use it only in combination with other data. Anyway, I am showing this for the technical beauty of it, shame on me for being busy in the stock market to trade this setup. Props to those who did, let me know how much you made in the comments section. Thanks for viewing.
THIS IS NOT TRADING ADVICE, I AM NOT AN ADVISOR, I AM A SPECULATOR, TRY AND DONT GET REKT K

Bitcoin - code red on the daily. SPX vulnerable.From 2013 only one other match when two green bars following a red bar conclude with a red bar. See how closely SPX and bitcoin averages played out then and now. Do same with bitcoin's MACD. NOT ADVICE. DYOR.

Find best pair of MACD's to fuel Bitcoin bull break outAnalyse for yourself 10 Market MACD pairs including bitcoin Longs & Shorts using log scale. SPX constant (Orange). NOT ADVICE. DYOR.

Bitcoin : Is it time for reversal?Bitcoin is now at a very crucial momentum with a lot of bearish pressure has occurred in the short term and lower degree of cycle. This is however still a normal behavior from the market and the choppiness that is still ideal when you see the price tries to break out of the psychological level like $10000 region.
If you say that the price is going to reverse at current rate, I do believe it's totally invalid bias because there are still a lot of strong support below this level that you must respect them. Beside there are 2 signs that shows us the price is still in the stage of potential bullish structure. The first sign is the ascending triangle that is still in play. The price has been trending inside this triangle since the beginning of May 2020 and there is no doubt that the price is still maintaining the higher low structure.
The 2nd sign of the continuation to the upside will be on the RSI. There is a higher low on the price action but the RSI has printed a lower low which indicates current condition as the hidden bullish divergence as well.
My worse case scenario (for bullish bias) is that the price can touches the green region as the interim swing low of current structure. If the price breaks below this region, I will come again and review my bullish bias.
Study of 200 DMA. Where next?Lets check out 200 DMA. Using 1st June High we need a DMA of 200 DMA day before a cross. 69 best. Found 3 same crosses from High 2013. See what I see. Enjoy. NOT ADVICE. DYOR.
