bitcoin5.4.20 another look at gold...if you are thinking to short. The significance of a range box on Bitcoin.
Bitcoin (Cryptocurrency)

Can bitcoin cross trend line without an SPX WK C > 100 MAFollow up to previous post. NOT ADVICE DYOR.

Bitcoin To the Moon in 2021Good Morning, this is my favorite technical analysis for Bitcoin prediction and how the comportament of this volatil assets. So, we can see that Bitcoin is into a simetric triangle from Finally of 2017 when Bitcoin is leave up at near of $20,000 USD. Now, it's seem that Bitcoin doesn't not broke up the grant resistance give us on July 2019 that the maximum year of Bitcoin was near of $14,000 USD on 2019, and so, I remeber that see a Bitcoin in the descendent triangle that I remeber that a broke up and a drop of the -23% that leave at $8,600 after of September 2019. So, in this technical analysis I will give you my prediction and where are we on this moment. So, I hope again an other drop approximmately $5,776 USD after this Halving 2020. It's missing down of less of 2 weeks, and this drop we could see a Bitcoin that will want to complete the elliot wave ABCDE to complete the last letter E and now, aprroximattely in 2021 we will need to see a bullish rally of Bitcoin between 2021 and 2022. Remember going to study trading and accumulate more and more and more satoshis and together we earn the battle of the banks about the inflation, financial crisis of the FED and all banks that we will being scammed of they in asunt of money and liberty.
And my message for you it's that my technical analysisi is classic, but modern. Happy ness day!!!!

If Bitcoin Really is The New GoldLet's say the equities market crashes along with commodities, then we would expect gold's price to increase, but maybe Bitcoin will become the new gold due to the nature of the pandemic that we are currently amidst. The key point is this: gold is neither easily transportable, transferrable, nor is it readily portable. It would be impractical to expect be able to readily access gold throughout the entire time it takes for our planet to either acquire herd immunity to SARS-CoV-19 or to produce a vaccine which would be used to prevent said virus. Bitcoin is advantageous in this aspect. A $120,000 per coin call sounds hopeful at one point or another, but such lofty thoughts like that don't seem too far out of reach, especially during times like these.

Trader/Investors must understand this process.......!Kindly comment with " Yes " for agree and "No" for disagree with this post:
Before the break-out, I've informed that " Breakout will give truck of Money. ..!". Exactly, we seen this statement was TRUE, didn't it? (End of idea link is added about this idea)
Let's talk step by step was happened here.
The Width of congestion area was equal to height of the price surged.
From my personal experience and the survey/observation I'm talking about this is almost the same area as price congestion in size of width and height after the price break. Let's try to explain in another words:
Horizontal width of congestion size = Vertical price move after break-out. (Generally, i noted that price moved away so far after breakout whenever congestion area is much longer.)
--> Let's talk little more deeper about CONGESTION area:
In the congestion area, accumulation or distribution process process. We will talk about accumulation only because, this was happened here.
Accumulation : smart money, money makers, huge fund-management, landlord of global investors whatever you called them they grab/connecting instrument(stocks, currency,etc) from retail investors in very slow motion because, they can smell insider upcoming news. After the completing this accumulation, news clear and price start to go away from the breakout area.
later i will try to explain you more deeper about it practically. Yes, obviously we can smell the process accumulation/distribution.


If Weekly SPX close above 100 MA will it be different this timeLast time market speculated SPX bottom "not in" bitcoin rose between 26% & 157% equivalent today $9,592.88 & $11,953.03 ($7,613.4 (WK Low) x 1.26 = $9,592.88 &
$7,613.4 (WK Low) x 1.57 = $11,953.03) NOT ADVICE. DYOR.

XBT has made a full recovery from Covid -19!!!!XBT has created new market structure and we are back to the price level pre covid-19
There is strong resistance to break with an equally as strong supply block, the next supply level isn't as strong (due to only a small consolidation zone before it) meaning we could easily break though it.
XBT is a no trade zone for me at this stage. I will be looking for shorts if the retest fails to close above resistance.
The demand zone is very strong with a decent consolidation zone before it and lots of previous structure. if we make it back down there, in my opinion it wont be for long.
XBTUSD D

BitcoinI am clarifying mistakes they made in the previous video of bitcoin. The clarification is like gold because if you can recognize this kind of price action where the market fails to make new lows, this is often the first clue that a market is actually going to move a lot higher before it makes that move. So the pattern in the price action that I am showing you is what I use once a markets oversold and tells me that I should stay with this market longer because of the pattern. Sometimes it will be the only thing that you see, and other traders won't see it and they will miss the opportunity. This pattern that I am describing is occurring after the market has moved considerably higher already, it is not the beginning of the move that is about to move higher, it is towards the end of the move moving higher and this is an important distinction. Yet, if you see this behavior when you expect the market should now turn around and go lower, but the price action is bullish, you cannot short this market even though it has traded up to resistance. I will say this again, this is gold for your trading, and it is simple to see if you know what to look for. It took me many years to recognize the importance of this kind of price action. It's subtle, but it frequently prevents you from trading in the wrong direction.

Bitcoin | Halving FOMO & Wedge Formation..!!BTC/USD (Update)
Bitcoin Has been doing Awesome Job since 12th March Crash, Majority Were Waiting for 1k Dip & Missed it.
At the Moment, Bitcoin Has Recovered up to 140% Since 3.8k Dip/Bottom.
It's Been Breaking the Every Single Resistance one by one & Liquidating the Bears .
In Bigger Chart, It's Following the Expending Wedge Pattern & Now Heading towards the Major Resistance (9.6k)
Yesterday, Bulls Did Great Job & in Strength (That's the Real Halving fomo, We're Waiting for)
I Hope You Guys Enjoying the Bitcoin Ride & We're too Closer to Bitcoin Halving ( Almost 12 Days Away)
Please like the idea for Support & Subscribe for More ideas like this and share your ideas and charts in Comments Section..!!
Thanks for Your Love & Support..!

$10500 as the next anticipated region before the halvingBitcoin has shown us a very strong action of bullish that is now trying to approach the upper line of the down trend channel that has held the price since June 2019. With today's move of the 15%+ gain in 1 single day of trading session, the price has broken out of the strong resistance area and the liquidation zone. There are few things I want to highlight related to this current upside moves.
The first thing is that there is a failure in the rising wedge with a break out of the upper line of the falling wedge. This action usually gives a confirmation of super bullish market with a huge parabolic movement in the market. And there is other thing that is crucial for me is that the price has already broken out of the liquidation zone around $8200 region which is a good sign.
The 2nd thing is that for the first time since February 2020, the RSI level is now approaching the previous high around 75 level which is very close to the 80 level as the range for extra bullish market. We must anticipate if the RSI can breached the 80 level on daily, there will be a very bullish market ahead. But, if it tops at current level and it gets back to below 60, there will be another bearish push.
The last thing is that we have to anticipate the potential fake break out of current down trend channel. As you can see, the price is very close to the upper line of the channel and the next resistance zone around $9200 - $9400 . There will be a lot of squeezing moves that we can anticipate from now. The key factor for current market's price will be on the halving that is going to happen in the next 12 days. And due to this event takes place and with the current bitcoin's behavior, I won't be surprised is the price can have a spike to the $10500 region right before the halving.

Weekly perspective : Here is why the $8000 region is importantA quick update about bitcoin perspective on the 1 week of time frame. There are 2 important support trend lines from this weekly bias. the first trend line is the yellow one which has been broken and the 2nd one is the white support trend line that is very major.
If we use this yellow trend line as our benchmark, we can see that there is a potential of break out strategy in play during this moves. The drop during the earlier of March 2020 could be the initial break out as the phase 1 of break out strategy. Current moves toward the upside could be the action of trying to test the previous broken support trend line that is now become resistance as well. And there is a coincidence, which the golden pocket zone is in align with this previous broken support around $8000 region.
The 2nd important thing is if we look at the MACD indicator as an oscillator indicator, we can see that the histogram is having a tick toward the upside and it's coming closer to the 0 level which it can turns into a positive side in the next few days or the next week's movement. Moving Average on the MACD is looking promising too with a potential of golden cross over to occur in the future.
Any other fundamental thing that I want to highlight is that the halving of bitcoin is coming closer with the estimation of the next 14 days. During the pre halving period, usually a lot of people are exciting to stack the bitcoin because they believe that after halving there will be a push toward the upside due to supply and demand rules.
I do believe a touch toward $8000 is still a valid scenario for short term in the next 1 or 2 weeks, but for long term I'll stay on my bearish bias and the spike toward the $8000 or even $9000 could be only artificial and manipulated.

How To Track Total Market Cap for All CryptocurrenciesThe Total Market Cap for all cryptocurrencies currently stands at nearly $220 billion. You can track and chart this data on TradingView by typing "TOTAL" or "CRYPTO MARKET CAP" into the search bar or by visiting the Total Market Cap page: www.tradingview.com
Total Market Cap is an important metric to follow because it can highlight the overall health of the crypto ecosystem. The Total Market Cap for all cryptocurrencies is exactly as it sounds: it is every cryptocurrency added up and displayed as one data point. For example, the market cap of Bitcoin + the market cap of Ethereum + the market cap of Litecoin and so on. Following the total market cap can be an effective gauge to measure the universe of cryptos and how they're trading as a whole.
On the TradingView Total Market Cap page (link shown in the first paragraph above), you can also chart Total Market Capitalization Excluding Bitcoin and the Total Market Capitalization Dominance for each crypto as a percentage. Both of these charts can help you better understand the cryptocurrency landscape. By subtracting Bitcoin, you can evaluate the health of all cryptocurrencies without Bitcoin. This can unlock some insight into Altcoins or if the market is moving in a direction despite Bitcoin. By viewing each cryptocurrency as a percentage of the total crypto market cap, you can see how big a crypto is relative to everything else.
We hope this guide helps and that the Total Market Cap page can aid you with your analysis. Please leave a comment if you have questions or feedback. We're also interested to hear your thoughts on these tools, so please keep the discussion going by attaching a chart or analysis of your own.

Bitcoin will eventually run, but halving will be non-event.Bitcoin halving will be non-event, Bitcoin needs to get rid of all the weak hands. Once the selling pressure is over. It will make it major move.
Bitcoin remains in consolidation mode, even versus Gold and Nasdaq. Once Bitcoin broke out above 2019 high in USD term, in Nasdaq term, in Gold term, then that will be the start of the bull market.
This is the game for the patience.

NISON - SWING TRADING STRATEGIESNISON - SWING TRADING STRATEGIES
PB&J - Pullback to Sweetspot
TT9 - Trading The 9
Trailing Stop


Ultimate Bitcoin Price Technical Analysis [Tutorial]follow me for more ideas till next Bitcoin halving. each and every entry exit point.
PM me if you are in loss and want some advice .
let me start boring discussion. ( but it’s very important ).
as we know only 14 days left till the next historic halving event. We need to keep watching every move.
as you can see crucial levels starting from supports 6500 , 6800 , 7400 and resistance levels 7740 , 8100 .
1. Btc is now at 7670 . If it drops from the support 7450 then you can immediately exit and then wait for next sipport 6800 . If it holds 6800 then you can again take entry. ( **remember when i say holds support that means minimum 6 one hour candles above that level). if it drops then take entries from 6500 support.
2. If it successfully raise and hold above 7740 and then 8100 . then it will be a FOMO situation there. And price can see huge pump toward 9000 level.
3. If bitcoin remains between 7450 and 8100 . We can expect mini bull run in major altcoins. like cardano(ADA), komodo(KMD), ontology(ONT) and other good fundamentally strong alts.
I hope you are clear about when to enter and where to exit.
feel free to comment or contact me in PM for any doubt.
If you like my ideas and watch my previous accurate guidance then follow me for more.
Like share knowledge.

Trading Tips for consistency 1- Find one repetable pattern on a specific timeframe and track it on excel to know the exact % win rate.
2- patterns are more powerful than technical indicators, imho indicators should be only used for signal entries and nothin more than that. Remember all indicators are lagging indicators so patterns remains more powerful.
3- the ability to master oneself and stay disciplined to wait and wait for your specific setup to CONFIRM.
4- DONT anticipate you must wait for CONFIRMATION only.
5- max loss per trade. Risk management is the king of the game and you must have a pre defined max risk per trade BEFORE you even enter into a trade.
6- use HARD STOPS. As soon as you enter into a trade you must set your hard stop immediately.
7- if new imho u must use max risk of 2% of ur equity on each trade as a max risk, if you are exprienced then you are allowed to use more.
8- Journal your trades, take screenshots of your charts with entries nd exits, as well as joirnal your thoughts before you trade, during and after you exit the trade. Remember this game is 80% psychology so tracking your emotions is KEY to success as a trader.
I wish you all success 🙏
The Bear 🐻

Bitcoin4.25.20 Bitcoin is a very good example of how a trader who looks at price action would handle the market differently than a trader who trades retests of breakouts or who trades patterns. In many ways traders make decisions that are based on minor or irrelevant behavior, or even worse, they make decisions based on what they would like the market to do, not with the market is telling them. I realize if you get a room full of traders, hopefully successful traders, you might have an intellectual debate around those differences. Everything you do on your chart reflects a certain point of view, and depending on your priorities, I believe some points of view are much more subjective and less reliable than others. I know with 100% certainty from my own experience, it is futile to have debates with people who process information and see the world differently than I do. And at some point they'll tell me that my point of view isn't necessarily any better than theirs. And in all fairness, I would probably say the same thing except I would probably say that my point of view is better than theirs... henceforth the situation can become contentious. What can I say, I was one of those kids that took us football if he didn't get his way. I confess. In the end you make money money or you lose money. I hope that you listen to this 19 minute video with an open mind, and then for a few hours were a couple of weeks keep an open mind and determine if it's a perspective worth thinking about. If you were to go to an expensive PhD level clinical psychologist that specializes on highly productive, highly successful professional traders, at some point he would tell you the sum traders cannot change and that they have no ability to recognize what they're doing, and what it takes to objectively improve their performance unless they take steps beyond the decision-making and behaviors that make them losing traders. The good thing is you don't have to be a successful trader to find out about this if you're willing to pay the PhD clinical psychologist for this insight. In other words, they do not discriminate, they will take your money as well, and that's a good thing. There are so many built-in challenges and problems for traders, despite success in other aspects of their lives... one where the other if there are issues, they have to be addressed to change the outcome. What I'm doing is not with the PhD therapist is doing; I am looking at different aspects of the market that I had to search for to change my accuracy and it took years. I had to acknowledge my failures and I had to accept that I make conclusions that didn't work, and that it had something to do with me, something that I couldn't see. I had to look at the market when I lost money and acknowledged that somehow it was my fault because I made an elective decision to enter the market. The PhD therapist would like to work on underlying issues and behaviors that have nothing to do with trading other than the fact your trading manifest your dysfunction and that this dysfunction is a manifestation of earlier occurrences in your life and how you reacted. Personally, I believe that is a valid viewpoint. Unfortunately, my PhD therapist kiss me off and/or I passed him off, but not before I got enough value to work several years longer, and this included all the things that changed in my charting and how I prioritize structure, patterns, price action, expanding versus contracting markets and other things. It was all about dealing with my incorrect calculations and inaccurate determinations about the market. It probably took a lot longer than it needed, but what can I say, if you're kumquat it's not that easy to transform into an artichoke. Since the majority of traders lose money, my guess is that most of these traders may work hard, but they're not working on the things that produce positive results. Most traders think their losses are due to the market, and not to themselves... would be my guess since I don't know most traders. if you want to be successful, you can't change the market, you have to change something about you.

Another speculative bubble: Alcatel-Lucent [Banking] [Crypto]First... a little introduction about mainstream speculation, then I will talk about 50 year market cycles, and then about banking & currencies.
Coronavirus: The "best" models by "the brightest minds" predicted - taking into account lockdown & social distancing - "tens of millions of deaths".
MrRenev predicted - it's only a few months old - that this was extremely exagerated. By Late April, 200,000 people have died. The rate is high in cold countries (~40°N, interestingly this is New York and Rome latitudes), I think deaths of colds by this coronavirus are as high as all other colds combined. Anyway, I got alot of heat but I was right, as usual. I also predicted that lockdown was useless and did no good (but does a whole lot of harm), and I will soon compare lockdown countries to non lockdown ones to show it, plus studies will say the same thing, same old, same old. A study has shown New York had several millions infected! More than 1 in 5! (As I predicted...got patronized and everything but I was right - AGAIN! - so don't mind me if I am arrogant and condescending).
Cough cough:
11,544 deaths in New York City
15,740 in the New York state
A death rate around .5%, it's a little higher than other places, but it's pretty cold there, and air quality isn't great, and americans are fat so obviously it will be worse.
Also there is another reason why the rate could be higher there but I won't even mention it because the USA sees racism everywhere and they still control the world (not for long ;}) and I can't be bothered.
I had the numbers for all colds but idk where they are now, but for the flu & pneumonia last years they were almostas many deaths as for covid-19 alone.
And if I remember correctly covid-19 had about as many deaths as all colds combined. So it's pretty big but way smaller than all the clowns predicted.
"Low end mortality prediction 3%, but could be as high as 10%" "Worse than the spanish flu" "Deadlier than feared" LMAO clowns!
CO2 : Sigh. CO2 will kill us all. Another pathetic dogma and ridiculous calls. "World hunger will be extreme", actually earth population went up exponentially and hunger went down even in nominal terms.
30-50 years ago: "Temperature will go up 5 to 15 degrees" (15? really? Chimp). Went up 1 degree. In the North Hemisphere. And 0 in oceans & around the equator. 0.5 overall. They're desperate to make "adjustment" to make it look worse lmao, but then there are inconsistency and they deviate from other measurements and other countries etc and keep coming up with excuses to cover up their previous lies.
"12 years left" We've had 12 years left for the past 30 years boy.
Terrible, really terrible calls. I could make a long list. There are really funny ones, well they're all funny, another example is the "end of the world millenium bug", heard of that one? Oh, every one knows this one :"The Titanic is unskinkable" OOOH MY this one DID NOT AGE WELL! "Prosperity Will Never End" (1929). "We have to transitions to renewables because our advanced economics predict Oil will cost $380 a barrel in 10 years and it's fundamentally impossible we are wrong" (economists in 2005 - barrel priced at minus 40 a few days ago and Trump fighting to keep the long term price above 20 bucks).
Cycles:
So I remind you,
1780-1830: Steam Engine, Mechanisation
1830-1880: Railway, Steel, Comm (telegraphs), ( Start of wageslavery )
1880-1930: Electricity, Chemicals, Heavy Engineering
1930-1975: Automobiles, Oil, Mass Production & Consumerism
1975-2020: IT, Comm (satelittes, computers, internet, phones)
2020-2060: Banking (& Currencies), Health (billions of obese...), ( Decline of Wageslavery/Change in Work structure )
Comm continued between 1880 and 1975 and was growing before 1830, but it made its biggest revolutionnary gains in the 2 periods mentionned I think.
Idk maybe traders are communists after all, alot want freedom and hate the exploitation of man by man, the difference with official commies is we are smart enough to understand freedom comes from making money by yourself (profit) not by electing dictators that control everything and put chains around your neck (so obvious...).
Banking & Currencies :
A banking revolution is necessary, by revolution I mean changing this rotten system completely. All this money printing... In the US retail banks are making ridiculous loans to uneducated people that won't ever be able to pay, squeezing them, and then taking away their houses and more...
Cryptocurrencies were the earliest element in this new banking Kondratiev cycle, like computers of the 60s (first popular computer game spacewar that you might have heard of run on a 1960 model), and the space race. If you stored very pricey Disk Storage Drives and CRAM from 1962 you might be able to sell a few to collectors but that's it. Wouldn't get your money back and I didn't say inflation adjusted.
Companies are developping in this area, I mean quick payments, they're starting to replace banks. There are issues but it's growing.
I better perform well in this cycle and know what to invest in, I can proudly say I am an engineer in security & electronic payments, isn't that funny, in another life I might have been part of the next bubble, at least I learned something useful at school. Forgot it all thought.
So anyway ye, all those mobile phone companies, and optic cable companies (Alcatel was both), went way way down. Mobile phones got really big, optic fiber too, doesn't mean their share price HAVE to go up, if they started already 500% too high duh, and there are other factors. People are so dumb. That's why it is called dumb money.
Finance is getting more and more complex, probably because of the Flynn effect, mmm because the smart are getting smarter and the dumb are getting dumber.
And people are getting fatter and fatter + the world is open so diseases can spread on easy mode. Plague inc casual difficulty.
Next big things banking/currencies/and even the rest of finance, and Health / bio-tech.
The cattle that gets excited and greedy about potential profit and becomes obsessed and blinded with reasons to go up (the halving, bakkt, cme futures, etc) will get slaughtered and turned into delicious steaks, smart money will keep profitting I wonder... finance becoming more advanced efficient complex... Gives an even bigger edge to the smart. And dum dums get punished harder (as Robinhood users positions demonstrate). The dum dums breed like rats, the smart (especially women) not much... So this means more brainlets money to end in the pocket of less smart players. And all the little cockroaches that were cheating before everything got computerised (floor traders) stopped making money so now only pure skill / smarts is rewarded.
The smart can make more money but then have to pay for dum dums that can't even survive on their own. And get dumber and so on.
Without brains humans are just animals that don't run fast and aren't very strong.
Nothing is more risible that delusional dumb money that gets blinded by 1 fact and ignore everything else and gets excited.
The Alcatel chart, like many others, is not available anymore. There is still a remnant on the Istanbul Stock Exchange.
Those bubbles, those dumb money movements happen ALL THE TIME. And they never learn, and it gets forgotten, and it's always the same story.
And they are cocky when the price goes up, and they are persuaded they can't be wrong, and they get wiped out and turn silent.
History will keep repeating itself for a long long time.
Don't be one of those idiot gamblers. Investing and speculating take a very large amount of learning and a very large amount of thinking.
This is what happens to gamblers 99.999% of the time:

Bitcoin monthly price chart compare correation with oil and DJIBITSTAMP:BTCUSD
Bitcoin has never been correlated to nothing
BTCUSD, 1M, price chart
CC, USOIL, 20
CC, UKOIL, 20
CC, DJI, 20
When CC reaches 1, there is a perfect correlation.
When CC reaches -1, there is a perfect negative correlation.
When CC = 0, there is no correlation at all.
Bitcoin has never been correlated perfectly, or perfectly negative with crude oil, bren oil nor Dow Jones.
Bitcoin is doing is own path, despite the dreams of the hodlers, mooners and big brown bears.
This tutorial is dedicated to Tradingview "experts".

BTCUSD 4H KELTNER CHANNEL RANGE TRADING STRATEGYTrading Ranging Markets with Keltner Channel
It is said that the number one account killer in the market is a ranging market. Consolidations are very difficult to trade. However, you can take advantage of the difference in the way the Keltner channel system can be used in combination with other technical indicators.
The price won’t really touch the bands when it bounces between the upper and lower envelopes. When we’re in a ranging market, you’ll often see that the price will fail to touch the bands. The majority of the time the price will hug the middle band.
This anomaly in price behavior requires us to use a secondary technical indicator to find profitable trades.
Since the Forex market spends most of its time in consolidation (around 70% of the time), it’s mandatory to have a range trading strategy to survive in this market.
For range trading, we like to use Keltner Channel bands in combination with a 2-period RSI indicator. We tweaked the RSI settings so we can better identify tops and bottoms within a trading range.
*Note #3: For this Keltner trading strategy we use the 90-10 levels of overbought and oversold readings.
Here are some rules that can guide you to make the best trading decisions:
Keltner envelopes need to turn flat, to signal a consolidation.
The price needs to break below the middle band.
A buy order is triggered once the 2-period RSI goes below 10 indicating oversold conditions.
The protective stop loss can be hidden on the other side of the Keltner band.
For the long side take profit when the RSI reaches the 90 levels.

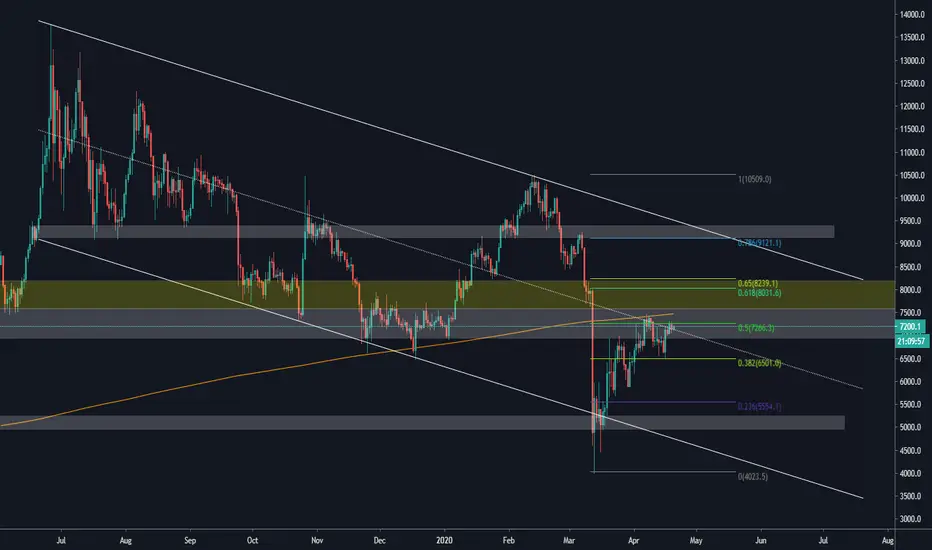
Assuming parallel channel and the key levelsHappy Monday and happy new week. Welcome to the first day of the next beautiful week hopefully. Let's come back to the technical analysis of bitcoin again.
Looking at the chart applied, the price of bitcoin has formed a parallel channel. Because of this parallel channel, there are some levels that may we consider as the key levels for bitcoin.
1. The first key level is at current level which price are trending at. Like what I've always anticipated on some of previous analysis, current level is having an alignment with the previous price action, median line of the channel, golden pocket and the 1000 moving average on daily time frame. With all of this confluence factors, I will expect a liquidation area of yellow will be touched during a potential choppy condition.
2. The 2nd key level is at $9121 region which is the next area of resistance if the price can breaks through current resistance level. This area however is the area of confluence between the previous price action and the 78.6% fibonacci retracement. Beside, there is high probability of this level will have an alignment with the upper line of the channel when the price has the continuation trend toward this region.
3. The 3rd key level is at around $5200 - $4900 region as the previous candle's body of the swing low candle. This area however is the area of interest of the swing trader which is waiting for opening their long position. If the price gets a rejection at current area of resistance, I do believe that the price will have a leg down to at least this area of support or even lower to the $4000 region which could have an alignment with the lower line of the channel.
These are the key levels that I will anticipate for now. I'm still staying on my current bias which is potentially bullish on a short term but still feel pessimistic for longer term. That's why I'm more leaning toward the downside for long term. Short term, we still can see a push toward the liquidation zone.