How To Combine Indicators to Make Profit?Hello, traders!
We have already know many diffirent indicator, but sometimes we can face with the situation when a combination of different indicators demonstrates bad trading performance. Usually the reason of this confusion is that investors use indicators of the same type. We should analyze the market situation in different ways.
The indicators can be divided by five groups.
TREND INDICATORS
This indicators helps to define the trend direction (uptrend, downtrend, sideways). This is very important part of the analysis because the uptrend is the most applicable for long, downtrend - for short, sideways - for range trading. Examples: EMA, Parabolic SAR, Alligator.
OSCILLATORS
This type is used for the trend confirmation, overbought/oversold conditions defining, to find the trend weakness (divergences). Examples: RSI, Stochastic, %R Williams.
VOLATILITY
There are can be periods of low-volatility and high-volatility on the market. The low-volatile periods are great for the long-term trading, while high-volatile periods are applicable for intraday and scalping in pullback or range trading. Examples: Bollinger Bands, ATR.
VOLUME
This indicators demonstrate moments when the volume increases or decreases. It is widely known that the big price moves are usually associated with significant volume traded. Examples: Money Flow Index, On-balance Volume.
CENTRAL PIVOT RANGE
This is a separate indicator's type because all indicators we discussed above are lagging, it means that it reacts to price action and usually produce the signal too late. The CPR indicator is the leading and is used for the potential price levels. We have already considered it on this channel on TradingView.
COMBINATIONS
We should combine indicators from different groups to increase trading performance. For medium and long-term trading it is great to use trend indicators with volume (EMA + On-Balance Volume) or with oscillators (EMA + RSI). For intraday trading the volatility and oscillators combination is applicable (Bollinger Bands + Stochastic RSI). The CPR indicator could be added to almost every combinations, because it is the leading indicator.
Now you can use this article to construct your own trading strategy. Next time we will consider a simple strategy based on these principles
DISCLAMER: Information is provided only for educational purposes. Do your own study before taking any actions or decisions.
Bitcoin (Cryptocurrency)

Crypto Correlation - Etherium - BitcoinI posted an idea yesterday on the Accumulation phase of Bitcoin currently. I have been asked by several people in the post and in DM's about Etherium, Litecoin and other alt coins.
Thought it be easier to make a post.
As professional traders enter the crypto market - it's clear to see a shift in the behavior of Bitcoin and its merry men.
If you zoom out and look at the daily charts or bigger, it's clear to see the dips and peaks at the same times - meaning BTC is a good indication of the rest of the coins...
Why? - Bitcoin is mainly a store of value, it's making entry into other alt coins easier - it's more trusted (i would like to say it's more understood, unfortunately not the case). You have several types of crypto players:
- Early adopters (usually tech guys n Gals) who believe in the concept and want to change conventional thinking.
- Consultants (usaully ex KPMG, PWC) will call themselves experts, charge the early adopters thousands in fees for their business acumen & adding no real value.
- un-sophisticated investors; wanting to invest in the next facebook.
- Friends of early adaptors who now see $$$ signs.
- Tech investors who see more than a trade setup.
- Savvy investors who want control (these guys take it to "investment instrument level"
- Then the late adapters - who want to play, make a few dollars, and hope to ride the bull wave to the moon.
- Everyone else.
The issue is the more institutional traction, the less likely of a full out bull run - investors know how to play the game to sucker the other parties into making more money for themselves in the process. So we will now start to see behavior more like Gold, Oil, FX - instead of the tech boom bull runs.
As traders, not investors - you need to adapt. If you are not looking for a drawdown, you need to buy the dips. Whereas an investor would pile in the money and come back in 5 years.
As far as Etherium, Bitcoin or alt coins. Think of it like this. Bitcoin is kind of what the USD is to currency and commodities. An easier way of putting it is "Bitcoin is the windows of the operating system space" - Ethereum is like Linux - it can be used for projects, not everyone understands it or wants to. It has its place and that has value in its own right.
Feel free to comment below. Enjoy the rest of the weekend!
Disclaimer
This idea does not constitute as financial advice. It is for educational purposes only, our principle trader has over 20 years’ experience in stocks, ETF’s, and Forex. Hence each trade setup might have different hold times, entry or exit conditions, and will vary from the post/idea shared here. You can use the information from this post to make your own trading plan for the instrument discussed. Trading carries a risk; a high percentage of retail traders lose money. Please keep this in mind when entering any trade. Stay safe.

Guide to Fundamental Analysis in Crypto WorldLet's consider a very important topic of fundamental analysis for cryptocurrencies.
If we talk about traditional markets the fundamental analysis takes into account the company's financial statement and macroeconomic climate, but in case of cryptocurrencies this information is unavailable because the lack of the publicity.
As a result the technical analysis role in crypto world is more significant, but applying the FA you can significantly improve your trading results.
Here is 7 areas which should be analyzed to apply complex approach.
1. ROADMAP AND WHITEPAPER. This point is most significant for the altcoins. The most reliable projects have a very serious development plan, every step should be explained in details in the roadmap and whitepaper. If it's not everything good with it, the project could be just scam.
2. MARKET CAPITALISATION. It is simple the coin quantity multiplied by the current market price of one coin. It is widely known that the lower market cap associated with the higher potential price growth.
3. VOLUME. If the coin has a low volume traded the huge manipulations could take a place in the market. The coin should be represented in the largest cryptocurrency exchanges it increases the probability that the corresponding project is not a scam.
4. COIN SUPPLY. Here we should know about if the coin supply restricted or not. If it is restricted the increasing demand pushes the prices higher.
5. FOUNDERS. The projects with a great potential is driven by founders and developers which have already realized some successful projects. In the opposite case it is probably scam.
6. DOMINANCE. On TradingView you can find the market dominance of BTC, USDT, ETH and Altcoins. This is the demonstration of the capital flow between different cryptocurrencies. For example if the BTC dominance decreased and Altcoin dominance increased the Altcoin's prices are not so significantly affected by the Bitcoin price changes.
7. NEWS. This is the most important part of FA, especially for the large cryptocurrencies. Thus the positive news push the price higher, while negative one entail dumps.

Bollinger Bands. An imperfect strategy for an imperfect world.I have seen and tested many strategies in my trading history but I have yet to find anything that can guarantee a 50% or higher win rate (And that 50% rate is before fees and taxes!). Bollinger bands do not provide a competitive edge, but rather, provide something more important to a retail trader. Clarity.
Bollinger bands are based on the standard deviation of the price of an asset at the current point. Standard deviation (std dev) is based on normal distribution. If you dont know what this is, thats okay. All you need to know is after 3 std dev 99.7% of prices are included. This can be used as an imperfect probability metric as only 0.3% of price points over the last 200 days lay outside of the green bollinger band shown above.
Regardless of biases, news and other such factors, bollinger bands can be used to guage whether a liquid asset is cheap or expensive.
As seen on the graph above, everybody's favourite asset (BTCUSD) can be traded with this simple 200 day bollinger (3) and (4) on daily price metrics. However, don't use indicators as a ground rule for strategies. Low liquidity assets and small timeframes significantly reduce the effectiveness of bollinger bands. Furthermore, I would not use bollingers for shorting or leveraged positions as the price has no obligation to obey its standard deviation metrics.
I recommend using bollingers on a spot position of liquid assets as displayed in the above graph. (Notice "position" not "Whole account" as all strategies should be)

Should you buy bitcoin or gold?Gold and bitcoin are two assets that have a lot of die-hard “ true believers ,” people for whom the asset class seems like essential investments. They also each have severe detractors who argue that one or the other is not a good investment at all.
Does the rapid rise in the bitcoin price and the slide in the gold price over the past several months indicate that bitcoin is sapping demand from gold? The short answer is no, because the performance of gold makes sense without reference to bitcoin. A longer answer requires discussing the major differences between gold and bitcoin.
It seems like a perfect time for crypto traders to say “I told you so” and pour more money into the most popular cryptocurrency, celebrating its triumph. Bitcoin has started 2021 with a new all-time high above $34,000 (£24,850, €27,724) and analysts remain bullish about the cryptocurrency’s strong performance in the next 12 months and beyond.
Bitcoin has tripled in value during 2020, showing steady growth even when the stock market was severely hit by the Covid-19 pandemic. With the US dollar weakening, Bitcoin and other popular cryptocurrencies continue gaining more attention as traditional investors are looking to diversify their portfolio and to get better return on investments.
Bitcoin’s mainstream adoption is also supported by the growing interest of the institutional investors. Payment giant PayPal (PYPL) has already embraced Bitcoin. JPMorgan analysts share this view, saying that the adoption of Bitcoin by institutional investors has only just begun and they added that the price of gold would suffer because of this in the coming years.
In 2020, the price of gold has jumped over 30 percent from $1,517 per ounce on January 3, 2020 to over $2,000 per ounce on August 6, 2020. The spike in the price of gold isn’t yet at the level reached in the 2017 Bitcoin boom when the price of one Bitcoin rose from $999 on January 1, 2017 to $3,270 on August 6, 2017, an increase of over 300 percent. The demand for gold in 2020 is driven in part by investors seeking a perceived safe harbor from uncertainties in traditional asset classes caused by the COVID-19 pandemic and, in part, by speculation. But similar to the Bitcoin bubble, much of the recent demand for gold as an investment comes from retail investors.
But bitcoin has been called blockchain gold, which begs the question — how similar are they as an investment?
Both are considered safe-haven assets
Gold will always be a safe haven for investors. We can say the same thing about Bitcoin. As the oldest and most well-known cryptocurrency there is, Bitcoin has been somewhat of an ever-present and durable investment. Bitcoin has recently become something that investors flock to in a time of financial distress.
Both have a limited supply
There will only ever be 21 million bitcoins in circulation, that much we know for sure. This makes Bitcoin a limited digital asset, as after the 21 million are mined (predicted to be in 2140), there will never be more Bitcoin released, this makes it similar to gold in some ways.
Although gold may not run out as quickly as Bitcoin, studies have shown that gold production may be declining and may become economically unsustainable by the year 2050. This is due to the fact that humans have extracted all of the “easy gold” therefore, we have to dig deeper into the earth to retrieve the nuggets. This also means that gold is also a limited asset.
Both are speculative investments
A speculative investment is when the asset in question has a high degree of risk where profit depends a lot on the price fluctuations of the market. Bitcoin, with its famous volatility, can definitely be categorized as a speculative investment. Gold isn’t as well-known for being as volatile as Bitcoin, but it is still considered a speculative investment as investors buy with the hopes of holding it until significant gains can be made.
comparing the two
There are far more differences than similarities between these two assets. It is somewhat strange how they are lumped together when one looks closely at the details.
For hundreds of years, gold has dominated the safe-haven asset arena, while bitcoin was launched just over a decade ago and has only achieved widespread recognition in the last few years. Below, we'll compare these two investment options head-to-head:
Transparency, Safety, Legality
Gold’s established system for trading, weighing and tracking is pristine. It’s very hard to steal it, to pass off fake gold, or to otherwise corrupt the metal. Bitcoin is also difficult to corrupt, thanks to its encrypted, decentralized system and complicated algorithms, but the infrastructure to ensure its safety is not yet in place.
Rarity
Both gold and bitcoin are rare resources. The halving of Bitcoin's mining reward ensures that all 21 million Bitcoin will be out in circulation by the year 2140. While we know that there is only 21 million bitcoin that exist, It is unknown when all the world's gold will be mined from the earth. There is also speculation that gold can be mined from asteroids, and there are even some companies looking to do this in the future.
Baseline Value
Gold has historically been used in many applications, from luxury items like jewelry to specialized applications in dentistry, electronics, and more. In addition to ushering in a new focus on blockchain technology, bitcoin itself has tremendous baseline value as well. Billions of people around the world lack access to banking infrastructure and traditional means of finance like credit. With bitcoin, these individuals can send value across the globe for close to no fee. Bitcoin's true potential as a means of banking for those without access to traditional banks has perhaps yet to be fully developed.
Liquidity
Both gold and bitcoin have very liquid markets where fiat money can be exchanged for them.
Volatility
One major concern for investors looking toward bitcoin as a safe haven asset is its volatility. One need look only to the price history of bitcoin in the last two years for evidence. At its highest point, around the beginning of 2018, bitcoin reached a price of about $20,000 per coin. About a year later, the price of one bitcoin hovered around $4,000. It has since recovered a portion of those losses, but is nowhere near its one-time high price point.
Besides overall volatility, bitcoin has historically proven itself to be subject to market whims and news. Particularly as the cryptocurrency boom swept up a number of digital currencies into record-high prices around the end of 2017, news from the digital currency sphere could prompt investors to make quick decisions, sending the price of bitcoin upward or downward quickly. This volatility is not inherent to gold for reasons mentioned above, making it perhaps a safer asset.
In recent years, a number of alternative cryptocurrencies have launched which aim to provide more stability than bitcoin. Tether, for instance, is one of these so-called "stable coins." Tether is linked with the U.S. dollar in much the same way that gold was prior to the 1970s. Investors looking for less volatility than bitcoin may wish to actually look elsewhere in the digital currency space for safe havens.
Gold’s history spans back over ten thousand years and across the globe, while bitcoin has existed for a little more than a decade. The former is a physical object that can be worked into many shapes and sizes, whereas bitcoin only exists in the digital realm.
The key advantage of bitcoin over gold
Gold is much less practical for day-to-day use than bitcoin. The latter may have its flaws, but at least in theory, it allows for near-instant digital micro-transactions without a centralized bank in the middle.
One cannot typically buy a cup of coffee with physical gold. There are some workarounds such as debit cards that payout from a physical gold stash held by a third party, but these are edge cases. The core point of bitcoin is to allow for a new kind of transaction, nearly instant and frictionless, which is essentially opposite the nature of gold.
The worst case scenarios for gold and bitcoin investors
What is the worst case for investors in each asset class? Gold has an interesting possible worst-case scenario: Asteroid mining.
Some people believe that the current wave of space entrepreneurship from Elon Musk’s SpaceX and Jeff Bezos’s Blue Origin could lead to asteroid mining that will bring substantial additional amounts of gold into the earth’s marketplace. This could theoretically increase the supply of gold, no alchemy needed, and thus lower the price of gold, hurting investors.
It may sound like science fiction, but one may need to really consider the future impact of space exploration on gold assets. For anybody thinking about investing in large amounts of gold and passing it down to their grandchildren, this could be a real problem.
For bitcoin, the worst case is more immediate: The system could simply fail. This could happen through market pressure if the optimists are wrong and the economic system collapses as a bubble like the famous Tulip Mania of the 1600s. It could also result from some unforeseen technical glitch or attack vector being discovered and ruining the security of the system.
The simplest way that bitcoin could fail would be through a massive disruption of the internet. If a solar event knocked out all of the computers in the world, bitcoin’s transaction history would simply vanish.
Ethereum founder, Vitalik Buterin warned in tweets that cryptocurrencies are “still a new and hyper-volatile asset class, and could drop to near-zero at any time”. Gold will always have the advantage of having intrinsic and traditional value.
On a general note both are good investments depending on your risk appetite.

Trend Channel Trading GuideHello, dear subscribers!
Today we are going to discuss a very important topic of the trend trading.
The trend channel is the most reliable tool of the trading during the trends.
Here is an example of the ascending trend channel. For novice traders it is recommended to execute trades only in the direction of a trend.
First of all we should determine the trend channel. The white part of a channel is the formation phase. Here we can find multiple bounces off the lower and upper channel's bands. As a result these band are defined.
The green part of a channel corresponds to the trading time. Let's consider an example of long positions execution. We can do it when the price bounced off the lower band. For the take profit level defining we recommend to use the significant resistance level, like a green line on the chart.
We should be conscious about the potential trend channel's breakout (red point). The breakouts can be fake, but if the price faced with the rejection (red area) for the attempts to re-enter the channel it can be the sign of the potential trend reverse, as we can see at this example.
We will continue this topic with other examples of trend channel if you are interested in it.
DISCLAMER: Information is provided only for educational purposes. Do your own study before taking any actions or decisions.

Bitcoin Triangle Trading: Do they work?One of my followers on Tradingview pointed out that there is an abundance of ideas about the TRIANGLE on Bitcoin. It's great the pass the time drawing pretty pictures but can traders actually make money from them?

Bearish Gartley Pattern - The Warning SignHello, dear subscribers!
Let's consider the most common bearish sign which can be founded on the market - the bearish Gartley formation.
This pattern takes place when there was a huge dump like from point X to point A. After that we have the small bounce from A to B, but the decline continue from B to C. There is a massive growth almost to the the X point level (see point D) at the end of this price action.
It seems that the downtrend is over and bulls dominate again. We can see two signs of the new uptrend beginning: the higher lows (point C is higher than A) and highs (point D is higher than B).
Here is a big danger now. Until the price is not reached the X point level, the bearish Gartley pattern formation can play. If the Gartley pattern have approximately the same characteristics as numbers on the chart there is the high probability of price dump to the price level between points A and C.
Be very careful when you analyze the trend reverse opportunity, this bearish sign can take place.
DISCLAMER: Information is provided only for educational purposes. Do your own study before taking any actions or decisions.

Understanding Market Cycles and PhasesUsing Bitcoin as a example, in this idea i am going to briefly explain the concept of Market Phases in a easy to understand way.
Market Cycles & Phases
Cycles are prevalent in all aspects of life; they range from the very short-term, like the life cycle of a insect, some which can live a few days, to the life cycle of a planet, which takes billions of years.
All financial markets go through the same phases and are cyclical. They rise, top out, drop, and then bottom out. When one market cycle is finished, another begins.
The problem is that most investors and traders either fail to recognize that markets are cyclical or forget to expect the end of the current market phase.
There are 4 key phases in a Market Cycle:
1. Accumulation
The heavy buying phase before the uptrend begins.
2. Mark Up/ Re accumulation
Mark Up is the uptrend, Re accumulation phases are sideways pauses in the uptrend where more buying occurs before continuation of trend.
3. Distribution
The heavy selling phase before the downtrend begins.
4. Mark Down / Redistribution
Mark Down is the downtrend, Re distrubution phases are sideways pauses in the downtrend where more selling occurs before continuation of trend.
Trend
The dictionary definition of trend: *a general development or change in a situation or in the way that people are behaving. In financial markets the direction the price of a asset is moving is referred to as the trend.
Markets are made up of several different kinds of trends, and it is the recognition of these trends that will largely determine the success or failure of your long and short-term investing.
There are 3 key trends in Markets:
1. Bullish (upwards, buyers in control) (higher lows, higher highs (HL, HH)
The Mark Up phase is an uptrend or bullish trend.
2. Bearish (downwards, sellers in control) (lower highs, lower lows (LH, LL)
The Mark Down phase is an downtrend or bearish trend.
3. Consolidation /Sideways (sideways, direction & control undecided temporarily)
Re accumulation & Re distrubution phases are consolidation phases or "pauses" in the market before continuation of trend or reversal.
It is essential to understand Market Cycles, Phases & Trends, which are important behavioral characteristics of how price develops over time. By fully understanding these concepts and how one can identify them, a trader or investor can generate more opportunities, secure a longer term plan reducing stress levels, and potentially maximize profits.
Once a asset has already moved on from the Accumulation phase the next best buying opportunity is the Reaccumulation phase (marked in yellow) where price usually starts to zigzag in a sideways movement after a strong upwards movement. The Reaccumulation phase is where the price is usually "held down" by large transactions, while buyers fill positions, eventually the price can no longer be held down and we see the continuation of the Mark Up.
If you found the idea informative you can show your appreciation by leaving a like or comment thank you!

BTC and the pi algo top predictor? In this video, we go into great detail describing the theory of the pi indicator, Fibonacci multipliers, and how these 2 alone could show how tops were predicted in the past and potentially the upcoming top. This is the stuff people would kill to know ahead of schedule. I would urge you to play with the math behind this.
As above, so below and there is nothing new under the sun...

The Biggest Mistake I Faced In TradingLet's imagine you decided to become a trader. You are very motivated guy, study technical and fundamental analysis every day. Three months later you have learned a lot of information, know all about indicators and chart patterns.
Using these knowledges you developed your personal trading strategy, backtested it and decided that it's profit and accuracy are appropriate for you.
It is time to make money using this strategy.
The strategy triggered to the current price action and you executed, for example, the long position, but.... the price started to move down and you see that your deposit is decreasing. You say: "Okay, it is normal situation", but subconsciously afraid of the potential loss.
You are monitoring the price action and waiting for the price reverse in the appropriate direction, but the price continue fall down. You decided to close the position before it is too late. You did it. And the next moment the price started to go up. Later you found that your position could be closed in profit, but because of your fear you lost money.
The fear is the worst enemy of the trader. Even if you have the best trading strategy you will lose your money due to your fear. It is not easy to do but just imagine that your trading sessions is just a game and there will no bad effects for you despite your trading decisions. You should believe in your skills and destroy the fear to make money.
This is the biggest problem i faced in trading!
DISCLAMER: Information is provided only for educational purposes. Do your own study before taking any actions or decisions.

Bull flags explainedBull Flags are one of the most well known & easily recognized chart patterns.
The most important factor in identifying any flag pattern is the clear "staff" or "flagpole"; there should be a straight run upwards leading up to the pattern or it is not a valid pattern.
After the straight run upward price starts to Zig Zag between two converging trendlines forming a tight wedge (it can be slanted, or even symmetrical) until the price "breaks out" above the upper trendline signifying a possible continuation in trend upwards.
Bull Flags have the highest success rate out of any pattern and work extremely well when paired with long term support & resistance areas. Enter at the invalidation point of the pattern (A), second entry on the bullish retest (B). Pennants that are “tighter” have higher success rates, look for patterns forming on top of long term resistances (not below) to increase probability of success also. Pattern height is measured and added to swing low before breakout for possible target.
Sometimes large size traders can generate liquidity by faking out under the pattern support as we can see on some of the examples. The liquidity generated by triggering stop losses underneath the pattern can fill large position sizes for whales and is a good indicator for a long position once the price confirms support back inside the pattern.

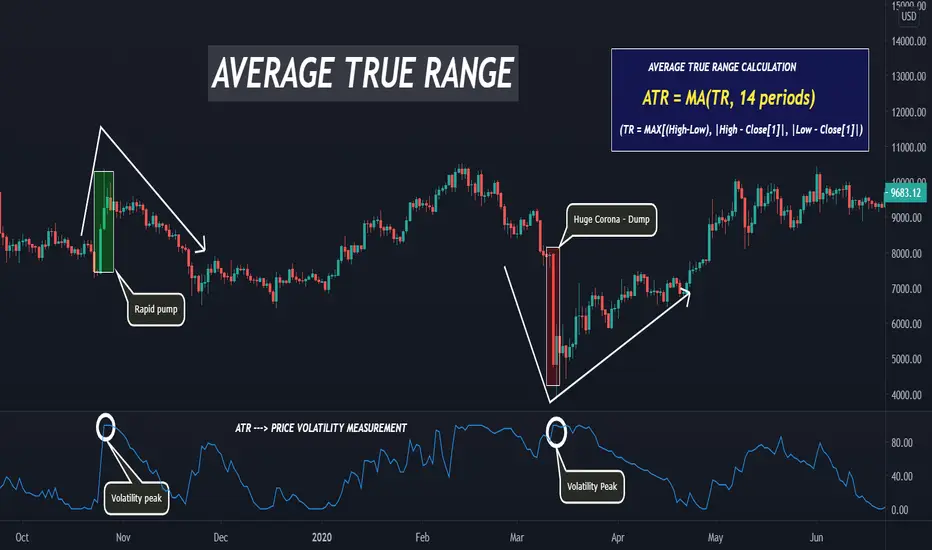
Volatility Measurement: Average True Range Hello, dear subscribers!
The market volatility measurement is a very important for the trading strategies constructing. One of the most appropriate and effective way to do it is to use the Average True Range (ATR) indicator.
How to calculate ATR?
First of all we should receive True Range value and calculate it's moving average on 14 periods. The True Range is a maximum of three values:
1. High - Low
2. Absolute value of (High - Previous candle close)
3. Absolute value of (Low - Previous candle close)
Thus, this indicator takes into account not only the current candle prices, also for the previous candle.
How to use it?
This indicator can't help to define the future price action direction but it can be very useful in combination with other indicators. The most appropriate way is to combine it with any oscillator. The oscillator will help you to identify the overbought and oversold conditions or bullish/bearish divergences, as a result you can define the direction of potential price move. The ATR will define the best entry point when the price on the minimum/maximum level.
ATR is greatly triggered on huge pumps and dumps, as you can see on the chart after that price usually has a correction which can be used in your trades.
DISCLAMER: Information is provided only for educational purposes. Do your own study before taking any actions or decisions.
Educational chart on current danger with BTCSo this is example of classic trading textbook pattern called Head and Shoulders where breaking the neck line results the down trend. This is just educational chart on the current possibility with 4h and 1h bitcoin/usd chart. Pattern is not complete yet, breaking 30000$ is hard since it is strong psychological support level. And at 30k$ massive rejection is seen as well.

Dead Cat Bounce ScenarioHello, dear subscribers!
Today we are going to examine a very interesting chart pattern which can help you to find the hidden danger in the market.
The dead cat bounce is the reverse bearish pattern, hence the market should be in the uptrend before it's formation.
After the swing high point is reached the sharp price drop usually follows. When we are able to identify the swing low we shoud measure the first bounce height. For this purpose we can use the Fibonacci retracement levels from the swing high to the swing low.
For the traditional markets it is typically used the 0.5 Fibonacci level, but on the cryptomarkets the 0.61 level can be used too due to high volatility.
If the price was unable to close above this Fibonacci level during the first bounce, there is a high probability of dead cat bounce scenario, when the price continue to fall and the global downtrend changes the uptrend.
We use the current Bitcoin price action to illustrate this pattern. There is a big danger now to execute exactly this scenario. Please, be careful!
DISCLAMER: Information is provided only for educational purposes. Do your own study before taking any actions or decisions.

Utimate Wickoff Cycle Guide PART 1. ACCUMULATION CYCLE
Wickoff Theory
The Wyckoff theory describes many aspects and rules of trading. The main problem of the theory is the demand/supply balance. It is widely known that this balance is the key reason of some price action on the market. Today we are going to consider the Wickoff Cycle pattern. Let's start with the accumulation one.
WIIckoff Events
Key elements of the theory is the price action, spread and volume. The possible acuumulation cycle Wickoff events are following.
1. Preliminary Support (PS) - price in the downtrend, volume and price spread increase
2. Selling Climax (SC) - price spread is large, all selling volume is absorbed by major investors. Here we can see the long wick bottom
3. Automatic Rally (AR) - when the bearish pressure decreased the bulls became dominant.
4. Secondary Test (ST) - price returns almost to the SC. Used for the bottom confirmation. Volume and spread are much lower than in SC. Can be multiple.
5. Spring - it is optinal event. Occures when the selling pressure is strong but major investors have a greter demand to absorb all this supply
6. Tests - can be multiple. Attempts to re-enter the trading range low. Bullish tests is the less volume with higher lows of the price action
7. Sign of Strength (SOS) - price action along the resistanse usually looks like a triangle or wedge pattern
8. Back-up/Last Point of Support - last low before the uptrend starts
Wyckoff Cycle
Let's consider step-by-step the phases of the Wyckoff cycle.
1. Phase A - the huge downtrend is about to end. We can identify the PS, SC and AR points which form the resistance and support of the trading range.
2. Phase B - price action is in the trading range. The mutiple secondary tests (ST) of the support are possible. During this phase it should be alomost clear that bullish pressure is stronger than bearish.
3. Phase C is optional. There is could be the spring - fake support level breakout, but the price quickly returnes to the trading range forming higher lows.
4. Phase D - the price broke through the resistance and starts consolidate along it.
5. Phase E - massive price pump.
DISCLAMER: Information is provided only for educational purposes. Do your own study before taking any actions or decisions.

📖 A Guide to RSI Divergences - By Trading-GuruIn this guide I will walk you through the three main different kind of divergences and explain to you how you can spot them.
I also show you the extreme power RSI divergences have by looking at BTC/USD and mark them on the chart. It's quite special to see all these three kinds immediately after another, and it's really nice to see them all working out here as well.
Obviously, no signal will not provide a 100% success guarantee. But this text-book example on the BTC price showing how they work out every time is great for both learning and profit taking.
It can be very hard to trade an asset that has seen such immense growth and nearly vertical upwards momentum. Using RSI divergences you will still be able to predict price reversals and trade successfully. So let's take a closer look at the three different forms of RSI divergences that I cover here on the chart.
Exaggerated Divergences
Exaggerated divergences are similar to regular divergences, but are considered weaker and less predictive variations. The term exaggerated refers to a circumstance where either the oscillator or price makes an equal high or low.
Regular bullish divergences and regular bearish divergences both have two exaggerated variations, so there are four exaggerated variations in total. In this case we look at a bullish version where the price is consolidating the but the RSI shows an increase in momentum.
Hidden Bullish Divergences
A Hidden Bullish Divergence is considered a continuation signal in an uptrend. It refers to a circumstance where an oscillator reading falls down below its previous low, while price is still higher than its previous low.
Hidden bullish divergences are most likely to occur in the middle of an uptrend – often after a healthy pull back – and indicate that the uptrend will most likely continue.
The starting point of a hidden bullish divergence should be a clear swing, not just a red candlestick.
Regular Bearish Divergence
A Regular Bearish Divergence is considered a strong reversal signal in an uptrend. It refers to a circumstance where price rises and makes a higher high, while the corresponding oscillator reading is still lower than its previous high.
Bearish divergences are most likely to occur in strong uptrends and signify that upward momentum is weakening. A reversal – or at least a pull back – is then expected to follow. Regular bearish divergences also appear in exaggerated form.
Follow me for consistent high quality updates, with clear explanations and charts.
Please like this post to support me.
- Trading Guru
--------------------------------------------------------------
Disclaimer!
This post does not provide financial advice. It is for educational purposes only!

Leave it, Grab A Cup Of Coffee And Relax ☕So, we are reaching the end of the year folk.. 2020 will be gone.. HAPPY NEW YEAR..
What a year it was.. Lot's of ups and downs, We saw both 3000 and 24000 price channel in just one year.. We've experienced Covid-19 and the quarantine.. What a journey!!! We've learned a lot together from this year..
I tried my best to give you my experience on trading, analysis, technical/fundamental parameters and newest oscillators.. I hope you found them useful for yourself and you're satisfied..
I wanted to add one more important tip about market near new year.. All the capital markets, including crypto market, are so risky near and in this big holidays.. Most of big companies closes their 2020 financial reports top traders stop trading for a break or going to holiday and etc.. These reasons make all the markets so volatile and risky.
I strongly recommend you to stop trading until mid-January.. Just relax, try to enjoy holidays.. Try to have some time with your family and your loved ones.. These holidays are extraordinary time for you to update your knowledge on the market.. Try to learn something new so you can have a progress for new year of trading.. Try not to be temped to make profit during the holiday, because you're going to regret it with a big loss.. And by the way, You came a long way studying the market this year, you deserve a rest.. We all do deserve it..
For my final words in this post, I want to thank you for accompanying me during this journey that was a great honor for me, I hope you enjoyed it too..
I have a little request.. I really love to read your comments about my idea that I gave you this year, I want to know what do you think about them? How useful were them to you? And the most important thing is that what do you suggest me to write about in upcoming year for you??
If you have friends that you think My profile and ideas can help the give the my address so we all can learn and gain from the market and make our educational community larger and stronger..
I'm waiting to read your comments below my friends, Wish you a great 2021 and HAPPY NEW YEAR...

EDUCATION: PitchforkHello, dear subscribers!
Today we are going to consider a very important tool of trend trading - the pitchfork.
What is the Pitchfork?
The pitchfork is the variant of the trend channel. The difference is that pitchfork has an inner additional channel inside the big main trend channel. The median or the centraline divides these channels in to two parts. It is commonly known that the price usually tends to vary in the upper or lower pitchfork half. Thus the price can often find support and resistance next to resistance, support and central lines.
Support, resistance and breakouts
When the price breaks through the central line the price changes the half of the pitchfork. Sooner or later there will be the massive brakeout as a result of which the price escape the pitchfork. In our example the price broke through the resistance line and found the support above it. If the price has an attempt to return back to the pitchfork and this attempt was rejected we can expect the massive price growth.
Trading
Let's talk about the trading opportunities into pitchfork. We should observe carefully the monents when the price is next to the resistance, support or centraline. If there is a confirmation of the bounce off it the position should be executed in the direction of this bounce.
DISCLAMER: Information is provided only for the educational purposes and should not be used to take action in the markets.

Trading Chaos Method for BTCUSDTwe have the 1st and 2nd wise man in bearish trend for btcusdt
also the gator is sleeping for 1h time frame
so we wait for 3rd (which is breaking the fractal)
or
wait for the bullish divergence bar to put a stop on this down trend

Bitcoin Dip Buying - Part 2: Risk ManagementSo we finally got a signal today! The alert conditions of the indicator worked as intended for me and others that DM'd me. Having a signal to trade is the start but it is worthless without having a proper trade structure around it to build a strategy.
To that end I have updated the indicator with an automatically drawn entry, stop, and target that can be user defined to personal risk profiles.
This video talks about today's dip and explains how to use the new functionality of the indicator. Once again and always this is free for people to learn and hopefully profit. Any questions just leave comments below!

EDUCATION: Logarithm Growth Curve Hello, dear subscribers!
Today we are going to examine very simple and intersting instrument which is applicable for the global price movement analysis.
The logarithm growth curve is based on Fibonacchi retracement levels. As it is known the Fib retracement based on swing high and low levels. But in case of growth curve we use the logarithm scale to take in account the periods of the fast growth (to the moon periods).
The price usually faces with difficulties to break through the Fibonacci levels. We can notice massive pullbacks near these levels or the price growth in cases of breakouts.
Let's consider the current situation on the Bitcoin market. There is a rejection of 50% Fibonacci level. Now we should observe if the price break through this level or the drop began now. If the first scenario occurs we can see a massive growth to 61% or 100% Fibonacci levels.
DISCLAMER: Information is provided only for the educational purposes and should not be used to take action in the markets.

BITCOIN 325,000$ BLOW OFF TOP!in 572 days bitcoin will be 325,000 and all currency will be blockchain...BECAUSE WE NEED TO SLOW THE SPREAD? lol.
If bitcoin can survive a bioweapon like sarscovid-2, BITCOIN CAN SURVIVE ANYTHING!
Seriously though...the only time the long term trendline was broken...WAS WHEN WE STOPPED FREE COMMERCE to save our grandmas...or whatever...I guess.
