From Fiat to Crypto: A Pragmatic View on Cross-Asset USD Impact1. Introduction: Why Understanding USD Impact Matters
The U.S. dollar (USD) plays a pivotal role in shaping global financial markets, especially for assets denominated in dollars, such as S&P 500 Futures (ES/MES). Its movements affect equity market flows, international capital dynamics, and, ultimately, price trends for USD-denominated instruments. However, traditional methods of gauging USD strength often fall short of capturing the nuanced interplay between fiat currencies and emerging digital assets.
To bridge this gap, we introduce a pragmatic and dynamic solution: the USD Proxy. By combining a carefully weighted mix of key global currencies (Euro and Yen) with Bitcoin (BTC), this proxy provides a comprehensive and CME-specific lens for understanding USD strength. It is a modern approach to assess the dollar's “true” influence on equity markets, particularly the S&P 500 Futures.
2. The USD Proxy: A Pragmatic Cross-Asset Index
The USD Proxy is built to reflect real-time market dynamics, offering traders a potentially more relevant measure of the dollar’s impact. Unlike static indexes, this proxy is dynamic, continuously adjusting based on three major components:
Euro Futures (6E): Representing the largest fiat currency trading block.
Japanese Yen Futures (6J): Capturing the Asian market's influence.
Bitcoin Futures (BTC): Adding a layer of innovation by integrating cryptocurrency, which operates independently of traditional fiat systems.
The weighting is determined by notional values, market prices, and volume-weighted activity as volumes change and evolve through time, ensuring the proxy adapts to liquidity and relative importance. This structure provides a balanced view of USD strength across fiat and crypto markets, making it highly applicable to modern trading.
3. Adjusting S&P 500 Futures Using the USD Proxy
To uncover the “true” equity market performance, the S&P 500 Futures can be adjusted using the USD Proxy. The formula is straightforward:
Adjusted S&P 500 Futures = S&P 500 Futures Price x USD Proxy Value
This adjustment neutralizes the effects of USD strength or weakness, revealing the core price action of the equity market. By doing so, traders can distinguish between moves driven by dollar fluctuations and those stemming from genuine market trends.
For example, during periods of a strengthening USD, the unadjusted S&P 500 Futures may appear weaker due to currency pressure. However, the adjusted version may provide a clearer picture of the underlying equity market, enabling traders to make more informed decisions.
4. Regular vs. Adjusted S&P 500 Futures: Key Insights
The comparison between regular and USD Proxy-adjusted S&P 500 Futures charts could reveal critical divergences that may have been often overlooked. These divergences highlight how currency fluctuations can obscure or exaggerate the equity market’s actual performance.
For instance, while the S&P 500 Futures have recently reached new all-time highs, some market participants may view this as an indication of the market being overpriced. However, when adjusted using the USD Proxy, the chart reveals a different reality: the S&P 500 Futures are far from their highs. This adjustment aims to neutralize the currency's impact, uncovering that the recent record-breaking levels in the unadjusted chart are likely largely influenced by USD dynamics rather than true underlying equity market performance.
5. Trading Opportunities in Adjusted S&P 500 Futures
The adjusted S&P 500 Futures chart opens up new possibilities for traders to identify actionable insights and anomalies. By neutralizing the currency effect, traders can:
Spot Relative Overperformance: Identify instances where the adjusted chart shows strength compared to the regular chart, signaling robust underlying equity market dynamics.
Capitalize on Potential Anomalies: Detect price-action discrepancies caused by abrupt currency moves and align trades accordingly.
Refine Entry and Exit Points: Use the adjusted chart especially during high-volatility periods influenced by the USD.
6. Trading Application: A Long Opportunity in Adjusted S&P 500 Futures
Trade Setup:
o Instrument: S&P 500 Futures (ES) or Micro S&P 500 Futures (MES).
o Entry Point: Around 5900.00
o Targets:
Primary Target: 6205.75 (aggressive traders, Fibonacci extension level).
Conservative Target: 6080.00 (moderate traders, earlier Fibonacci extension).
o Stop Loss: Below the entry, calculated to maintain a 1:3 reward-to-risk ratio.
Rationale:
The adjusted S&P 500 Futures chart highlights a technical setup where the price is reacting to:
Breakout to the Upside: The adjusted chart is breaking out of a key resistance level, signaling potential continuation of upward momentum.
The 20-SMA: Acting as dynamic support, aligning with recent price behavior.
Technical Support Level: A key horizontal level.
These converging factors suggest the potential for a bullish continuation, targeting Fibonacci extension levels at 6205.75 or 6080.00. The adjusted chart provides added confidence that the move is not overly influenced by USD fluctuations, grounding the analysis in equity-specific dynamics.
Trade Mechanics:
o Instrument Options:
ES (full-size contract), with a point value of $50 per point.
MES (micro-sized version), designed for smaller accounts or precision risk management, with a point value of $5 per point—10 times smaller than the full-size ES contract.
o Margins (approximate, depending on broker):
ES: Approximately $15,000 per contract.
MES: Approximately $1,5000 per contract—10 times smaller than the ES margin.
Execution Plan Example:
Place Buy Limit Order at 5900.00.
Set Stop Loss below the entry, maintaining a 1:3 reward-to-risk ratio.
Take partial profits or adjust stop losses as the price approaches 6080.00 for conservative traders or 6205.75 for aggressive targets.
7. Conclusion: A Fresh Perspective on USD and Equity Futures
By introducing the USD Proxy and applying it to S&P 500 Futures, traders gain a powerful tool to assess market dynamics. This cross-asset approach—spanning fiat and crypto—bridges the gap between traditional and modern financial metrics, offering unparalleled insights.
The adjusted S&P 500 Futures chart neutralizes currency distortions, revealing the market's true movements. Whether identifying divergences, refining trading strategies, or uncovering hidden opportunities, this method empowers traders to approach the market with clarity and precision.
As markets evolve, tools like the USD Proxy demonstrate the importance of integrating diverse assets to stay ahead in a complex trading environment.
When charting futures, the data provided could be delayed. Traders working with the ticker symbols discussed in this idea may prefer to use CME Group real-time data plan on TradingView: www.tradingview.com - This consideration is particularly important for shorter-term traders, whereas it may be less critical for those focused on longer-term trading strategies.
General Disclaimer:
The trade ideas presented herein are solely for illustrative purposes forming a part of a case study intended to demonstrate key principles in risk management within the context of the specific market scenarios discussed. These ideas are not to be interpreted as investment recommendations or financial advice. They do not endorse or promote any specific trading strategies, financial products, or services. The information provided is based on data believed to be reliable; however, its accuracy or completeness cannot be guaranteed. Trading in financial markets involves risks, including the potential loss of principal. Each individual should conduct their own research and consult with professional financial advisors before making any investment decisions. The author or publisher of this content bears no responsibility for any actions taken based on the information provided or for any resultant financial or other losses.
Bitcoin (Cryptocurrency)

Trading is not a get rich quick scheme🔸Patience
▪️Market Timing: Not every moment is the right time to trade. Waiting for the ideal setup is crucial. For example, a patient trader waits for patterns, trends, or specific signals to align with their strategy.
▪️Compounding Growth: Wealth through trading often comes from compounding small, consistent gains rather than chasing big wins. This takes time to materialize.
▪️Recovery Time: Losses are inevitable. Patience allows traders to focus on gradual recovery rather than impulsively trying to "win back" losses.
🔸Discipline
▪️Sticking to the Plan: A trading plan is your blueprint. Discipline ensures you execute trades based on logic, not emotion.
▪️Avoiding Overtrading: The temptation to trade constantly can lead to unnecessary risks. A disciplined trader knows when to step back.
▪️Risk Management: Proper position sizing, setting stop losses, and avoiding over-leveraging are all practices rooted in discipline.
🔸Consistent Effort
▪️Continuous Learning: Markets evolve, and so must traders. Keeping up with new strategies, tools, and market conditions is essential.
▪️Routine Analysis: Reviewing past trades to learn what worked and what didn’t helps improve strategies.
▪️Building Experience: Expertise comes from time spent observing patterns, managing emotions, and handling a variety of market scenarios.
🔸Mindset
▪️Long-Term Thinking: Focus on building wealth slowly rather than chasing immediate profits.
▪️Resilience: Markets can be unpredictable. A strong mindset helps traders stay focused after setbacks.
▪️Adaptability: Successful traders adapt their strategies to fit different market conditions instead of forcing trades.
🔸The Journey, Not the Destination
▪️The idea of "getting rich" in trading is often a trap that leads to rushed decisions and excessive risk-taking. Instead, embrace the process:
▪️Track your progress: Measure success in terms of skill improvement, not just profits.
▪️Celebrate small wins: These build confidence and keep you motivated for the long haul.
▪️Remember, trading is a craft—those who approach it with respect, patience, and consistent effort are the ones most likely to achieve sustainable success.

What I wish I knew when I started Trading1. Study and Trade One Pair Only
Focusing on a single currency pair can streamline your learning and help you master market dynamics.
🔸Choose a Pair: Start with major pairs like EUR/USD or USD/JPY. These have high liquidity and predictable patterns.
🔸Understand Its Behavior: Learn the fundamentals and technical characteristics of the pair, such as its volatility, reaction to news, and typical trading hours.
🔸Backtesting and Practice: Use historical data to understand how the pair moves under different market conditions.
2. Losses Are Part of Trading
No trader is immune to losses. Handling them effectively is crucial for long-term success.
Mindset:
🔸Accept Losses as Learning Opportunities: View losses as part of the cost of doing business, akin to inventory in retail.
🔸Detach Emotionally: Avoid the temptation to revenge trade or let losses affect your confidence.
Practical Strategies:
🔸Set Risk Parameters: Only risk 1-2% of your trading account per trade. This limits the damage of a losing streak.
🔸Use Stop Losses: Predetermine the point at which you will exit a trade if it goes against you. This protects you from devastating losses.
🔸Keep a Journal: Document each trade, including reasons for entering, outcomes, and what you learned. Over time, patterns will emerge to guide improvement.
3. Develop Discipline and Patience
🔸Stick to a Trading Plan: Define your entry, exit, and risk management strategies before trading.
🔸Trade Less, Win More: Focus on high-probability setups instead of trading excessively.
🔸Give Yourself Time: Mastery in Forex trading can take years. Trust the process and aim for consistent improvement.
4. Build Resilience to Handle Losses
Self-Care:
🔸Step away from the charts after a big loss to regain perspective.
🔸Engage in activities that reduce stress, like exercise or meditation.
Review and Improve:
🔸Evaluate losing trades to identify errors.
🔸Adjust your strategy if recurring issues are found.
🔸Focus on the Big Picture:
🔸Track your performance over months or years, not days. This helps put individual losses into perspective.

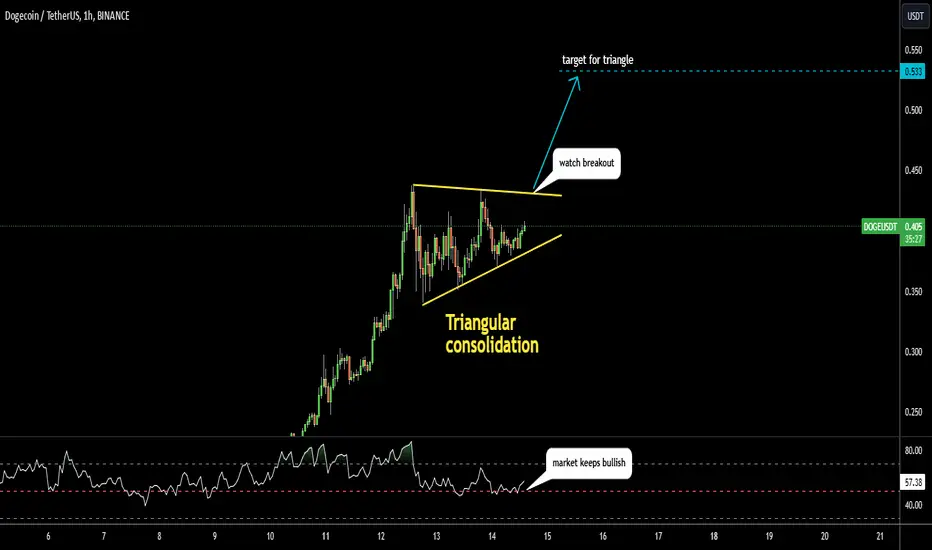
DOGE/USDt: Famous Pattern Indicates Continuation To The Upside Falling peaks and rising valleys have built famous Triangle pattern
on the hourly chart of DOGE/USDt.
It's a consolidation after a big rally, which means more upside move is ahead.
Watch the price to break out of the pattern.
The target is located at the widest part of Triangle added to the break point.
Its located at 0.533
Breakdown of Triangle would invalidate the pattern.
RSI has managed to keep above the neutral point during this consolidation.
This supports the idea of further move to the upside
Retail Traders Are Waking Up | Here’s How to Spot the SignsWhy Are Our Parents Texting Us About Bitcoin? It’s Getting Weird
Thanks to crypto,now I know my entire extended family and even my ancestors!
Some of them hadn’t spoken to me in a thousand years, but now they’re calling me “Bruh”
(And no, I’m not a vampire, by the way!)
Here’s why I think a retail fueled wave might be about to hit the crypto market
1/ A spike in Google searches for "crypto"
2/ Coinbase App Store rankings
The Coinbase app just shot up from #155 to #18 in two days
3/ Dogecoin and Squirrel on the rise
Retail traders have a soft spot for Doge , Cardano and memecoins.
Guess which top 10 tokens surged the most in the last week? bunch of retail traders who’ve held CRYPTOCAP:DOGE and CRYPTOCAP:ADA since the last bull run are probably getting alerts that their investments are bouncing back.(That’s one way to grab their attention)
4/ Bitcoin featured on Bloomberg's front page
Mainstream news = mainstream visibility = more pump = more lambo!
5/ Texts from our parents ( Are you winning son? )
The unique skill of being both endearing and critical at once a true dad specialty
6/ Ronald McDonald has joined the chat…
McDonald's just teased a new collaboration with Doodles (yes, the NFT project). It kicked off last week…Now, any one of these signs might not mean much alone
But taken together, they start to tell a different story.
Falling air pressure, strengthening winds, darkening skies… it looks like a retail storm might be on the horizon..Brace yourselves! The good news? This time might not be different.
Earlier in the year, there was concern about a potential “left translated cycle.”
(Translation: crypto prices rising faster than expected).
At first, that sounds great! (Who wouldn’t want a quicker path to wealth?)
But the catch is, the shorter the window for prices to peak, the harder it is to time safely
(you’d have days instead of weeks or months to sell near the top)
When Bitcoin reached all time highs ahead of the halving in March (a first), many traders started feeling “left-translated” jitters. If we stay on this track and hit the same average returns as the past three halving years, we could be looking at a ~$ 126k Bitcoin by year’s end!
Here’s hoping this time really isn’t different! BTC just hit a new ATH again!! STOP

Practical Application of Order Blocks in Trading🔸In trading, especially in the context of institutional and supply-demand-based strategies, order blocks, imbalances, breakers, and entry points are all critical elements for spotting potential high-probability trade setups. Here’s a breakdown of each:
1. Order Blocks
🔸Definition: Order blocks are areas where large institutional orders (by banks, funds, etc.) are believed to have been placed, often leading to sharp price movements. These typically form after a period of consolidation, when a large entity enters the market to create momentum in a particular direction.
Types:
▪️Bullish Order Block: An area where institutions have placed buy orders, resulting in an upward price move. It’s generally identified by a down candle (in a bullish trend) before a strong upward move.
▪️Bearish Order Block: An area with concentrated sell orders, leading to a strong price decline. It’s marked by an up candle (in a bearish trend) before a sharp downward move.
▪️Use in Trading: Traders look for price to return to these areas as potential entry points, expecting the area to act as support (for bullish order blocks) or resistance (for bearish order blocks).
2. Imbalances
🔸Definition: Imbalances (also called Fair Value Gaps or FVG) occur when there is a strong price movement in one direction, leaving a "gap" in liquidity. ▪️IThis happens when there’s more demand or supply than what the current orders can fulfill, leading to a price spike.
▪️Identification: Look for consecutive candles moving in the same direction without much overlap in their wicks. This often leaves a gap between the high of one candle and the low of the next.
▪️Use in Trading: Since price often "rebalances" itself, traders may expect price to return to this area before continuing its trend, using it as a potential point for entries in the direction of the larger trend.
3. Breakers
🔸Definition: A breaker is a failed attempt at reversing a trend, usually involving a break of structure that indicates a reversal but then fails, with price moving back in the original trend's direction.
Types:
▪️Bullish Breaker: When a downtrend is invalidated, but instead of continuing downwards, price reverses back up. The previous support level that price broke and closed below may now act as a support zone.
▪️Bearish Breaker: When an uptrend is invalidated, but price moves back down, often causing previous resistance to act as resistance again.
▪️Use in Trading: Breakers are often used to identify failed reversals where traders might enter in the direction of the initial trend, as these zones tend to have strong support or resistance.
4. Bullish and Bearish Breakers in Trading
Bullish Breaker:
▪️A level created after a failed bearish structure, turning into support as the price breaks upward.
Look for confirmation of price moving above this level, with entry points often at or just above the zone.
Bearish Breaker:
▪️A level created after a failed bullish attempt, creating a resistance zone as price breaks lower.
Traders enter trades when price retests this breaker level and shows signs of rejection.
5. When to Enter Trades
▪️Order Block Entry: Look for price to return to an order block zone (after creating it), confirming it as a valid area of support or resistance. Confirmation methods include candlestick patterns or lower timeframe support/resistance creation.
▪️Imbalance Entry: Price may "fill" imbalances, and traders can look to enter as price retraces to this level with signs of rejection or confirmation. Watch for candles rejecting at the edge of the imbalance zone.
▪️Breaker Entry: Wait for price to test the breaker zone and show signs of rejection, typically with a smaller time-frame entry trigger (like a lower high or low in structure).
▪️Risk Management: When entering trades based on these points, place stops beyond the zone or recent high/low, and target areas of the next significant support/resistance or opposite liquidity pools.
6. Tips for Effective Use
🔸Multi-Timeframe Analysis: Check higher timeframe levels for stronger order blocks or breakers and use lower timeframes to refine entry.
🔸Wait for Confirmation: Often, a test of these areas with a reversal candlestick pattern (like a pin bar or engulfing candle) on a lower timeframe will provide better entries than immediately entering.
🔸Volume Confirmation: Higher volume in these areas can suggest more institutional interest and improve the chance of a successful trade.
🔸Mastering these concepts involves observing how price interacts with these levels across different market conditions, which enhances accuracy over time.

Smart Money Market Structure Order Block Trading🔸The principles of "smart money" trading focus on understanding the behavior of institutional investors, often referred to as "smart money," to make informed trading decisions. By analyzing market structure, order blocks, supply and demand zones, and market cycles, traders aim to predict price movements and make profitable trades. Here’s a breakdown of these key concepts and how they interact:
1. Market Structure
Market structure is the fundamental flow of price movement, typically defined by highs and lows that indicate trends. The market can be seen in three primary states:
▪️Uptrend: Characterized by higher highs (HH) and higher lows (HL).
▪️Downtrend: Defined by lower highs (LH) and lower lows (LL).
▪️Consolidation (Range-bound): Prices oscillate between a support (demand) and resistance (supply) level.
▪️Understanding market structure helps traders identify when a market is trending or ranging, which is essential for timing entries and exits.
2. Order Blocks
Order blocks are areas on a price chart where large institutional traders, like banks and hedge funds, execute significant orders. These blocks often indicate strong levels of support or resistance due to the substantial buying or selling activity.
▪️Bullish Order Block: Typically found before a strong upward move. It's the last bearish (down) candle before the price rallies, signaling a demand zone.
▪️Bearish Order Block: Typically found before a strong downward move. It's the last bullish (up) candle before the price drops, indicating a supply zone.
▪️Order blocks provide clues to where "smart money" has entered the market, suggesting areas where price may return for liquidity and where retail traders may find good entry points.
3. Supply and Demand Zones
Supply and demand zones are similar to support and resistance levels but with a focus on identifying imbalances. They represent areas where supply (sellers) and demand (buyers) are significantly unbalanced:
▪️Demand Zone: A price range where buyers are strong enough to prevent further price drops. This often corresponds to an area of support.
▪️Supply Zone: A price range where sellers have historically stepped in to prevent further price increases, serving as resistance.
▪️Prices often revert to these zones due to liquidity needs, creating entry points for trend continuations or reversals.
4. Lower Highs (LH) and Higher Lows (HL)
These are essential markers in identifying trend changes:
▪️Lower Highs (LH): In a downtrend, the price fails to reach a previous high, indicating seller dominance and potential continuation of the downtrend.
▪️Higher Lows (HL): In an uptrend, the price creates higher lows, suggesting that buyers are gradually gaining strength, signaling a continuation of the uptrend.
These structural points help traders understand potential trend reversals or continuations.
5. Accumulation and Distribution Phases
These phases are critical to the Wyckoff Market Cycle:
▪️Accumulation: This phase represents a period where "smart money" accumulates positions at low prices. It typically occurs after a downtrend and is characterized by a consolidation or sideways price movement. This phase often signals a future uptrend.
▪️Distribution: This is the phase where institutional players offload positions after a significant price increase. Like accumulation, distribution appears as consolidation, often preceding a downtrend.
▪️Accumulation and distribution are often analyzed using volume patterns and price action to gauge when a trend may begin or end.
6. Market Cycles (The Wyckoff Theory)
Market cycles are a sequence of phases that price undergoes over time. According to Wyckoff’s methodology, there are four phases:
▪️Accumulation: Institutions build positions, often at a market bottom.
▪️Markup: After accumulation, the price starts to increase as demand outstrips supply.
▪️Distribution: Institutions sell off their positions, often at the top of the cycle.
▪️Markdown: Price declines as supply overwhelms demand, leading to a downtrend.
▪️Understanding these phases allows traders to anticipate potential turning points, which is critical in smart money trading.
Applying These Principles in Trading
The smart money trading approach uses these principles collectively:
🔸Identify Market Structure: Determine whether the market is trending or ranging, then identify order blocks, supply and demand zones, and significant highs and lows.
🔸Recognize Key Levels: Watch for accumulation and distribution phases at these levels, helping to anticipate likely future movements.
🔸Confirm with Volume: Use volume analysis to confirm accumulation or distribution activity.
🔸Set Entries and Exits at Smart Money Zones: Utilize identified order blocks and supply/demand zones to enter trades with the trend (markup or markdown) or exit before a reversal.
🔸By combining these elements, traders seek to align with the strategies of institutional investors, capturing trends early and minimizing exposure during less favorable periods.

Trend Direction and Trading Indicator TutorialThe Tenoris Trend Indicator determines support and resistance using a proprietary method that I've not seen in other indicators.
Over the last 10 days a potential gain of 15% on Bitcoin is shown on the chart.
The key is knowing which Red and Green arrows are most likely to indicate the reversal of the price trend from short to long or long to short (red to green or green to red arrows and boxes).
The arrows are used for trade entries and exits and the boxes in relationship to the price of a closed candle are used to predict price direction.
The time frame of the chart is critical for maximizing the accuracy of the indicator.
In general a 7D candle on crypto and a 30 day candle on stocks and a quarterly candle on indexes like the S&P provides the most accurate trend direction.
On Bitcoin a 4H candle chart can be successfully used to determine entires for short term trades lasting a few days. In extensive back testing and live trading a gain of 10% a month or more is consistently possible.
The key to using the indicator is knowing which arrows are the most indicative of a trend change. When a green candle closes above the red boxes it's likely that price is going to go from trending down to up. When a red candle closes below a green box it's likely that price will trend down.
Compared to moving averages, and other directional trend indicators the Tenoris Trend Indicator is superior in detecting trend changes much earlier than other methods of technical analysis commonly used.

Creating your Trading Plan🔸Creating a comprehensive trading plan is a foundational step for any trader, whether you are involved in forex, stocks, options, or crypto markets. A well-structured trading plan outlines your trading goals, strategy, risk management protocols, and the psychological mindset necessary for success. Let’s break down the core components: strategy, risk management, psychology, and confluence.
1. Trading Plan Strategy
A trading strategy is a set of rules or guidelines you follow to identify, enter, and exit trades. Here are the elements to consider:
▪️Market Selection: Define which markets you will trade (e.g., forex pairs, stocks, cryptocurrencies) and what your time frames will be.
▪️Trading Style: Will you be a day trader, swing trader, or a long-term investor? Your style will influence your strategy.
▪️Entry and Exit Rules: Specify the technical or fundamental indicators that will trigger your trades. For example, you might use moving average crossovers, support and resistance levels, or candlestick patterns for entry and exit points.
▪️Trade Execution: Outline how you will place trades and manage your orders (e.g., market orders, limit orders, trailing stops).
▪️Backtesting: Before committing real money, test your strategy on historical data to understand its effectiveness.
▪️Example: Suppose your strategy involves trading breakouts. You would define what constitutes a breakout, how to confirm it, and the risk/reward ratio you expect before taking a trade.
2. Risk Management
Risk management is about preserving your capital and minimizing losses. It's a critical part of any trading plan and focuses on controlling how much you stand to lose on each trade and how to protect your account over time.
▪️Position Sizing: Determine how much of your capital you will risk per trade. Many traders risk no more than 1-2% of their total capital on a single trade.
▪️Stop Losses and Take Profits: Always use a stop-loss to cap potential losses and set a take-profit order to lock in gains. This should be part of your trading strategy.
▪️Risk/Reward Ratio: Ensure that the potential reward on a trade is worth the risk. A common minimum risk/reward ratio is 1:2, meaning you risk 1 unit of currency to make 2. Diversification: Spread your risk by trading multiple assets or markets instead of concentrating all your capital in a single trade or asset class.
▪️Example: If your account balance is $10,000, and you decide to risk 2% per trade, the maximum loss you would accept on any trade would be $200. This would dictate your stop-loss placement and position size.
3. Trading Psychology
The psychological aspect of trading is often underestimated, but emotions can greatly impact your decision-making. Maintaining a disciplined and objective mindset is crucial.
▪️Emotional Discipline: Avoid trading based on fear, greed, or impatience. Develop routines that keep your emotions in check.
▪️Handling Losses: Accept that losses are part of trading and learn not to let them affect your confidence or decision-making. Sticking to your plan, even after a loss, is crucial.
▪️Confidence and Patience: Build confidence in your strategy through thorough backtesting and practice. Be patient and wait for high-probability setups.
▪️Avoid Overtrading: This happens when traders try to chase losses or enter trades impulsively. Stick to your plan and don’t trade just for the sake of it.
▪️Example: If you find yourself becoming anxious or stressed during a losing streak, take a break from trading to reassess your mindset. Practicing mindfulness or keeping a trading journal to reflect on your emotions can be very helpful.
4. Confluence
Confluence in trading refers to multiple factors or signals aligning to indicate a strong trade setup. Relying on confluence increases the probability of a trade working in your favor.
▪️Technical Confluence: This might include a combination of support/resistance levels, Fibonacci retracement levels, moving averages, or chart patterns lining up to give you a higher confidence trade.
▪️Fundamental and Technical Confluence: Sometimes, combining technical analysis with fundamental data can strengthen your trade setup. For instance, a bullish technical setup supported by positive economic news.
▪️Multiple Time Frame Analysis: Check if your trade setup looks strong on multiple time frames. For example, a bullish signal on a daily chart confirmed by a shorter time frame like 4-hour or 1-hour charts.
▪️Example: Imagine you see a bullish reversal candlestick pattern at a major support level, and your moving average indicates an upward trend. This confluence of signals might give you more confidence to enter a long position.
🔸Putting It All Together
A successful trading plan ties these elements together to give you a clear roadmap. Here’s a simplified example of a trading plan:
🔸Goal: Achieve 5% account growth per month.
Market: Trade major forex pairs (e.g., EUR/USD, GBP/USD) during the London and New York sessions.
🔸Strategy: Use a breakout strategy confirmed by volume and momentum indicators. Enter trades when a breakout occurs from a key support/resistance level.
🔸Risk Management: Risk 1.5% of the account balance per trade. Use a 1:2 risk/reward ratio.
🔸Psychology: Practice emotional discipline. Use a trading journal to record trades and emotions.
🔸Confluence: Only take trades when at least three confluence factors align (e.g., breakout, volume increase, trend confirmation).
🔸By crafting and following a trading plan that incorporates strategy, risk management, psychology, and confluence, you increase your chances of trading success while minimizing potential losses.

Smart Money Trading concepts 101🔸The Smart Money Trading concept, often used in Forex and stock trading, revolves around the idea of tracking the moves made by major institutional players (like banks, hedge funds, and large financial institutions) rather than retail investors. Smart money strategies aim to identify and follow the price action patterns that large investors create, as these institutions often have access to more market-moving information and capital than individual traders.
🔸A critical part of this approach is understanding market structure, which includes concepts like Higher Highs (HH) and Lower Lows (LL). These patterns help traders determine the current trend direction and potential reversals, which can inform trading decisions.
Here's how these concepts fit into the Smart Money Trading framework:
1. Higher Highs (HH) and Higher Lows (HL) in an Uptrend
▪️When the market is in an uptrend, it typically forms a series of Higher Highs and Higher Lows:
Higher High (HH): Each new peak in the price is higher than the previous peak.
Higher Low (HL): Each new low is also higher than the previous low.
▪️This pattern signifies strong buying interest, indicating that smart money may be accumulating positions in anticipation of further price increases.
▪️Traders look for breakouts beyond previous highs, as it often signifies a continuation of the uptrend.
▪️If the price breaks a recent Higher Low, it may indicate potential weakness and a possible trend reversal.
2. Lower Lows (LL) and Lower Highs (LH) in a Downtrend
▪️In a downtrend, the market structure often forms Lower Lows and Lower Highs:
Lower Low (LL): Each new low is lower than the previous low.
Lower High (LH): Each high in the price action is also lower than the previous high.
▪️This pattern signals that selling pressure is dominant, suggesting that institutional investors might be offloading positions.
▪️Traders watch for prices to break the most recent Lower High for potential continuation signals in the downtrend.
▪️If the price breaks above the most recent Lower High, it can indicate that the trend may be weakening, signaling a potential reversal or entry opportunity.
3. Using HH and LL to Spot Trend Reversals
▪️Trend Reversal: When a series of HH and HL in an uptrend shifts to LH and LL (or vice versa), it often signals that a reversal is underway.
▪️Smart Money traders use these shifts to spot market traps where retail traders might be misled, allowing them to capitalize on new trend directions as they unfold.
4. Smart Money Concepts in Action: Liquidity and Price Action
▪️Large players need liquidity to execute significant trades without causing excessive slippage (or price movement). This liquidity often exists near recent highs and lows.
▪️By analyzing HH, HL, LH, and LL patterns, smart money traders can identify areas of liquidity where institutions might step in.
▪️For example, a series of HHs might attract retail buyers, providing liquidity for smart money to enter or exit positions.
5. Application in Trading
▪️By following HH and LL patterns, traders can align their positions with smart money rather than getting caught in fakeouts or market traps.
▪️Traders often combine these patterns with other indicators (like volume, order blocks, or support and resistance) to confirm the presence of institutional involvement.
🔸The Smart Money approach relies heavily on understanding and interpreting these HH and LL structures to trade in sync with the institutions, avoiding common pitfalls that trap many retail traders.

Understanding Bitcoin ETFs: What They Are and Why They Matter?1. What is a Bitcoin ETF?
A Bitcoin Exchange-Traded Fund (ETF) is a financial instrument that tracks the value of Bitcoin and allows investors to gain exposure to the cryptocurrency without directly owning it. Bitcoin ETFs operate similarly to traditional ETFs, which track the value of assets like stocks, commodities, or indices. Managed by financial institutions, Bitcoin ETFs are available on traditional stock exchanges, making it easier for investors to participate in Bitcoin’s price movements through regular brokerage accounts.
There are two main types of Bitcoin ETFs:
Spot Bitcoin ETFs: Track the current market price of Bitcoin, directly reflecting its value.
Futures-based Bitcoin ETFs: Track the value of Bitcoin futures contracts, which are agreements to buy or sell Bitcoin at a predetermined price at a specified time in the future.
In the U.S., Bitcoin futures ETFs have been approved and launched on major exchanges like the New York Stock Exchange (NYSE), while spot Bitcoin ETFs are still under regulatory review by the Securities and Exchange Commission (SEC).
2. How Does a Bitcoin ETF Differ from Buying Bitcoin Directly?
While both Bitcoin ETFs and direct Bitcoin purchases provide exposure to Bitcoin’s value, they differ in several key ways:
Ownership and Custody
Bitcoin ETFs: Investors own shares in the ETF, but not the actual Bitcoin itself. The ETF provider holds the underlying Bitcoin or Bitcoin futures contracts, taking on the responsibility of secure custody.
Direct Bitcoin Purchase: Investors who buy Bitcoin directly through cryptocurrency exchanges or wallets own the Bitcoin and have full control over it, including the responsibility for secure storage.
Access and Regulatory Oversight
Bitcoin ETFs: Are traded on traditional stock exchanges and are regulated by financial authorities. This oversight ensures investor protections that are not typically present in cryptocurrency markets.
Direct Bitcoin Purchase: Involves buying from cryptocurrency exchanges, many of which are less regulated and may lack certain protections offered by traditional financial products.
Trading Hours
Bitcoin ETFs: Trade during standard market hours, typically from 9:30 AM to 4:00 PM EST. Investors can buy or sell shares only within these hours.
Direct Bitcoin Purchase: Bitcoin can be traded 24/7, giving investors the flexibility to enter or exit positions at any time.
Taxation and Fees
Bitcoin ETFs: Investors are subject to capital gains taxes and may also incur management fees for ETF administration.
Direct Bitcoin Purchase: Direct Bitcoin investors are also subject to capital gains taxes. However, they may face lower or no management fees, depending on how they store their Bitcoin.
Use of Leverage and Derivatives
Bitcoin Futures ETFs: These funds allow investors to speculate on Bitcoin’s future price movements without holding actual Bitcoin. However, futures-based ETFs can be more complex, as they rely on futures contracts rather than spot prices, which can introduce tracking errors.
Direct Bitcoin Purchase: Investors buy Bitcoin directly, holding actual units of the asset without derivatives or leverage, providing a more straightforward exposure to its current market price.
3. Why is a Bitcoin ETF Important for the Cryptocurrency Market?
The approval of a Bitcoin ETF is a significant milestone for the cryptocurrency market for several reasons:
1. Broader Accessibility
Traditional Investors: A Bitcoin ETF opens the door to traditional investors, especially those who may not be comfortable using cryptocurrency exchanges. Investors can access Bitcoin exposure through familiar brokerage accounts without needing to learn about wallets or private keys.
Institutional Interest: A Bitcoin ETF creates an easier path for institutional investors to participate in the Bitcoin market, bringing in large amounts of capital. As institutions enter the market, Bitcoin's market liquidity and price stability may improve.
2. Increased Legitimacy
The introduction of a Bitcoin ETF legitimizes Bitcoin as an asset class in the eyes of regulators, investors, and financial institutions. It signals recognition from regulatory bodies and increases trust in Bitcoin among mainstream investors.
3. Boost to Market Liquidity
Bitcoin ETFs can increase liquidity in the market, as they provide a regulated and accessible means for both retail and institutional investors to gain Bitcoin exposure. Greater liquidity can reduce volatility, making the market more stable over time.
4. Potential for Price Appreciation
With increased demand and accessibility, a Bitcoin ETF could lead to upward price pressure on Bitcoin. This is especially relevant for spot ETFs, which would require the fund to hold actual Bitcoin, thus increasing demand for the underlying asset.
5. Step Toward Broader Cryptocurrency ETF Adoption
Approval of a Bitcoin ETF could pave the way for ETFs focused on other cryptocurrencies like Ethereum or Solana, expanding the options for crypto exposure within traditional markets. This could accelerate the overall growth of the cryptocurrency sector.
4. Pros and Cons of Bitcoin ETFs
While Bitcoin ETFs offer numerous benefits, they also come with certain drawbacks.
Advantages of Bitcoin ETFs
Ease of Access: ETFs are easily accessible through traditional brokerage accounts, removing the need for new accounts on cryptocurrency exchanges.
Regulatory Protections: ETFs are regulated by financial authorities, providing investors with protections that may be absent on cryptocurrency exchanges.
Enhanced Liquidity: Increased market liquidity through ETF participation can reduce volatility and provide a more stable trading environment for Bitcoin.
Professional Custody: ETF providers manage Bitcoin custody and security, making it easier for investors who do not want to worry about wallet security or private key management.
Diversification Opportunities: Bitcoin ETFs can be included in retirement accounts or blended into traditional investment portfolios, broadening their appeal as a tool for diversification.
Disadvantages of Bitcoin ETFs
Limited Trading Hours: ETFs can only be traded during standard market hours, unlike Bitcoin, which is available 24/7 on cryptocurrency exchanges.
Management Fees: Most Bitcoin ETFs come with annual management fees, which can reduce overall returns for investors.
Potential for Tracking Errors: In futures-based ETFs, tracking errors may occur, meaning the ETF's performance may not accurately match Bitcoin’s actual price movements.
No Direct Ownership of Bitcoin: ETF investors do not own Bitcoin itself, which means they miss out on the ability to use or transfer the asset directly.
Market Dependency on Regulators: The introduction and ongoing success of Bitcoin ETFs depend on regulators’ willingness to approve and support crypto-based financial products, which may limit the ETF market’s expansion.
5. Outlook and Future of Bitcoin ETFs
The potential approval of a spot Bitcoin ETF in the U.S. could be a game-changer. With increased institutional and retail access, the Bitcoin ETF market could drive greater adoption and legitimacy for cryptocurrencies overall. However, regulatory challenges remain, as the SEC has thus far resisted approving spot Bitcoin ETFs due to concerns about market manipulation and lack of robust investor protections.
As regulatory clarity improves, we may see a broader array of crypto-based ETFs emerge, possibly including multi-asset ETFs that combine Bitcoin with other cryptocurrencies or assets, such as stocks or commodities. Furthermore, as institutional adoption grows, the role of ETFs in the financial ecosystem could increase, potentially influencing Bitcoin’s price dynamics and volatility as well.
Conclusion
Bitcoin ETFs represent a bridge between the traditional financial world and the emerging cryptocurrency market. While they offer unique advantages, such as regulatory protections and ease of access, they also come with limitations like management fees, limited trading hours, and the lack of direct ownership. For those who want exposure to Bitcoin within the security of a regulated investment product, Bitcoin ETFs provide a promising option.
The success and potential of Bitcoin ETFs lie in their ability to draw both individual and institutional investors into the cryptocurrency market, making it a potentially transformative development for the financial world. As more countries consider ETF approval, and as the cryptocurrency industry matures, Bitcoin ETFs could play a pivotal role in the mainstream adoption and integration of digital assets.
Hope you enjoyed the content I created, You can support with your likes and comments this idea so more people can watch!
✅Disclaimer: Please be aware of the risks involved in trading. This idea was made for educational purposes only not for financial Investment Purposes.
---
• Look at my ideas about interesting altcoins in the related section down below ↓
• For more ideas please hit "Like" and "Follow"!

Halloween Horror: Avoiding Common Trading MistakesAs Halloween approaches, it’s the perfect time to reflect on the common “frights” that can scare traders away from success. Just like ghosts and ghouls lurking in the shadows, trading mistakes can be sneaky and unexpected. This post will highlight some of the most common trading mistakes, drawing parallels with Halloween themes, and provide strategies for avoiding these pitfalls.
🎃Fear of Missing Out (FOMO)
Many traders experience FOMO, which can lead to impulsive decisions, such as chasing after rapidly rising stocks or jumping into trades without proper analysis. This behavior often results in buying at peak prices and facing losses when the stock inevitably corrects.
Set Clear Entry and Exit Points: Establish specific criteria for entering and exiting trades to avoid emotional decisions.
Stick to Your Plan: Have a trading plan that includes risk management strategies. Review your plan regularly, especially in volatile market conditions.
👻 Overtrading
In an attempt to capitalize on every opportunity, some traders overtrade, leading to excessive fees, emotional fatigue, and ultimately poorer performance. Overtrading can resemble a Halloween party gone wild, with too many participants causing chaos.
Limit Your Trades: Set a maximum number of trades per week or month. Focus on quality over quantity.
Take Breaks: Allow yourself time away from the screen to recharge and refocus. This helps in making more rational decisions.
🕷️Ignoring Risk Management
Trading without proper risk management is akin to wandering through a haunted house without a flashlight. You’re likely to encounter unexpected dangers. Failing to set stop-loss orders or to size positions appropriately can lead to catastrophic losses.
Implement Stop-Loss Orders: Set stop-loss orders at a predetermined level to limit potential losses.
Diversify Your Portfolio: Spread your investments across different asset classes and sectors to mitigate risk.
👺 Emotional Trading
Trading decisions driven by emotions such as fear, greed, or panic can lead to disastrous results. Emotional trading is like letting a ghost dictate your path through a dark forest—it's unpredictable and often leads to mistakes.
Keep a Trading Journal: Document your trades, including the reasoning behind them and your emotional state at the time. This will help you identify patterns and triggers in your decision-making process.
Practice Mindfulness: Incorporate techniques like meditation or deep breathing to remain calm and focused during trading hours.
🦇Neglecting Research and Analysis
Many traders skip the crucial step of research and analysis, relying instead on tips or rumors—much like believing in urban legends without questioning their validity. This can lead to uninformed trades and unexpected losses.
Conduct Thorough Analysis: Use both technical and fundamental analysis to make informed trading decisions. Stay updated on market news and trends.
Leverage Trading Tools: Utilize platforms like TradingView to access charts, indicators, and community insights.
[b 🕸️Chasing Losses
After experiencing losses, some traders attempt to "revenge trade," trying to quickly recover their losses by taking high-risk trades. This often results in deeper losses and a vicious cycle of frustration.
Accept Losses as Part of Trading: Understand that losses are inevitable. Learn from them rather than trying to immediately recover.
Take a Step Back: If you find yourself in a negative trading streak, consider taking a break to reassess your strategies and mental state.
👽 Not Adapting to Market Conditions
The market is constantly changing, and clinging to outdated strategies can be dangerous. This is similar to wearing the same costume year after year—eventually, it becomes stale and ineffective.
Stay Flexible: Be willing to adapt your trading strategies based on current market conditions. Regularly review and refine your approach.
Educate Yourself: Continuously seek knowledge through courses, webinars, and market analysis to stay informed about new trends and strategies.
As the Halloween season creeps in, it’s time to face the spooky realities of trading! By identifying and confronting common trading frights, you can transform potential pitfalls into stepping stones for success. Remember, every trader encounters challenges, but preparation, discipline, and continuous learning are your best defenses against the ghouls of the market.
So, this Halloween, don’t let fear haunt your trading journey. Embrace the tricks of the trade, sharpen your skills, and turn those frights into fruitful opportunities! Here’s to a successful and spooktacular trading experience!🎃👻🕸️

The Symmetrical Triangle: Real Success Rates + Breakout.The Symmetrical Triangle: Real Success Rates + Breakout.
The symmetrical triangle is an important chart pattern in technical analysis, deserving special attention from professional traders.
This formation is characterized by a convergence of prices between two trendlines, one descending and the other ascending, creating a consolidation zone where indecision between buyers and sellers is palpable.
Statistical Analysis
Empirical data reveals that the success rate of the symmetrical triangle for a trend continuation is approximately 54%. This percentage, although higher than 50%, underlines the importance of a cautious approach and rigorous risk management in using this pattern.
Breakout Point
The breakout of the symmetrical triangle usually occurs when the price has traveled approximately 75% of the distance to the apex. This point is crucial for traders, as it often represents the moment when volatility increases and a new trend can be established.
Risks and False Exits
It is essential to note that the symmetrical triangle has a relatively high rate of false exits. Statistics indicate that approximately 13% of cases in a bear market can result in a false exit to the bottom. This phenomenon underlines the need for additional confirmation before entering a position.
Strategy of use
To effectively exploit the symmetrical triangle, professional traders must:
-Identify the formation accurately.
-Wait for the breakout near the point of convergence of the trendlines.
-Confirm the breakout with other technical indicators or an increase in volume.
-Put in place strict risk management to protect against false exits.
In conclusion, the symmetrical triangle, although being a valuable tool in the trader's arsenal, requires a methodical approach and a thorough understanding of its characteristics to be used effectively in a trading strategy.

How to avoid being emotional in trading?Avoiding emotional trading is a key skill in successful investing and trading, as it helps minimize impulsive decisions that can lead to losses. Here are some strategies and insights to help maintain a disciplined approach to trading and avoid being swayed by emotions like fear, greed, or overconfidence:
🔸 Create and Stick to a Trading Plan
▪️Set Clear Goals: Define your profit goals, risk tolerance, and entry/exit points in advance.
▪️Follow Predefined Rules: A trading plan provides structure, guiding you to make logical decisions rather than impulsive ones.
▪️Limit Exposure: Decide on position sizes beforehand to avoid overcommitting and feeling compelled to make irrational moves if markets turn volatile.
🔸 Use Stop-Loss and Take-Profit Orders
▪️Automate Exit Points: Setting up stop-loss and take-profit orders allows you to exit trades at predefined points, limiting the need to make quick, emotion-driven decisions during market fluctuations.
▪️Reduce Monitoring: Knowing your trades will automatically exit at specific points reduces the need for constant checking, which can often lead to stress and emotional reactivity.
🔸 Practice Patience and Avoid Overtrading
▪️Avoid Excessive Monitoring: Watching the market closely can lead to impulsive reactions to small fluctuations. Stick to reviewing your trades periodically rather than minute-by-minute.
▪️Limit Trade Frequency: Overtrading, driven by the need to “make back” losses or maximize gains, often leads to poorly thought-out decisions. Trade only when your trading plan calls for it.
🔸 Develop a Balanced Mindset
▪️Stay Neutral to Wins and Losses: Emotional attachment to individual trades can make it harder to accept losses and lead to revenge trading, where you try to make up losses through risky moves.
▪️Accept Losses as Part of the Process: Even the best traders face losses. Accepting this and moving on helps maintain perspective and discipline, which are essential for long-term success.
🔸 Utilize Data and Analysis Over Intuition
▪️Focus on Objective Indicators: Base decisions on data, such as price charts, moving averages, and technical indicators, rather than “gut feelings.”
▪️Avoid Confirmation Bias: Seeking only information that supports your existing beliefs can lead to one-sided and often poor decisions. Stay open to all relevant information.
🔸 Take Breaks and Manage Stress
▪️Step Away After a Major Loss or Win: Strong emotional responses often follow big losses or gains. Taking a break gives you time to reset your mindset before your next trade.
▪️Practice Relaxation Techniques: Techniques like deep breathing, meditation, or even short exercises can reduce stress and improve focus, reducing emotional reactions.
🔸 Build Self-Awareness
▪️Reflect on Your Emotions: Keeping a trading journal can help you understand emotional triggers and patterns in your decision-making.
▪️Work with a Trading Coach or Join a Community: Having accountability, whether through a mentor or a trading group, can help you stay grounded and receive objective feedback on your trading behavior.
🔸 Set Realistic Expectations
▪️Don’t Chase Unrealistic Returns: Expecting massive returns can lead to risky, emotion-fueled decisions. Focus on sustainable, gradual growth.
▪️Acknowledge Market Unpredictability: Markets are often unpredictable, and not every trade will go as planned. Accepting this helps lower emotional stakes with each trade.
🔸 Consider Using Algorithmic or Automated Trading
▪️Remove Emotion from Execution: Algorithmic trading allows traders to set parameters and let algorithms execute trades, effectively reducing emotional interference.
▪️Define Rules for Entry and Exit: Predefined rules, when followed strictly by algorithms, allow for a structured and emotion-free approach to trading.
Adopting these practices helps build discipline, patience, and resilience, which are essential for minimizing the negative impact of emotional trading on your overall financial success.

Getting Started with Forex Prop Trading: Intro Guide🔸Forex prop trading (short for foreign exchange proprietary trading) refers to a trading model where traders use capital provided by a proprietary trading firm to trade in the Forex (foreign exchange) market. Unlike traditional retail trading, where traders use their own funds, prop traders operate with the firm's capital, typically after passing a series of evaluations to prove their trading skills and risk management abilities. In return, the firm takes a percentage of the profits generated by the trader.
🆕 Here’s a more detailed look at how forex prop trading works and why it's appealing:
🔸 Access to Capital
Prop firms offer substantial capital to skilled traders, allowing them to trade with much larger account sizes than they might be able to on their own. For example, a trader might be funded with anywhere from $10,000 to $1,000,000 or more, depending on their experience and the firm's offerings.
🔸 Evaluation Process
Most prop firms require traders to pass an evaluation or assessment phase before providing access to live capital. This involves trading on a demo account and meeting specific performance metrics like profit targets, drawdown limits, and risk management rules. If the trader successfully passes this phase, they are then given access to a live account with the firm's capital.
🔸 Profit Sharing
Once a trader is funded, they enter into a profit-sharing agreement with the firm. Typically, the trader receives a percentage of the profits, often around 70-90%, while the firm keeps the rest as compensation for providing the capital and infrastructure. For example, if a trader makes $10,000 in profits and their profit split is 80/20, they would keep $8,000 while the firm takes $2,000.
🔸 Risk Management
Prop firms are very strict about risk management because they are providing their own capital. They impose limits on the maximum drawdown (the amount a trader can lose), daily loss limits, and leverage. If these rules are violated, traders risk losing their funded status.
🔸 Advantages for Traders
Low Financial Risk: Traders do not need to risk their own capital, reducing personal financial exposure.
No Pressure to Invest Large Sums: With access to firm capital, traders don’t need to save up large amounts to trade at higher levels.
Support and Resources: Many prop firms provide educational resources, trading platforms, and tools to help their traders succeed.
🔸Types of Prop Firms
Prop firms can generally be categorized into two types:
🔸Traditional Prop Firms: These firms often require traders to work in-office and provide access to a wide range of markets beyond Forex, including stocks, commodities, and derivatives. Online Prop Firms: The more popular model today, these firms operate remotely, allowing traders from around the world to participate.
🔸 Fees
Most prop firms charge traders an initial fee to cover the evaluation process. This fee can range from a few hundred to a couple of thousand dollars, depending on the account size. In many cases, this fee is refundable if the trader successfully completes the evaluation.
🔸 Challenges
Strict Rules: If traders fail to adhere to the firm's rules (such as daily loss limits or maximum drawdown), they can lose their funded account.
Pressure to Perform: Trading with someone else’s capital can create pressure, which can affect trading decisions and lead to mistakes if not handled well.
🔸Bot Algo Trading in Forex
Algorithmic trading (algo trading) involves using pre-programmed instructions (algorithms) that can automatically execute trades in the Forex market based on specific conditions. These conditions can be price, volume, time, or other market indicators. Algo trading has become increasingly popular in the Forex market due to its ability to:
▪️Execute trades at high speed without the need for human intervention.
▪️Remove emotional biases, which can often lead to poor decision-making in trading.
▪️Test and optimize strategies through backtesting on historical data to ensure effectiveness.
▪️Implement complex strategies that would be difficult for a human to execute manually.
🔸what is a Bot Algo Expert?
A bot algo expert is typically a professional who specializes in developing and optimizing trading algorithms (bots) for Forex markets. They possess skills in coding, often using languages like Python, MQL4/5 (MetaQuotes Language), and other programming languages tailored to financial markets.
🔸The expert focuses on building bots that can:
▪️Identify trading signals based on technical indicators (like moving averages, RSI, Bollinger Bands).
▪️Automatically execute trades when certain criteria are met (such as entering or exiting positions).
▪️Manage risk by setting stop-loss and take-profit orders to minimize potential losses.
▪️Optimize performance by regularly updating the algorithm based on market conditions.
🎁Please hit the like button and
🎁Leave a comment to support our team!

The Coin Market is Different from the Stock Market
Hello, traders.
If you "Follow", you can always get new information quickly.
Please also click "Boost".
Have a nice day today.
-------------------------------------
The coin market discloses a lot of information compared to the stock market.
Among them, it discloses the flow of funds.
Most of the funds in the coin market are flowing in through USDT, and it can be said that it currently manages the largest amount of funds.
Therefore, unlike the stock market, individual investors can also roughly know the flow of funds.
Therefore, you can see that it is more transparent than other investment markets.
-
USDT continues to update its ATH.
You can see that funds are continuously flowing into the coin market through USDT.
USDC has been falling since July 22 and has not yet recovered.
The important support and resistance level of USDC is 26.525B.
Therefore, if it is maintained above 26.525B, I think there is a high possibility that funds will flow in.
If you look at the fund size of USDT and USDC, you can see that USDT is more than twice as high.
Therefore, it can be said that USDT is the fund that has a big influence on the coin market.
USDC is likely to be composed of US funds.
Therefore, if more funds flow in through USDC, I think the coin market is likely to develop into a clearer investment market.
But it is not all good.
This is because the more the coin market develops into a clearer investment market, the more likely it is to be affected by the existing investment market, that is, the watch market.
This is because large investment companies are working to link the coin market with the coin market in order to make the coin market an investment product that they can operate.
In order for the coin market to be swayed by the coin-related investment product launched in the stock market, more funds must flow into the coin market through USDC.
Otherwise, it is highly likely that it will eventually be swayed by the flow of USDT funds.
Therefore, USDC is likely to have a short-term influence on the coin market at present.
-
As mentioned above, the most important thing in the investment market is the flow of funds.
The flow of funds in the coin market can be seen as maintaining an upward trend.
Therefore, there are more and more people who say that there are signs of a major bear market these days, but their position seems to be judging the situation from a global perspective and political perspective.
As mentioned above, the funds that still dominate the coin market are USDT funds, which are an unspecified number of funds.
Therefore, I think that the coin market should not be predicted based on global perspectives and political situations.
The start of the major bear market in the coin market is when USDT starts to show a gap downtrend.
Until then, I dare say that the coin market is likely to maintain its current uptrend.
------------------------------------
(BTCUSDT 1D chart)
The StochRSI indicator is approaching its highest point (100), and the uptrend is reaching its peak.
Accordingly, the pressure to decline will increase over time.
-
(1W chart)
The StochRSI indicator is also in the overbought zone on the 1W chart.
-
(1M chart)
On the 1M chart, the StochRSI indicator is showing signs of entering the overbought zone, but it is not expected to enter the oversold zone due to the current rise.
The movement of the 1M chart should be checked again when a new candle is created.
-
You can see that the StochRSI indicator on the 1M chart is the most unusual among the three charts above.
In the finger area on the 1M chart, the StochRSI indicator was in the overbought zone, but it is currently showing signs of entering the oversold zone.
Therefore, you can see that the current movement is different from the past movement.
Therefore, I think it is not right to predict the current flow by substituting past dates.
------------------------------------------
I wrote down my thoughts on the recent comments from famous people who say that the coin market will enter a major bear market along with the stock market.
-
Have a good time. Thank you.
--------------------------------------------------
- Big picture
It is expected that the real uptrend will start after rising above 29K.
The section expected to be touched in the next bull market is 81K-95K.
#BTCUSD 12M
1st: 44234.54
2nd: 61383.23
3rd: 89126.41
101875.70-106275.10 (overshooting)
4th: 134018.28
151166.97-157451.83 (overshooting)
5th: 178910.15
These are points where resistance is likely to be encountered in the future. We need to see if we can break through these points.
We need to see the movement when we touch this section because I think we can create a new trend in the overshooting section.
#BTCUSD 1M
If the major uptrend continues until 2025, it is expected to start by creating a pull back pattern after rising to around 57014.33.
1st: 43833.05
2nd: 32992.55
-----------------

Nailing Crypto Risk Management: 7 Ways to Protect Your PortfolioYou’re leveraged to the hilt and riding the crypto wave—eyeing those sweet gains, living for the adrenaline rush and peeking at your vision board where you’ve got the lambo cutout for inspo.
But here’s the harsh truth: for every moonshot, there’s a black hole ready to reel in your portfolio. Welcome to the not-so-glamorous side of crypto: risk management. If you don’t have this locked down, you might as well be throwing darts in the dark.
So, how do you stack the odds in your favor and avoid getting rekt ? Let’s break down 🤸♂️ the essentials of managing risk in the vast world of crypto like a pro. Grab your notepad, take one more look at the lambo and let’s roll.
1. Position Sizing: Don’t Go All In, Even If You Want To
We get it—Bitcoin’s pumping, and FOMO is real. But listen: putting your entire stack on one trade is quite often a path to whipping up a not-so-great track record. Pro traders? They never bet the farm. They calculate position sizes based on the risk they’re willing to take—the golden rule is to bet no more than 1-3% of your capital per trade.
🔑 Pro tip : Use a risk calculator to figure out exactly how much of your portfolio should go into each trade. It’s the difference between surviving a bad move or calling it quits.
2. Stop-Losses: The Safety Net You Probably Ignore (but Shouldn’t)
Here’s the thing: everyone will get it wrong every now and then. No matter how many YouTube gurus tell you otherwise or how some trading signals group churns out 100% success rate, every trader gets slapped by the market. That’s where the stop-loss comes in—a non-emotional tool that automatically closes your position before your losses become catastrophic. Set it, forget it, and avoid waking up to a disaster.
🔑 Pro tip : Don’t just dump your stop-loss under the last support level. Base it on your risk tolerance. If you’re losing sleep over your trade, you’ve placed it too far away.
3. Diversification: Don't Put All Your Eggs in One Crypto Basket
Bitcoin BTC/USD is the OG token and dominates the crypto board —no question about it. This is why Bitcoin is the preferred crypto for institutional investors and why billions of dollars get sloshed around in spot Bitcoin exchange-traded funds (ETFs).
Bitcoin, as odd as it may sound, is likely the crypto with the least amount of risk, given its size and investor base. So why not look elsewhere for tenbaggers? Small caps definitely look attractive with their relatively low valuations, compared with Bitcoin’s $1.3 trillion weight.
In this light, try to make sure you’re not going to end up rug pulled. Spread out the risk. Diversify across different coins, sectors and use cases. The goal is to reduce your exposure to any one asset's mood swings.
🔑 Pro tip : Don’t over-diversify either. Owning 20 low-cap coins won’t save you if the whole market crashes.
4. Avoid Leverage Unless You Really, Really Know What You’re Doing
Leverage is that spicy little tool that lets you borrow money to boost your gains—or sometimes, your losses. The more you leverage, the quicker you can get washed out if the market moves against you.
🔑 Pro tip : If you must use leverage, keep it low.
5. Have an Exit Strategy: Don’t Get Greedy
Crypto loves to pump, and we all love to see it. But when it does, don’t just sit there watching your profits grow—have a plan to take them. Greed kills portfolios faster than bad trades. Know when to get out before the inevitable pullback has a chance to take a shot at your gains.
🔑 Pro tip : Set clear targets for both taking profits and cutting losers. Lock in some profits on the way up and have no shame in bailing when things head south.
6. Keep Your Emotions in Check: Your Worst Enemy Is… You
Let’s face it, we all get caught up in the hype. Whether it’s panic selling at the bottom or FOMO buying at the top, emotions are portfolio killers. Detach yourself from the swings and trade based on your strategy, not your emotions.
🔑 Pro tip : If a trade has you looking at your portfolio while under the shower, it’s time to re-evaluate. Chill, stick to the plan, and let the market do its thing.
7. The Golden Rule: Only Invest What You Can Afford to Lose
This should be obvious, but it’s worth repeating. If losing your investment would make you sell your car or move back with your parents, you’re overexposed. Crypto is volatile, and while the upside is exciting, the downside is real. Play it smart, and don’t gamble with money you can’t afford to lose.
Wrapping Up: Trade Smart, Stay Sharp
Risk management is what separates the survivors from the rest of the pack in crypto. Anyone can ride a bull market but only the disciplined make it through the bruising pullbacks without getting squashed. Stick to your trading plan and never assume you’re invincible just because the charts are green today.
Oh, and if you’ve got your own tips for managing risk like a crypto boss, drop them in the comments. We’re all here for the gains—but surviving the swings? That’s what separates the real traders from the noobs.

Chart with trend(MACD), momentum(DMI), and market strength(OBV)
Hello, traders.
If you "Follow", you can always get new information quickly.
Please click "Boost" as well.
Have a nice day today.
-------------------------------------
BW+ indicator is an indicator that comprehensively evaluates MACD, DMI, and OBV indicators.
Therefore, knowledge of MACD, DMI, and OBV indicators is required.
I added the existing HA-Low and HA-High indicators to express the section to start trading more clearly.
-
The indicators have changed and been supplemented a lot over the past 6 years of using TradingView.
It was not easy to express my trading method as an indicator.
Because of this, I think there are people who unintentionally interpret my writing differently from what I think.
So, to narrow this gap, I am explaining the indicators used in my article.
Since these indicators are automatically generated by a formula, no one can change them.
Therefore, I think anyone can look at the chart and interpret it from the same perspective.
However, there may be differences in interpretation depending on one's investment style or average purchase price.
However, since everyone talks about the same point, there will be no confusion.
-
When talking to each other in the community, if you talk with the chart tool you drew, you may talk differently and there may be room for misunderstanding.
So, I think the conversation often goes in a strange direction because the conversation ends up talking about whether it is LONG or SHORT right now.
I think that charts drawn with chart tools are not very meaningful because they only show a part of the person's thoughts through chart analysis.
This is because they do not tell you the selection point using the chart tool, so interpretation or understanding is lacking.
Therefore, you cannot apply such content to your own chart.
So, since it can't be used as a trading strategy, I can't help but just say, "Oh, that could be possible."
However, if there is a chart that everyone can see and no one can change, I think it would be easier to talk and reflect each other's thoughts on my trading strategy.
I think that because of that, I can find out what I lacked and supplement it.
Not everyone sees the same thing and thinks the same, but if the basic point of the thought is the same, I think it can help me make other people's thoughts my own.
-
Anyway, I hope that this chart change will help you create a clearer analysis or trading strategy.
-
The MACD indicator added to the chart is an indicator with a modified formula from the existing MACD indicator, but the interpretation method is the same.
That is,
- If MACD > Signal, it is interpreted as an upward trend,
- If MACD < Signal, it is interpreted as a downward trend.
-
The DMI indicator added to the chart simplifies the interpretation of the existing D+, D- indicators by expressing them as lines on the ADX line.
That is,
- The section expressed in Aqua color means a downward section,
- The section expressed in Orange means an upward section.
- When ADX is above 25, it means that the strength of the upward or downward movement is strong,
- When it is below 25, it means that there is a high possibility of forming a box section or sideways section.
-
The OBV indicator added to the chart means an upward trend when each line is broken upward, and a downward trend when it is broken downward.
-
The indicator that expresses the contents explained above is the BW v1.0 indicator.
In order to see this more intuitively, the BW (100), BW (0), and Mid (50) indicators were added so that they can be expressed in the price candle section.
In addition, there are also High (80 Down), Low (20 Up) indicators.
-
It is never easy to interpret each indicator and evaluate it comprehensively.
It is especially difficult when trading in real time.
-
When interpreting the BW v1.0 indicator, it is basically divided into rising and falling based on the 50 point.
Therefore, passing the 50 point increases the possibility of a significant change in the trend.
Therefore, it seems that trading can be done based on whether there is support near the Mid (50) line generated when the BW indicator passes the 50 point, but this is not the case.
The reason is that volatility is likely to occur when a change in trend occurs.
When volatility occurs, your trading point will go up and down, so psychological pressure will increase and you may proceed with an inappropriate trade.
Therefore, a good point to start trading is the BW (0), BW (100) or HA-Low, HA-High point.
Since these indicators are generated at the boundary of the low or high point range, if you start trading based on whether there is support, you are more likely to get good results.
-
In any case, you should think in line with your average purchase price.
Otherwise, if you trade incorrectly due to psychological pressure when you get close to the average purchase price, you may end up with little profit or even a loss.
This means that when you start a new trade, it is better to start near the BW (0), BW (100), HA-Low, and HA-High indicators as mentioned above.
-
Have a good time.
Thank you.
--------------------------------------------------

Actual Success Rates of Ascending and Descending TrianglesActual Success Rates of Ascending and Descending Triangles
Here is an analysis of the actual success rates of ascending and descending triangles in trading, based on the information provided:
Success Rates
Ascending and descending triangles generally have fairly high success rates as continuation patterns:
-The ascending triangle has a success rate of approximately 72.77%.
-The descending triangle has a slightly higher success rate of 72.93%.
These numbers come from a study that tested over 200,000 price patterns over a 10-year period.
Factors Influencing Success
Several factors can influence the success rate of these patterns:
-The trader's ability to execute the strategy correctly
-Market conditions at the time the triangle formed
-Market liquidity
-Overall market sentiment
Important Points to Consider
-Triangles are considered reliable continuation patterns, especially in trending markets.
-The ascending triangle in an uptrend is statistically more reliable than the descending triangle.
-To validate the pattern, the price must touch at least twice each of the upper and lower lines.
-An increase in volume during the breakout is an important confirmation sign.
Strategies to improve the chances of success
-Wait for the triangle to fully form before entering a position1.
-Confirm the breakout with a close above/below the resistance/support level.
-Use additional technical indicators to confirm the signal.
-Pay attention to the volume, which should increase during the breakout.
Conclusion
Although ascending and descending triangles have relatively high success rates, it is important to use them in conjunction with other technical analysis tools and to take into account the overall market context to maximize the chances of success.

Misconceptions and Truths about Paper Trading
Hello, traders.
If you "Follow", you can always get new information quickly.
Please click "Boost".
Have a nice day today.
-------------------------------------
TradingView also supports Paper Trading.
For more information, please click the link below. www.tradingview.com
More flexibility: change your Paper Trading account currency :
www.tradingview.com
Even more seamless order design — directly on chart :
www.tradingview.com
---------------------------------------
Paper Trading is thought to support trading practice for beginners.
However, this is a wrong idea.
If you lack prior knowledge about trading or have no concept of trading strategy, you should not do paper trading.
The reason is that the psychological burden is different.
The success or failure of a trade is thought to be the result of trading strategy or response ability, but in reality, it can be said that it is determined by the battle with oneself and psychological state.
This means that psychological state has a significant impact on trading.
Therefore, paper trading should be considered as a transaction that is conducted to confirm one's trading strategy and response strategy after completing chart analysis.
If you have completed some verification of your trading strategy or response strategy, you should continue to conduct actual trading even if you suffer a loss.
The reason is that you should not forget that you can only gain know-how in trading through actual trading.
Therefore, paper trading should not be used to practice mid- to long-term trading, but should be used to verify trading strategies or response strategies for short-term trading or day trading.
In order to do so, you must close the transaction by selling or cutting your loss.
-------------------------------------------
For more information on trading orders in paper trading, please refer to the explanation through the link above.
-
You can proceed with Paper Trading by clicking the Trading Panel at the bottom menu of the TradingView chart.
If you connect to a Paper Trading account, you can start with an initial fund of 100,000.
If the Buy/Sell button is not activated, activate the chart settings to activate the Buy/Sell button before proceeding with the trade.
Right-click on the space in the price candle area to activate the window, and then hover your mouse over the Trade section to check the trading order or trading settings (when you click the Trading menu in the Chart Settings window).
-
In addition, TradingView is linked to a real exchange and supports real trading.
It supports various exchanges, so I recommend you to check if there is an exchange that you are trading on.
-
Have a good time.
Thank you.
--------------------------------------------------

The 45 Degree Line: A Very Effective Tool in Trading.The 45 Degree Line: A Very Effective Tool in Trading.
When the ppix of an asset explodes and forms a very steep slope, the 45 degree line, also known as the 1x1 Gannangle, is an important and very useful tool in technical analysis, used to identify and predict market corrections.
Meaning of the 45 degree line:
The 45 degree line represents an equilibrium trend in technical analysis. It is considered an average support or resistance line, indicating a balance between time and price. This line is particularly important because it suggests a constant and balanced progression of the market.
Main characteristics
-Angle: The 45 degree line forms an angle of 45° with the horizontal axis of the chart.
-Notation: It is often noted 1x1, which means that it represents a movement of one unit of price for one unit of time.
-Interpretation: A trend following this angle is generally considered strong and likely to continue in the same direction.
Use in Technical Analysis
Traders use the 45-degree line in several ways:
-Identifying trend strength: A trend that follows or exceeds the 45-degree angle is considered strong.
-Support and resistance: The line can act as a dynamic level of support in an uptrend or resistance in a downtrend.
-Forecasting movements: Traders can anticipate trend changes when price deviates significantly from the 45-degree line.
-Multi-timeframe analysis: The line can be applied on different time frames, from short-term to long-term, for a more comprehensive analysis.
Integration with other tools
The 45-degree line is often used in conjunction with other technical analysis tools for a more robust analysis. It can be combined with indicators, chart patterns, or other Gannangles to confirm trading signals and improve forecast accuracy.
In conclusion, the 45-degree line is a powerful but often underestimated tool in technical analysis. Its simplicity and versatility make it a valuable tool for traders looking to identify and follow market trends with precision.

Become a TOP 1% Trader 🔸🔸What it takes to become TOP 1% Trader? Everybody wants
to succeed in the trading game, but what's the actual formula?
🔸🔸What can we learn from the most successful global hedge fund
Renaissance Technologies? How did the Japanese legendary trader
Takashi Kotegawa become a TOP 1% Trader? Rules of life of
undefeated savage Japanese samurai Miyamoto Musashi.
🔸🔸RetTec flaship fund got 40% CAGR over a period of 30+ years, which
is an exceptional trackrecord in the industry. RenTec utilizes HFT trading
and uses multiple quantitative / statistical / data science models to gain
an edge over the market. RenTec is one of the most secretive hedge funds
in the industry, however it's clear that the fund relies on algo trading
to generate it's exceptional returns.
🔸Complex Models: Renaissance's models are built upon intricate mathematical models and statistical analysis that leverage massive datasets.
🔸High-Frequency Trading: The firm executes trades at breathtaking speeds, taking advantage of fleeting market inefficiencies.
Key takeaways from RenTec success
1) Use algo trading / HFT trading to gain an edge over the market
2) Use data science / quant models to identify patterns
3) Use proper risk management for capital protection
4) Do not overleverage / use leverage over x20
🔸🔸Takashi Kotegawa is a legendary Japanese trader who
turned initial investment of 13 000 USD into 150 mln USD trading
Japanese stock market.
🔸🔸Risk Control: His approach to managing risk ensures that trades are executed within safe limits, without jeopardizing overall financial stability.
🔸🔸Seizing Opportunities: Kotegawa's ability to swiftly identify and act on market inefficiencies underscores the importance of vigilance and quick decision-making in trading.
🔸🔸Takashi Kotegawa keeps himself out of the spotlight and gives virtually no interviews. That's one of the reasons why we don't know much about him and there are only a few pictures available on the internet.
Key takeaways from Takashi Kotegawa's success
1) Disciplined approach to trading
2) Enter / exit trades and make fast decisions
3) Grind alone and stay out of spotlight
4) Remain humble do not show off keep low profile
🔸🔸The majority of the Japanese people know Musashi Miyamoto as Japan's most famous and most skilled swordsman. His status among the Japanese has reached mythic proportions in the same measure that Westerners would give to Muhammad Ali or Michael Jordan. The life of Musashi is the gold standard of samurai in Japan.
🔸🔸Musashi's introverted nature, which manifests as a preference for being alone or engaging in solitary activities, allows him to focus on his own thoughts and ideas. He is particularly skilled at problem-solving, often finding unique and unconventional solutions that others may not think of.
🔸🔸Musashi's approach to winning was formed from repetitive disciplined training, focused practice, knowing his opponent and unorthodoxy.
Key takeaways from Miyamoto Musashi success
1) Grind alone and become savage
2) Develop your own strategy unlike any other
3) Outsmart your competition always stay sharp
4) Become ghost and lead a low profile life
🎁Please hit the like button and
🎁Leave a comment to support our team!
RISK DISCLAIMER:
Trading Futures , Forex, CFDs and Stocks involves a risk of loss.
Please consider carefully if such trading is appropriate for you.
Past performance is not indicative of future results.

IMPORTANT Macroeconomics: What is the trade balance?IMPORTANT Macroeconomics: What is the trade balance?
The trade balance is an important economic indicator that can have a significant influence on the stock markets.
Here is a simple explanation of this concept and its potential impact:
What is the trade balance?
The trade balance represents the difference between the value of a country's exports and imports over a given period.
In other words:
- If a country exports more than it imports, its trade balance is in surplus (positive).
- If a country imports more than it exports, its trade balance is in deficit (negative).
Impact on the stock markets
The influence of the trade balance on the stock markets can vary depending on whether it is in surplus or deficit:
Trade balance surplus
A trade surplus can generally have a positive impact on the stock markets:
- It indicates strong competitiveness of domestic companies in international markets.
- It can strengthen the value of the national currency, which can attract foreign investors.
-Exporting companies may see their shares increase in value.
Trade deficit
A trade deficit can have a negative impact on stock markets:
-It can indicate a weakness in the domestic economy or a loss of competitiveness.
-It can weaken the domestic currency, which can discourage foreign investors.
-The shares of companies dependent on imports may be negatively affected.
Important nuances
It is crucial to note that the impact of the trade balance on stock markets is not always direct or predictable:
-Overall economic context: Other economic factors can attenuate or amplify the effect of the trade balance.
-Investor perception: The reaction of the markets often depends on how investors interpret the trade balance figures in relation to their expectations.
-Specific sectors: Some sectors may be more affected than others by changes in the trade balance.
In conclusion, although the trade balance is an important indicator, its influence on stock markets must be seen in the broader context of the economy and investor sentiment.
