📊What is a key level? How to use it in trading? Clear tutorial!What is a key level? A key level is a price level on the chart that creates the support or resistance to the price when it falls or rises. A key level is also called an extremum.
📊There are 3 types of levels in total:
1. Resistance level — when price rises and rebounds down when it test the level.
2. Support level — when price falls and rebounds up when it test the level.
3. Mirror level — when the level is both support and resistance.
🚩How to identify the key level? As a rule, the key level may be either the price maximum (high, H) or minimum (low, L). Price maximums occur when the price moves in a trend (bearish or bullish). It is harder to identify the key levels during consolidation, because often the price simply blurs them, making false breakouts, as we can see on the Bitcoin chart. Especially often the key level is the global highs (ATH).
It can be found on any timeframe, but the higher it is (4 hours, 1 day, 1 week), the more clearly they work, because the level of 1 week may be identify by a scalper, a swing-trader or an investor, while the local levels of 1-30 minutes are only looked at by scalpers, i.e. a smaller total number of traders.
Usually, the key level is an even number: 1, 50, 100, 1000. For example, $ 50,000 for Bitcoin, $ 2,000 for Ethereum, $ 1.5 for Forex pairs.
💹Why do key levels work? It's all because the traders place their orders near these levels. To put it simply, key levels work and price reacts to them, because a large number of traders often use them. Every trader knows that when Bitcoin is falling, the level of $ 20,000 will be support for the price, because this is the level of the previous ATH, and most traders put buy orders, so the bounce of the price can be huge (10-20%).
✅How can you use a key level in trading? There are many different uses of the key level in trading, for example, trading a rebound from a level when a trader places a buy order below the level or a sell order above the level. As I said before, the more prominent the level on the chart, the stronger the price pullback, so some traders place their orders near key levels in advance to buy or sell at the best price.
Also, I use the key level on 30m-4h timeframses to identify price weakness or strength for false breakout trading. A false breakout of a key level shows that most traders are set up for a price move in the other direction.
🔥As many traders as there are ways to use the key level. My advice is to be craftier and use the key level with the rest of the technical analysis instruments, candle patterns, indicators. That way your win rate can increase significantly when different approaches are used together.
🏁Traders, how the key level helps you to identify the best entry point? Share your idea or a screenshot in the comments!
💻Friends, press the "like"👍 button, write comments and share with your friends - it will be the best THANK YOU.
P.S. Personally, I open an entry if the price shows it according to my strategy.
Always do your analysis before making a trade.
Bitcoin (Cryptocurrency)

➖ 3 Tips To Improve Decision Making/Profits While Trading CryptoTo make money trading you need to have the right strategy, make the right decisions and be patient… But there is more.
It can happen that I share with you 5 trades from which 4 are successful and 1 is not.
You go all-in into 1 trade and somehow you picked the only one that didn't go up.
Your chances were really high yet someone can make the wrong call over and over even with the right plan… Some people call it bad luck, it is not.
In such a scenario we have to look at other areas of our lives.
Trading can make big sums of money and big sums of money can change your life.
If you are not ready for change, if you cannot accept change, new money isn’t likely to able to get to you.
If in your life you are overloaded/stressed, then you will continue to pick the wrong trades.
So, to have a better chance to be guided by your intuition, your higher self, your Soul rather than a misguided ego…
Make sure to have the right mindset and be open to accepting the changes that the profits you are looking for will create in your life.
TIP#1 | GET RID OF THE OLD!
When was the last time you changed your purse/wallet?
Not your Bitcoin wallet, even though that one needs to be updated often, but your physical wallet/purse you carry around.
When was the last time you changed your closet?
How old is that jacket or blouse, how old are those jeans?
That shirt you never wear but will wear one day when the event comes…
Or worse yet, that dress that has been sitting there yet your 15 years of age are long, long gone.
In order to make room for the new, the old has to go.
This is something that I practice always and it was really hard to implement at first, not really for me, but for all those around me.
It was really hard for them to detach from the old.
I got rid of everything, even without having the money to buy the new, I completely trusted in internal guidance and got rid of everything as fast as I could. Then the money quickly materialized as soon as the necessity was created (the energy was released)… Getting rid of the old stuff opened space in my energy field for new stuff.
Just like you cannot pour liquid in a glass that's already full, if you empty the glass, something new can fit in.
Start by getting rid of all of your clothes that are 1 year or older… Regardless of what it is… And just watch the magic happen.
You can also change your phone, your car, your hairstyle, your way of walking, your exercise routine, the place you live, your friends, etc.
Anything old that goes away, the energy is released and something new can come and takes its place.
Can be the same but an upgraded version or something completely new…
You can have fun with this… Get rid of the old.
TIP #2 | FAST & LIQUID FOODS
I will explain this one in a way that is directly related to trading.
Food is heavy on the human body, especially conventional foods which is what most people consume.
The digestion process is high in energy consumption… Some people can notice becoming weak/lethargic after eating… That’s because your body needs to use tons of energy and resources to process all the ingested food.
As so much energy is used for digestion, little energy is left for all the remaining tasks that your body needs to perform for you to be at your best.
Thinking?
Goes second.
Being wealthy… Secondary as well…
Your body prioritizes processing all this food and much of today’s food is highly processed lacking enzymes which compounds the problem.
When we fast, we free up tons of energy which can, in turn, be used to heal ourselves… Once we are in good shape, in good health, this energy instead can go to other processes such as thinking, which can help you make better decisions while trading.
Now, fasting is not easy for many people so I have another solution for you.
You can start by doing “intermittent fasting”, which is basically a half-fast or even better, consume “liquid foods”.
You can liquify fruits and vegetables with a juicer or blender, pretty easy, and go on the entire weekend without eating any solid food.
You will feel GOD like on Monday. This is just a small taste of the benefits you can get, but it is a great start.
Once you start fasting for real you will understand Jesus, the Buddha, Shiva, and all the great “Ascended Masters”… You will understand them just a little bit of course, as they had many other techniques and they felt so much more but this can give you a glimpse into many feelings that not many people are experiencing at this moment.
Now, I got to write this about “liquid foods” not to mention juices and smoothies but actual superfoods that can be drunk with juice or water.
Are you aware of “superfood powders”?
There is a class of supplements called “superfoods” which are the ones I would like for you to research to improve/better your mental processes which can highly assist you in dealing with stress and so making the right choices while trading.
I will name the most basics yet powerful ones…
* Spirulina powder
* Chlorella powder
* Hemp seed powder
* Ascorbic acid (vitamin C)
* Digestive enzymes
* Pre-, Pro- and Postbiotics
* Liquid minerals
Research these and start taking them on juice or water and see magic happen.
You will not only improve your trading but your entire life will be upgraded by a few levels… You might start to experience visions very quickly and other paranormal experiences if you are sensitive to the spiritual realms but this is just an extra, the physical benefits are sure to enjoyed/felt quickly as well.
TIP #3 | DEEP BREATHING WITH YOUR EYES CLOSED
Last, to finish this long article… We go to meditation.
Meditation will calm your mind.
This in turn can help you organize all of your thoughts subconsciously, you don’t have to do anything, which will let you see more clearly what it is that you really need to do next in order to get the results that you want or advanced to the next phase of your life.
My meditation is the easiest of all and the one I recommend to everybody who is just getting started and it goes like this:
1. Either just after waking up or before going to sleep, or both…
2. Close your eyes and breath deeply for 5-10 minutes.
That’s it.
If by any chance at any time you open your eyes, restart the timer and start over.
You can start with 1 minute if 5 is too much and increase little by little as you feel comfortable.
The goal is to stay in peaceful contemplation for 3-5 hours.
You can use any type of breathing you prefer.
You can breathe deeply through your nose…
Hold for a few seconds and then exhale through your nose…
Over and over until the timer beeps.
Namaste.

📊How to use the VOLUME indicator? Tutorial for traders!The volume indicator is so universal that it is used by most traders, no matter what their trading style. I will talk about the main methods of using this indicator in this idea.
📊What is the volume? A volume indicator is data from the exchange on how much cryptocurrency or shares were traded during a certain period of time. Volumes are displayed in the form of bars. The more bought and sold, the higher the bars on the indicator.
How can I use volumes?
✅Volumes show large trades, which helps to understand the sentiment of the market (bullish or bearish). In this GMT example, you can see how traders bought this coin 4 times and did not "let" the price go lower. After that, you could open a profitable trade on a breakdown of the trend line.
✅Test levels as support. The same principle as in the first example, but here there is a clear test of the level by the price. Volume growth in this case helps you to understand the strength of the buyers and open your trade!
✅False breakout is a situation in the market when the price breaks through a key level for a while and comes back under it. This pattern happens very often in the cryptocurrency market. The volumes grew, which shows a large amount of traded volume, but the price did not go higher and showed weakness, and then Bitcoin fell. Keep this pattern in mind.
✅Divergences. You can see a divergence in the Bitcoin price. Divergence is when the indicator and price values start to be different. As volumes rose, so did the price. After volumes began to fall and the price continued to rise, a divergence formed and Bitcoin fell by 50%. Divergences can be looked for in any cryptocurrency and any timeframe.
✅Indicators. Volumes are a classical indicator, on the basis of which many other well-known indicators are built: VWAP, OBV, etc.
⚙How can I add the volume indicator to the chart? You need to open "Indicators" on the top panel of TradingView and write "Volume" in the search bar. After clicking on the title, it will automatically be added to the chart.
🚩On what timeframes can I use volumes?
Volumes can be used on all timeframes, but it all depends on trading style:
1️⃣ Scalpers watch volumes on lower timeframes: 1m, 5m, 30m. In this way they can identify if the price reacts to a key level, trend line or value zone;
2️⃣ Swing traders use the indicator on timeframes from 1 hour to 1 day. By the same principle as scalpers, you can identify the reaction of other traders to a particular level. For example, Bitcoin has fallen to $50,000 and touched a key level where other traders' buy orders may have been placed. If there were really a lot of bids there, then on the volume indicator, you will see the bars rise as well as price rise. If there was no growth in the bars, it means that most likely the price will fall further.
3️⃣ Long-term traders use the indicator on timeframes from 1 day to 1 week and more. With the help of volumes on higher timeframes, you can identify large liquidation zones on exchanges, important resistance and support levels.
Friends, if you still have questions about how to use the volume indicator, write in the comments. What other methods of using this indicator do you know?
💻Press the "like"👍 button, write comments and share with your friends - it will be the best THANK YOU.
P.S. Personally, I open an entry if the price shows it according to my strategy.
Always do your analysis before making a trade.

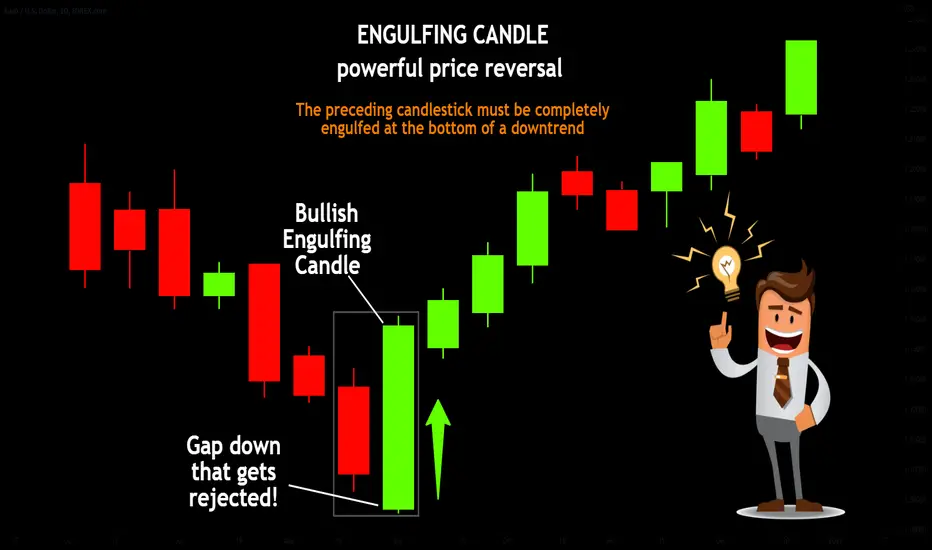
ENGULFING CANDLE | powerful price reversal📚
✅The engulfing model (external bar) is mainly a reversal pattern (although in rare cases it may indicate a continuation of the trend). It looks like two candles, the first of which is small, and the second is large, with a body larger than the entire previous candle, and directed in the opposite direction.
✅From the point of view of crowd movement, such a pattern means that the strength of the current trend is drying up (this is evidenced by the small size of the first engulfing candle). The crowd does not know in which direction to move and, figuratively speaking, is marking time. The appearance of a powerful candle that absorbed the previous one and closed in the opposite direction marks the beginning of a new, strong trend.
⚠️There are several mandatory conditions that the pattern must meet in order for its signal to provide the maximum probability of working out:
1️⃣Before the pattern itself, there must be a downtrend or an uptrend in the market. The movement may be small, but its presence is mandatory;
2️⃣The body of the second candle should be of a different color and orientation (bearish after bullish and bullish after bearish). Shadows may not be absorbed, but then the signal is considered weaker;
3️⃣The body of the second candle should have a contrasting color with respect to the body of the first. The exception is when the body of the first candle is very small (doji or close to it).
❤️ Please, support our work with like & comment! ❤️
📊How to make a trading strategy?What helps the traders to be successful? That's right, their trading strategies. A trading strategy is a trader's plan for deciding whether or not to open a trade. The purpose of the strategy is to help the trader to make more successful trades, to analyze the mistakes and successes. At a time of uncertainty, these rules help to keep calm and make the right decision. Simply put, it's a set of filters that remove unnecessary noise from the charts and help you make right decision.
💹How to develop a trading strategy? Figure out what you want to trade and what you're best at. Do you like trading false breakouts? Let`s do it! Like to trade patterns? Perfect! Pick your best 20-30 possible trades from the past on the chart, and look for those patterns to repeat on the chart.
As soon as you get a chance to make a trade, remember the rules of your strategy, and if they all match, then do it.
💹What does a trading strategy consist of? This set of rules includes:
1️⃣ The tool you use (patterns, levels, indicators, waves, candlestick analysis, etc.). For example, a squeeze under the trend line, a false breakout of a level, the exit of the indicator into the oversold or overbought zone - all these trading tools can be used in your strategy.
2️⃣ Risk Management. How much money to use in 1 trade, risk per trade. This is a mandatory ingredient of any trading strategy. You can't be 100% right on every trade, so risking all of your capital is not advisable. The average win rate of traders is 50-60%. That means that 5-6 out of 10 trades will be successful - an excellent result. The other 4 trades will be either loss-making or break-even, so it is better to start with a small amount or virtual account on the crypto exchange. In the picture below, you can see what the risk-to-reward ratio and winrate should be.
If you have 50% of successful trades, then at least in each trade you should have RR 1:2 (for 1 risk you receive 2 rewards). To calculate your RR in TradingView, use the "Date and Price Range" section on the left side of the screen and choose "Long Positions" or "Short Position".
✅Example of a trading strategy.
Tools:
🔶false breakout of the key level;
🔶volume indicator.
Description: you marked a key level of $30420 on the chart. After the false breakout you noticed that a large volume appeared on the chart.
Target: the level of highs of $42K.
Risk to reward (RR) 1:5. Good for us? Let's look at the table! The win rate of this strategy is 50% and so RR profitable.
🚩Summary: by opening a trade with a risk of $10, you got $50.
💹Advice for beginners:
1. the trading strategy does not have to be yours. You can take the rules from another strategy and adapt them to you, make your own risk management, rules of entering the trade, in the end, how many trades you make per week or month.
2. start with something simple, like a channel trade and a volume indicator that will show you the reaction of a buyer or seller when it touches the channel boundary. Gradually add filters to remove noise from your charts and increase your win rate. For example, do not open a long on altcoins if Bitcoin is falling. Statistically, 99% of cryptocurrencies repeat Bitcoin's movements, so it is unlikely to be a good trade. Unless you know the secret information, or you have more than 8 years in trading, and you have enough experience.
3. make screenshots of your best and unsuccessful trades, analyze problems and fix them, and try to repeat the best trades more often. A trading journal is best for keeping statistics.
🏁Follow your plan and you will succeed. If you still have questions about how to create your trading strategy, write in the comments. Experienced traders, how did you create your own trading strategy? Share it with the beginners!
💻Friends, press the "like"👍 button, write comments and share with your friends - it will be the best THANK YOU.
P.S. Personally, I open an entry if the price shows it according to my strategy.
Always do your analysis before making a trade.

Will the crypto market recover? ❇️Hello guys,
Some of you have texted me asking if this market will stay this way? What happened to LUNA? What happened to Tether and Terra?
Well, I will keep this short. You do not need to worry!
People always do this. They always panic and sell RANDOMLY, without reading and investigating the situation.
There will be no time until all intelligent investors realize that it is a significant opportunity for buying. And as soon as the buy volumes start to increase and the fundamental news starts to spread about what a great chance it is to buy crypto, people worldwide will begin to follow and buy more and more out of FOMO, which is not a bad thing.
Of course, we have to be careful. There have been regulations and apparent reasons behind this big crash. And indeed, there will be more regulations. So If you are waiting for this buying opportunity, do not jump ahead.
Wait for some signals, read the news, analyze the market and make sure before jumping on the recovery train.
Until then, have these items in mind in heavy dumps:
1. Do not do leverage trading
2. Do not buy coins in FOMO
3. Do not stick to the screen all-day
4. Do not do revenge trading
5. Do not average out every dip
6. Do not go all in one coin
Let me know your ideas.
Good luck.
Source and Reference: www.forbes.com

Advanced Level (Bull Market Truncation)
Hi everyone.
As you know, There are 3 orders of simple patterns of waves, also, there are 13 variations of simple patterns: impulse, ending diagonal , leading diagonal , zigzag , double zigzag , triple zigzag , regular flat, expanded flat, running flat, contracting triangle, descending triangle , ascending triangle and expanding triangle.
Zigzag (5-3-5)
A single zigzag is a simple three-wave declining pattern labeled ABC
Fibonacci ratio:
Wave B = 50%, 61.8%, 76.4% or 85.4% of wave A
Wave C = 61.8%, 100%, 123.6% or 161.8% of wave A

📉How to stay calm during market crashes?🔋Hi friends! Have you saved your deposit to buy crypto? Markets are falling lower and lower every day. In this idea I will give you some tips on how to open successful trades when the market is bleeding and emotions are taking over.
At the crypto market, such massive dumps happen once in 3 years, but the price sometimes falls by 30% and rises by 500-700%. This is called volatility. Crypto market is still quite young, so it is very high here.
I think it`s an advantage because it`s give more opportunities to traders and investors to grow their deposit faster in compare to stock or forex markets. But if you don`t know what to do during market crashes and stay calm at any markets i`ll share with you some tips:
📈Follow the trend. First and foremost rule. You think you can reverse the price direction by yourself? Unless you have more than $1 trillion:) Why would you fight the market when it can help you? If you don`t know what is trend, please, check this idea. It helps you to identify it on lower (1m-1h), middle (1h-1d), higher (1d-1M) timeframes.
📣Join the trading community. Talk to different traders (scalpers, swingers), investors. Share ideas, keep an eye on other people's trading ideas. This way you'll faster understand your mistakes, raise your win rate and look at trading from different points of view. The human mind is built so that you calm down when you shares your thoughts. Do it!
💹Use the trading strategy. Open trades only when the strategy tells you to do so. If you don't know what a trading strategy is or how to make one, post in the comments I'll do an update for you. Simply put, you need to:
1. Create filters to help you identify future price movement.
2. Use risk and money management. To earn in trading you don`t need to open a trade using all your depo.
🚩Personally, I use: trend lines, squeeze under them, mark key levels, volume and horizontal volume indicators, track the market manipulation. There are many trading tools - find your own or borrow someone else's and adapt to yourself and your psychology.
👶If you are new to the market and this is your first experience, trade on a virtual account or try to start with 1% of your capital. If you can't make $200 from $100, how can you make $20,000 from $10,000?
🏁The statistics says that only 1% of traders make profit, 9% trade at breakeven and the other 90% lose money. Be the 1%, learn, read, develop and stay calm!
Friends, press the "like"👍 button, write comments and share with your friends - it will be the best THANK YOU.
P.S. Personally, I open an entry if the price shows it according to my strategy.
Always do your analysis before making a trade.

Inflation is high, Why gold price falling?As traders, of course.. We know that when inflation is too high, safe haven prices such as gold will soar. But that only applies before 2009. Before bitcoin was launched for the first time.
Not many traders know, that market participants such as banks, big institutions, fund managers, and big companies trust bitcoin as a safe-haven, which actually competes with gold. When inflation is too high, market participants will move their money between bitcoin and gold.
So this is one of the reasons why gold falls when inflation is too high. We can clearly see from the short-term chart above, that gold is bearish but bitcoin is bullish, and vice versa, the unidirectional correlation between bitcoin and gold. However, when the USD is optimistic about strengthening, both will be equally bearish. It can be concluded that both are the same as hedging asset. Also, we can use COT data from CFTC and LME to know gold and crypto sentiment and correlation. Coinbase and JPMorgan can also be considered. But I'll discuss this separately in the next explanation.
Hopefully this can help anyone, so that it can be considered for trading in gold and bitcoin.
Practicing how to understand market behavior is much better than just understanding.

Bitcoiners Time TO Run Foundational StrategyBitcoin has spent less than 200 days under green highlighted line.
Bitcoiners should now return to dca from building reserves regardless of bottom is in or not. Bitcoin is undervalued and this is the time to take advantage.
Tell as many friends and family as possible once again as we are in an accumulation zone until $58k.

Morning Star Pattern: how to trade?🌟
❗️The Morning Star pattern is a market reversal pattern consisting of three candlesticks that indicate bullish superiority. This pattern warns us about the weakness of the ongoing downtrend, which, in turn, suggests the beginning of an uptrend.
⚠️Traders observe the formation of the "Morning Star" pattern on the price chart, and then confirm with the help of other technical tools on the Forex currency market.
✅Morning Star pattern: Three forming candles
⏺Big Bearish Candle
⏺A small bullish or bearish candle
⏺Big Bullish Candle
The most important thing to remember is always that the market must be in a downtrend in order to trade according to the "Morning Star" pattern.
In order to confirm the downtrend, mark the lowest lows and the lowest highs.
1️⃣The big bearish candle is the first part of the Morning Star reversal pattern. This candle indicates that the bears are in full control of the market, which means that sellers continue to pressure the market.
At the moment, you should only look for sale deals, since there are no signs of a reversal yet. Here the Morning Star pattern is just beginning its formation.
2️⃣A small bullish/bearish candle is the second candle that starts with a bearish gap down. This candle indicates that sellers are unable to lower the price, despite very great efforts.
The price action ends with the formation of a rather small bullish/bearish candle (Doji candle).
If this candle is bullish, then we have an early sign of a trend reversal.
3️⃣A large bullish candle is the third candle that has the greatest significance, because here the real pressure of buyers is manifested. If the candle starts with a break, and buyers can push prices up by closing the candle even above the first red candle, this is a clear sign of a trend reversal.
✅Morning star: how to trade this pattern on Forex?
As we already know, the Morning Star pattern is a reversal pattern. As a rule, it indicates that bulls are capturing the trend, and bears are losing control.
Most beginners trade using the "Morning Star" pattern on their own, without using technical tools, or at least tips from more professional traders.
We do not recommend doing this — it is not as reliable as it may seem. Always connect this pattern with other reliable indicators, support and resistance levels, as well as trend lines.
So, in this strategy, we combined the Morning Star pattern with volume. Volume plays an important role in the formation of the model.
If the first red candle shows a low volume, then this is a good sign for us. Then, if the second candle is green and the volume is growing, this indicates buyer pressure.
After all, the volume of the third long green candle should be high. The large volume of the last candle indicates the confirmation of the upcoming trend and the entrances to purchase transactions.
If the third bullish candle has a low volume, do not pay attention to the fact that the Morning Star is forming. This volume does not indicate a bullish reversal.
To sum up: do you observe the closing of the third candle with a large volume? Open buy positions and move along with the uptrend until there are signs of a reversal.
✅Morning Star pattern: entry, take profit and stop loss
We have to open a deal when the next green candle closes. There are many ways to lock in profits.
We can close a position in any resistance zone or supply-demand zone. In this deal, we hold our positions because we have opened a deal since the beginning of a new trend.
You can also close your positions when the price approaches a significant resistance level on the higher timeframe.
⚠️Combining this pattern with volumes makes trading more reliable. Therefore, you need to place a stop loss just below the second candle.
❤️ Please, support our work with like & comment! ❤️

Some ideas on How We Trade (Spot and Leverage)Hi everyone,
let's try something new for you tonight:
I made this video to share with you how we day-trade. It's a video so you watch it and let us know your thoughts. If you like it or find it useful we can make more videos like this.
The market has been a disaster for many:
It has happened before and it will happen again. Just remember to go back and look at how we dealt with it (we hedged enough and we are still 'alive).
I really liked what my good friend Irina said today : 'I think we all learn some lessons these days. That’s what bear markets are for. Learning lessons.''
Her hair is painted red-ish. She promised to paint them Green on Monday so we remain friends (true story, yes).
Watch the video, it could help you see a different way of doing things.
Remember: Trading is RISKY and is not recommended for anyone! DYOR and LEARN from everything that happens.
one Love,
the FXPROFESSOR

Want to play safe? Don't play at all... for now! ⚠️This is just a short idea to remind you of some important items in situations like this.
Don't just open random positions.
Have these items in mind:
What not to do in Heavy dumps
1. Don't do leverage trading
2. Don't buy coins in FOMO
3. Don't stick to the screen all-day
4. Don't do revenge trading
5. Don't average out every dip
6. Don't go all in one coin

❗Black Swan by stablecoins. Threat or opportunity for traders?Hi friends! If it heppen to one UST is it heppen to another stablecoins? Next trigger for BTC dump can be caused by stablecoins instability. In this idea i`ll show you some facts about it!
🦢Black Swan. The last Black Swan in all financial markets happened in 2020 because of Covid-19. The crypto market fell by 64%. After the bull market, the Fed Reserve started raising the interest rate, BTC fell by 56%.
What if all the stabelcoins are not secured by anything? If previously the fall of cryptocurrencies was caused by global cataclysms, now we can expect the first black swan only for the cryptocurrency market.
With a EXTREME fear in the market and panic sales of retail traders, BTC could fall to $22k or lower.
📊Stablecoins by Market Capitalization:
1. Tether (USDT) - $83B
2. USD Coin (USDC) - $48.5B
3. Binance USD (BUSD) - $17.1B
4. Dai (DAI) - $6.9B
5. TerraUSD (UST) - $6.9B
Total: $169.4B
❗It`s almost 10% of TOTAL Crypto market Capitalization (169.4/1400).
💱We all know what happened to Luna and UST stabelcoin. US Treasury Secretary Janet Yellen pushes for stablecoin regulation by end of year. Even if the LUNA and UST recover to their previous price, a lot of attention will be focused on other stablecoins as well. On the other hand, this is positive for the crypto market and market players, as crypto security will increase.
✅Friends, if you don`t know what to do when BTC fall by 60-75%, check this idea! I made an educational idea for you when BTC was $39k. It describes 3 ways how you can identify the bottom of the market for BTC and Altcoins!
Friends, where will Bitcoin bottom price? $20-22k or lower? Or BTC already find the dip and go to renew ATH? Share your ideas in comments!
Friends, press the "like"👍 button, write comments and share with your friends - it will be the best THANK YOU.
P.S. Personally, I open an entry if the price shows it according to my strategy.
Always do your analysis before making a trade.

📊How to use Volume indicator to identify the BOTTOM?...and finally buy the right BTC and ALTs dip!😊
Hi friends! Lots of traders buy crypto at the ATH or close to it in hope to make 10x,100x etc. Is it possible and how to do it more succesfull? In this idea i`ll share with you some methods that can realy help you to:
🔶 identify the bottom of the market
🔶 use the volume indicator in right way
🔶 get crypto at a discount
1. Identify the bottom of the market. Already in several ideas I explain you how you can identify the bottom of the market, and traders shared their ideas in the comments also. We will not stop for a long time around all the methods, you can read about them in this idea and in the comments below it.
💹In this idea I will talk about the fundamental method of how to identify the bottom - liquidation . Liquidation is the process when the exchange takes traders' money to cover losses of a long or short. This can happen if you use leverage in trading and do not use risk and money management. 'Cascades of Liquidations' happen when the price falls without any stops by 30-50%. This is a result of not enough buyers in the market to hold the price and as the price drops, more and more leveraged positions get liquidated - it's like a snowball effect🏂 I've seen this in 2018, seen traders who entered the crypto market in the spring of 2020 and most recently in 2021.
2. Use the volume indicator in right way. Why do I use a volume indicator? It's very simple. This is an indicator that shows where a big players open or close their trades. 🚩If a huge liquidations have happened, someone has sold a lot and someone has bought a lot. Why? Just as DOM and Footprint help to identify whale buying or selling orders, so the volumes show the amount of money traded and help to identify liquidations. Also, it can be used at different timeframes to see whales' willingness to buy or sell at key levels, trend lines and other trading instruments. Volume is a real representation of the number of trades.
3. Get crypto at a discount. If you wanted to buy Bitcoin at 60k, why when it drop by 70% you don't want to buy it? Or altcoin, which is down by 95%? A simple example, when you go to the store you want to buy a car with a discount . If there are two identical Lambos🚙 which cost $250,000 and $100,000, why do you want to buy the one that costs more? Ask yourself this question. This is not financial advice, just a comparison of facts and explanation of traders psychology.
✅As we can see on the chart, the last time after such a massive liquidation in 2020-2021, Bitcoin and Ethereum rose by 1100% and 3400%. For example, Binance Coin (BNB) rose by 6460%, Cardano rose by 11400%. Also, after the last liquidations in 2021, there was a good ALTSEASON, when Bitcoin grew by 100%, and all Altcoins by more than 300%.
🏁My personal advice if it`s happen again:
1. Remember about your risks and money management.
2. Use your strategy and don`t panic. You need to just wait for good entry point.
3. Use VOLUME indicator like an additional tool. This indicator can help you to identify the bottom, but not to do all the work for you.
💻Please write in the comments if you still have the questions about the liquidations or Volume indicator! I`ll try to explain you additional tips 🎇
Press the "like"👍 button, write comments and share with your friends - it will be the best THANK YOU.
P.S. Personally, I open an entry if the price shows it according to my strategy.
Always do your analysis before making a trade.

Bitcoin Short Term Analysis with Curved Trend Line!Today i will be showing you how to use Curved Trend Line indicator.
This indicator contains 21 period ema which is red line and 20 period sma which is yellow line.
This 2 averages together work like a trendline. So if the prices are below both lines we are in a downtrend and vice a versa.
If price is in the green are which between the 2 lines, that means price is in a area of indecision.
Just like regular trendline, this curved trendline shows us resistance and support areas.
Let me show you with an example.
There is an uptrend that formed in the late January.
Price tested that trend line 1 month later and price went 45k area quickly.
Last week we tested that trendline again and held.
Price can go to the 45k area again.
It can retest trendline before going up.
Or it can go up without testing it again.
This also correspond with my Curved Trend Line indicator!
We are trying to break above Trend Indicator at 40k!
Right now we are testing CTL to go higher. If we can manage to stay above price action will be to the upside of 45k.
Also, for a month CTL act as a resistance.
Everytime price test the CTL and try to breakout above it got rejected.
This is an indicator that works as an support - resistance of a price!
You can also use this CTL to validate your formations, SL-TP points!
Use this CTL with daily or higher timeframes for more accurate decisions!
If you want to try that %100 free indicator just message me!
Important Daily Support
38k
35k
Important Daily Resistance
40k
41k
45k

Don’t bite the bait. Time is money. This is a case of comparative advantage. Which means the less time it takes the coin to produce oil or energy, maybe even transactions. All will go down and then pop back up, much like a sinking ship.
Within the next 5 hours, an entry point will be present. It’s time to glean for Q2, because after this the prices will hit an all time high and then go back down until July. A lot will assume now is too soon, but yesterdays price isn’t todays price.
However, the cup and handle has presented its self. Now the next sign of equilibrium the price will make will be like a Nike check. Or a Wolfe wave. The eagle has left the nest.
2. API CRUDE OIL U.S.: anything under 5 is a sink. Forecast is in the -1.0 range.
TOTAL VEHICLE CAR SALES: Elon and Twitter
Don’t hire the bait just yet.

🚩How to identify the bottom and BUY the crypto in time? 3 tips!🌟How to BUY crypto in time and with the possible highest RETURN? The correct answer is during the capitulations.
🎯Capitulation is when even patient and experienced traders start to panic, but this is the opportunity time (Jan 2015, Nov 2018, Mar 2020, May 2021).
🔶How to buy crypto during the capitulations? Use the dollar cost average (DCA) strategy. This strategy allows you to buy crypto by parts without risking all of your capital.
🔶How to use DCA strategy? This strategy helps to average the BUY price. You can only sell at the top and buy at the bottom by accident. In real life, this strategy helps to average the buy price of a crypto. For example, back in 2019, you bought Bitcoin 3 times at $3,000, $4,000, and $5,000. The average purchase price in this case is $4,000. If the price go lower, you would average the price, if it rose, you already bought at a good price. Also, you can BUY at the weekly candle close during the capitulions. It is important to use the equal parts of the capital to buy (1/10, 1/20 etc.). Another simple example is shown on the chart😉
🔶How you can identify a capitulation?
1. Look at the volumes and record liquidations as shown on the chart. The liquidation of 50-100k Bitcoins is the best indicator.
2. Look at the percentage of drop from the highs. Historically, a price drop by 65-80% has been the bottom of the market.
3. Use the indicators that show the bottom of the market. Read this idea about the 🔋Greenwich indicator. It shows both the top and bottom of the market. So when BUY signals (green diamonds) appear, you can use this indicator to buy crypto by parts.
🔶Why does the DCA strategy work? Bitcoin, like U.S. stock markets, is in a long-term Uptrend. After buying Bitcoin in 2017 at its ATH ($18-19k), investors are now still at +100% profit. And as long as this trend is not broken this strategy will work. For example, the U.S. stock market has been in uptrend for over 80-90 years.
💻Please write in the comments if you still have questions about the DCA strategy or how else you can identify the bottom. What methods do you use for that? 🎇
Press the "like"👍 button, write comments and share with your friends - it will be the best THANK YOU.
P.S. Personally, I open an entry if the price shows it according to my strategy.
Always do your analysis before making a trade.

Bitcoin: Liquidity and Order blocks!This is an educational post! I have tried to combine the concept of liquidity with that of supply and demand to show you one of the most efficient trade setups in financial markets!
You basically have a descending trendline in 30m chart of bitcoin! Price reaches a confluence area in higher time frame analysis (let's not be concerned about that now) then it jumps a bit to create a range! We know range bounds are liquidity nests!
So price first grabs the upper range liquidity, breaking the market structure at the same time and hence confirming the long bias! Then it comes down to the demand zone, grabbing the lower range liquidity at the same time and then boom! It goes to the target!

potential strateges to survive the bear marketThe war between Bulls and Bears are natural and inevitable, as a matter of fact the market needs the bearish momentum in other to create more entry opportunity for buyers.
Bear market is difficult to articulate as no one can actually predict the top or when it would hit the bottom making it difficult. to tell when to exit the market during the bull run and when to enter during the bear blood bath and wrong timing leaves traders with regret.
the most important thing in every war is being the survivor and to be the survivor you need some strategic approach. in view if this i am highlighting 6 Crypto bear market survival insight on this article to help you survive any bear market.
1/} DO NOTTING: why should you sell the innovation which you you believe in and also has the potential to change your life in longer term.
>more so its much better to be hodler than a trader as you wont be missing any opportunity
>knowing that crypto market is not just designed to only moon should give you the assurance not to panic sell.
>the crypto market correction (aka bear market) should be seen as an opportunity to buy more.
2/} GO 100% CASH: if you are good in market analysis and you dim your trading strategy fit, you may consider going 100% cash or 100% stable coin any time the market hit resistance and you buy back on support bottom. but chances are that you will miss some opportunity as no one can actually be 100% accurate on crypto market.
3/} DCA: this is one of the unique strategy that many individuals utilize even michael saylor the founder of micro strategy which holds about 129,218 bitcoin have been trading with this method.
Dollar Cost Average technique is a great method method to lower the entry price of an asset. This can be archived by buying more during a potential market decline (eg, 20%, 40%, 60%,) this could give you an edge as you could make 10x of your investment before the market rebounds to your first entry point.
4/} portfolio Allocation: in other to minimize the wight of bleed in your portfolio during bear market, it would be wise to diversify your portfolio (eg, 60% Bitcoin and 20% eth and 20% stable coin.) if bitcoin goes down 50% their are chances that other alt has hit 70-90 percent lower from the all time high.
i will be posting how to effectively portion your coin on my twitter page so try to check it out.
5/} Fund Management: you need to have a strategic approach on managing your buying power. i have had people complain of not having fund to buy more. don't go all in at a time in other to have funds at your disposal. always anticipate that the market could go lower. split your 100$ in 10 packs to enable you buy more 10 market dips.
6/} Be smart: stay healthy with good diet, exercise regularly and read
that would be the end for today, i would like to here your opinion or the strategy that you are using on the comment section.
plz kindly follow and share with your friends.
don't forget to hit the like button.
trade safe

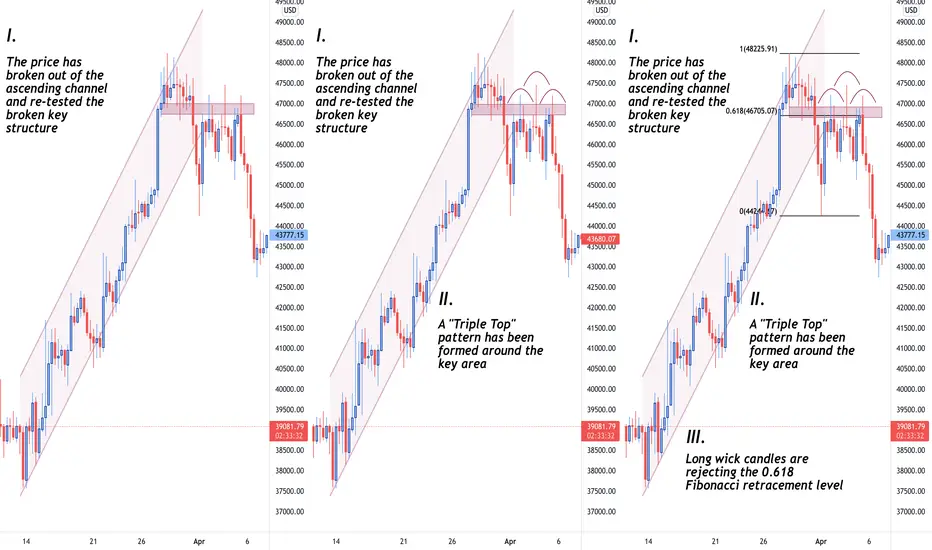
Power of Having Multiple Confluences in TradingThe more confluences you have, the more confident you are in the fact that your technical setup will play out according to the plan. Confluences come in different shapes and styles, whether it is combining some Moving Averages and Bollinger Bands with price action, or having your grandma flip a coin a decide the faith of Bitcoin.
On the graphical illustration that you can see on the screen, 3 confluences have been utilised to back up our idea and they are the following:
1) "Break + retest" formation
2) "Triple Top" pattern
3) Fibonacci retracement tool
It can be noticed from the left hand side of the screen, that the price has nicely broken out of the ascending channel and re-tested the local key structure. Moving to the next step, it can be emphasised that a nice "Triple Top" pattern has been formed. Lastly, we add another confluence to back up a possible scenario that we have eyes on by using the 61.8% Fibonacci retracement level, which is referred to as the "Golden Zone". Taking a look at the chart, we can clearly observe that long candle wicks are nicely rejecting this very zone.
All in all, combining multiple confluences give us enough confluence to back up our sentiment. However, nothing is 100% guaranteed in the markets, meaning that it is not promised that your trade will play out perfectly no matter how many confluences you have. Thus, be risk-tolerant, patient, and cold-blooded!
Have a great upcoming weekend, everyone!
🎯BTC: Real Life wedge trading! Tutorial for traders!🌟 The picture of the wedge pattern is beautiful, but you have to understand how to trade in Real Life! In this idea I will try to teach you how to enter the trade and what to look for. The descending wedge is a bullish pattern. On the chart you can see how it works on Bitcoin. Over the past year, it has worked well in 3 out of 3 trades.
🎓What is the wedge? Wedge is the price consolidation in downtrend or uptrend. So if it`s UPTREND, the price making higher highs and higher lows. The whales in this case sell higher and higher. Ascending (uptrend) wedge is bearish pattern. So If it`s downtrend the price making lower highs and lower lows. The big players try to hunt trader stop losses to get the liquidity for their LONG positions.
🚩Let`s start from the May-July 2021 wedge! In addition to the descending wedge, there are several triggers to open a long:
1. false breakout (liquidity collection) of the $30K key level. A lot of stop losses were collected, a lot of traders were liquidated. The whales were happy. Additionally, pay attention to volumes as well as liquidation volumes.
2. squeeze under the upper boundary of the wedge and test it as support. Here you can open a trade during the squeeze under the trendline and after test it as support. It`s better to check at lower timeframe.
All this added up to a long two-month consolidation with stops losses hunting and Bitcoin DUMP by 50-55%. Many traders simply lost faith and closed positions at a loss.
The price rose by 50-60%, but if you had closed the trade on the next Dump, you would have a profit at least +30-35%.
🚩Next is the Sep 2021 wedge! In this case we didn't see big liquidations, the whales had enough liquidity, and everyone who shorted on this 23% drop became the fuel🔥 for further growth. Additional triggers:
1. a trend change. The price trend changed from a downtrend to a small consolidation and then started to create higher highs and lows.
2. squeezing under the local trend line on lower timeframes. If you switch to the 1 hour timeframe this is clearly visible.
3. test of the global and local trend line as support and growth without pullbacks (strength of the bulls).
We close the deal as soon as the target is reached. If you continued to hold the trade for more than 10 days, the profit would be at least +30%.
🚩 Will the fourth wedge break up(4/4)? During this Apr 2021 wedge, we have not seen the huge liquidations yet. Also, we haven't seen bullish strength, squeezes under trend lines or levels. Therefore, we should wait for our entry point and don`t open trades without the confirmation of the trading strategy. I'll share with you my local ideas later.
🌐Globally, the market has been in a $30-67k consolidation for more than 1.5 years. Sooner or later the price will choose the trend and maybe even in the next few weeks.
🔥Trading is the combination of trading tools, using filters and non-standard methods, which I try to explain in my training ideas.
Friends, press the "like"👍 button, write comments and share with your friends - it will be the best THANK YOU.
P.S. Personally, I open an entry if the price shows it according to my strategy.
Always do your analysis before making a trade.

The bigger picture of BitcoinLudwig v. Mises tells us that sound money is an indispensable line of defense of people's liberties against the encroachment on the part of the state and that sound money is a kind of money that is not dictated by the state but is chosen by the people in the free marketplace. The world we find ourselves in is a rather different place. Our monies—be it the US dollar, the euro, the Chinese renminbi, the yen, or the Swiss franc—represent fiat currencies, monopolized by the state.
Fiat money is economically and socially destructive—with far-reaching and seriously harmful economic and societal consequences, effects that extend beyond what most people would imagine. Fiat money is inflationary; it benefits a few at the expense of many others; it causes boom-and-bust cycles; it leads to overindebtedness; it corrupts society’s morals; and it paves the way toward the almighty, all-powerful state, toward tyranny.
Central Banking Is Marxist
It is certainly no coincidence that “the state” has been expanding ever since the world adopted an unfettered fiat money regime back in the early 1970s, and that as a result individual liberties and freedoms have been under pressure ever since. The state feeds itself on fiat money. It simply issues new debt, which is then monetized by the its central bank, which is at the heart of the fiat money regime.
Perhaps you will find it surprising that I believe that the concept of central banking is truly a Marxist concept. (I am not saying that central banking is only favored by Marxists. Not at all! There are also many other ideologies which approve of central banking.)
In their Communist Manifesto of 1848, Karl Marx (1818–83) and Friedrich Engels (1820–95) compiled a list of measures necessary to establish communism. Measure number 5 reads as follows:
" Centralisation of credit in the hands of the state, by means of a national bank with state capital and an exclusive monopoly.
"
Against this backdrop there should be no doubt that once the state has become the absolute ruler of fiat money, the door is open for it to grow bigger and bigger, eventually turning into the dreaded deep state. And the deep state, as we know well from history, has little regard for individual freedoms and liberties.
Making Money Great Again: Returning to Sound Money
What needs to be done? Well, the challenge at hand is “Making Money Great Again”! This requires, first and foremost, ending the state’s money production monopoly and opening up a free market in money. A free market in money means that people have the freedom to choose the kind of money they wish to use and that people have the freedom to provide their fellow men with alternative goods that may serve them well as money.
The first strategy is monetary enlightenment—informing the widest possible audience about the evils of fiat money and how it affects their personal lives, families, and communities. This also includes explaining to people that there is a superior and practicable alternative to a fiat money regime, namely a free market in money.
The second strategy is making progress in the field of alternative currencies and payment systems, especially in terms of technological disruptions and their economic profitability. This is the activity space for those among us who are propelled by entrepreneurial spirit.
The Key to Free Market Money Is Deconstructing the State
In fact, is it possible that a free market in money can ever emerge as long as there is the kind of state we know today? The state is, as most of you probably know, the territorial monopolist of ultimate decision-making with the right to tax its citizens. We can rightfully expect that this kind of state will do its best to crush any competitor to its fiat money and prevent a free market in money from emerging.
So if we want a free market in money, the sobering logical conclusion is this: we need to reform, to deconstruct, the state (as we know it today).
Now the uncomfortable truth is out, because the state is possibly the fiercest adversary you could choose. How can we hope to achieve victory?
Well, there is certainly no magic spell. One possible and straightforward strategy might be appealing to people's inner self, and that is their right to self-determination.
The right to self-determination is inalienable and it is an indisputable truth. Each and every individual is the owner of his or her body and the owner of goods acquired in nonaggressive ways (without violating the physical integrity of someone else's property). We cannot dispute these words without causing a logical contradiction.
The right to self-determination implies that the citizens of a state have the right (1) to make it known, by a freely conducted plebiscite, that they no longer wish to be members of the state and (2) to form an independent state or to attach themselves to some other state. In other words: the right to self-determination includes the right of secession, that is, people's right to break up the big state and to deconstruct it into smaller units.
Smaller political units are less powerful, more peaceful, and free market oriented. They keep taxation low, or may even go without it and become wealthier. Just think of, e.g., Shanghai, Hong Kong, Switzerland, Liechtenstein, or Monaco. This is because small political units must compete for capital and talents with other political units. They must behave themselves nicely. Otherwise, people and capital will leave their territory. Given a great number of small political units, there is a good chance that some of them will allow for, even encourage, a free market in money, setting an example that creates emulators.
Conclusion
It is hard to say which route would be the most effective in “Making Money Great Again.”
Perhaps the cryptocurrency community will somehow succeed in ending the state (as we know it today), leaving a truly free market in money in its place.
In the meantime, however, it certainly would not hurt if we (1) kept educating the wider audience about what good money is and what bad money is and also (2) kept unmasking the state (as we know it today), showing that it is incompatible with and a violation of the inalienable right to self-determination of each and every human being.
In any case, it is of the utmost importance to wrest the money monopoly out of the hands of the state. Otherwise, there is indeed little hope that the free society (or what little is left of it) can survive.
