Bitcoin | Big Move Ahead..!!BTC/USD (Update)
In Daily Chart, BTC volume has been Decreasing since 12th March Crash, that Means Big Move Ahead.
At the Moment, It's Been Moving Btw Major Support (6.6-6.8k) & Key Resistance (7.4k)
If Bulls Cleared the Resistance (7375) then Bitcoin Might Jump towards 8.8k Area in Coming Days.
If Bulls Lost the Major Support Area then We Could See Another Crash in Coming Days (Target Will be 5.2-5.4k Area)
In 8h Chart, EMA200 (7332) & EMA100 (6950) Both Are Play Important Rule As Key Support & Resistance Level.
At the moment, Bulls holding the EMA100 (Support) & Pushing the Bitcoin price towards EMA200 (Resistance)
Now If Bulls Cleared the EMA200 (Resistance) & Weekly Candle Close Above it then Bitcoin Might PUMP Hard in Coming days (We Could See HALVING FOMO)
If Bitcoin Bulls Failed to Hold EMA100 (Support) Then It Might Retest the 6.4-6,6k Area Again.
BTW Bitcoin Bulls Already Broke the Bullish Flag & Now Forming Another tiny Bullish Flag .
In Case of Bullish Move, Target Will be Between 7340-7380 ( CME gap Area)
Outline : At the Moment, I'm Bullish on BTC & It Might Test the 7340-7380 Area, & Also Waiting for Weekly Closing, It Will be Important for Halving FOMO.
Please like the idea for Support & Subscribe for More ideas like this and share your ideas and charts in Comments Section..!!
Thanks for Your Love & Support..!
Bitcoin (Cryptocurrency)

Bitcoin | Bullish Flag Breakout Done, Now What's Next??BTC/USD (Update)
In 8h Chart, EMA200 (7332) & EMA100 (6950) Both Are Play Important Rule As Key Support & Resistance Level.
At the moment, Bulls holding the EMA100 (Support) & Pushing the Bitcoin price towards EMA200 (Resistance)
Now If Bulls Cleared the EMA200 (Resistance) & Weekly Candle Close Above it then Bitcoin Might PUMP Hard in Coming days (We Could See HALVING FOMO)
If Bitcoin Bulls Failed to Hold EMA100 (Support) Then It Might Retest the 6.4-6,6k Area Again.
BTW Bitcoin Bulls Already Broke the Bullish Flag & Now Forming Another tiny Bullish Flag.
In Case of Bullish Move, Target Will be Between 7340-7380 (CME gap Area)
Outline : At the Moment, I'm Bullish on BTC & It Might Test the 7340-7380 Area, & Also Waiting for Weekly Closing, It Will be Important for Halving FOMO.
Please like the idea for Support & Subscribe for More ideas like this and share your ideas and charts in Comments Section..!!
Thanks for Your Love & Support..!

Do you hold Ethereum?I have posted the daily time frame.
1. Ethereum has a weekly bullish divergence. More than 60 percent time the divergence in higher time frame are worth taking risk IMO.
2.Another thing to notice is also the sentiment in the market. Many people are still in fear. When in fear it a good chance to buy if we can control our emotion.
3, Daily candle looks extremely bullish. 10 April volume a lot of supply has been absorbed and then followed by the huge demand candle(indicated by arrow).
4. In the 2 years time frame if we notice once ETH breaks 175 there has been a good run up.
What else do you think other confluence i have missed?

High Probability of the directionThis time I won't cover the technical analysis of bitcoin again. I will look forward for the technical analysis of the bitcoin dominance in the market because like what we've known that the bitcoin's price is highly correlated with the bitcoin dominance in the crypto space.
Following my previous analysis about this dominance, we can see that there are 2 important patterns to watch both on the macro and micro level. The first important pattern for the macro level is the form of the uptrend channel. The dominance is still trending inside this channel whatsoever although it's now trending slightly above the lower support trend line.
The 2nd pattern is the bearish flag pattern (yellow) of current dominance and I even called this pattern since the dominance was around 66.42%. Specifically for this pattern, the dominance has given us a brief confirmation of this pattern comes true.
The main idea that I want to say here is that the confirmation of bearish flag on micro level has given the confirmation that the bears are gaining a huge strength to potentially breaks the lower support trend line on macro level up trend channel. With current condition, there might be a high probability that the dominance will push lower to breaks the current support. And if this happens, we'll see the dominance to test the white support trend line again which is around 50% level.
The weaken of the bitcoin dominance simply means the weaken of the bitcoin's market capitalization comparing to the total market cap in this crypto industry. Meaning that there is possible huge money outflow to occur in the future. With a huge money outflow means there will be a thickening in supply which will drive the price down.
GOLD | Will Gold Hit the 2000 Mark in 2020??#XAUUSD (Update)
In Monthly Chart, So far GOLD has been Doing Well ..!!
At the Moment Bulls in Control & Pushing the GOLD Price Towards the Major Resistance (1780)
Will Gold Hit the 2000$ Mark in 2020?
Will #Bitcoin (Digital Gold) Follow the #GOLD??
Please like the idea for Support & Subscribe for More ideas like this and share your ideas and charts in Comments Section..!!
Thanks for Your Love & Support..!

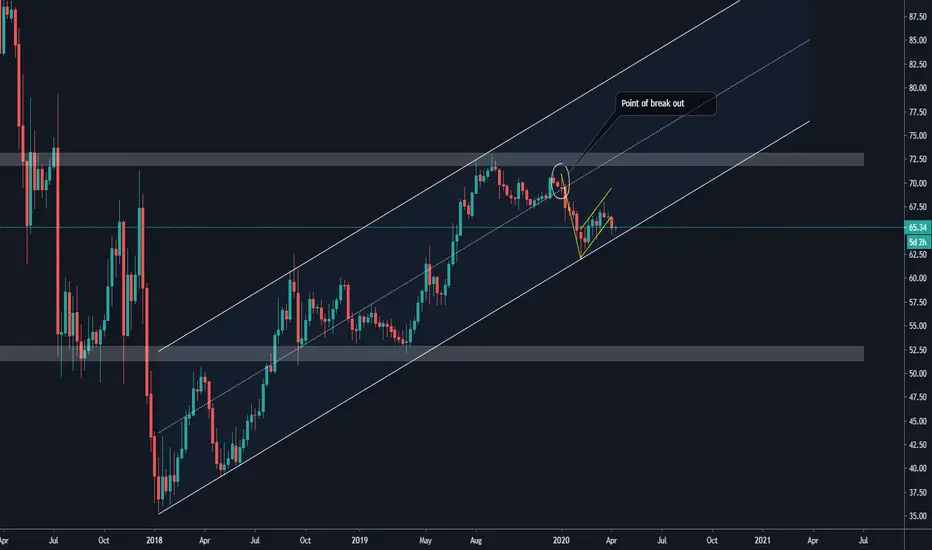
Bitcoin: Finding support & resistance basics 🤓Welcome to the VAPORWAVE_TECHNICOLOR_DREAMHOUSE~~~~~
Before we get into it show your support and give me motivation by clicking LIKE 👍🏽
I’ve been asked multiple times how to identify support and resistance so I wanted to write something up to share with you all 🥳
Let’s start with some definitions
Support - the lowest point a price falls to repeatedly in a given time frame. This price is held by investors placing BUYs as the price drops, holding it steady.
Resistance - the highest price hit repeatedly for a given time frame. as the price goes up more traders are looking to cash out and SELL, limiting how high the price is capable of going.
To find support and resistance values pull up a chart with a long time window, start with 1 month and work down to 1 hour.
In the chart above we’re looking at BTC/USD over the last 18 months and we can see I’ve outlined the follow values I consider to be solid support or resistance.
$3128
$4131
$5576
$6910
$7200
$7583
$8523
$9159
$10307
$10761
$13863
Now these numbers are derived from price patterns, looking at where the candles seem to stop going up or down and finding multiple instances of this, which will indicate the “strength” of the price.
Prices may seem arbitrary but they come from other trades, where they expect a price to go (via historical data or word of mouth) and as continued values become ingrained into the minds of readers we can use this information to make informed decisions on which way we expect a price to break and where it might end up when it does.
Look at the prices and consider that other traders have the same idea you do and use that to your advantage.
As always remember the golden rule to success 🔑
BUY SUPPORT
SELL RESISTANCE
Cheers,
Banana
PS. Like this idea and want more? Join Flash Trading for daily discussion and calls!

The Impact of Corona on BTC (part II)The Corona virus tightens its grip on all of us as daily news comes out that causes many nations to panic. After the NY Times shared an article with the timeline of the progress of the Corona virus so far, I felt inspired to plot it against the price of Bitcoin.
I published an earlier version on this before that was very successful, so I decided to do a follow-up. You can find a timeline here, based on the article where you can see for yourself how Corona impacted the price of BTC and how the subsequent panic caused many people to sell their assets. People didn't just sell their stocks, bot they even emptied their crypto wallets.
JAN. 11
China reported its first death.
JAN. 20
Other countries, including the United States, confirmed cases.
JAN. 23
Wuhan, a city of more than 11 million, was cut off by the Chinese authorities.
JAN. 30
The W.H.O. declared a global health emergency.
JAN. 31
The Trump administration restricted travel from China
FEB. 2
The first coronavirus death was reported outside China.
FEB. 7
A Chinese doctor who tried to raise the alarm died.
FEB. 13
There were more than 14,000 new cases in Hubei Province.
FEB. 14
France announces the first coronavirus death in Europe.
FEB. 19
Hundreds leave the quarantined cruise ship.
FEB. 21
The virus appears in Iran from an unknown source.
FEB. 23
Italy sees major surge in coronavirus cases and officials lock down towns.
FEB. 24
The Trump administration asks Congress for $1.25 billion for coronavirus response.
FEB. 24
Iran emerges as a second focus point of the virus.
FEB. 26
Latin America reports its first coronavirus case.
FEB. 28
The number of infections in Europe spikes.
FEB. 28
Sub-Saharan Africa records its first infection.
FEB. 29
The United States records its first coronavirus death and announces travel restrictions.
MARCH 3
U.S. officials approve widespread coronavirus testing.
MARCH 11
President Trump blocks most visitors from Continental Europe.
MARCH 13
President Trump declares a national emergency.
MARCH 15
The C.D.C. recommends no gatherings of 50 or more people in the U.S.
MARCH 16
Latin America begins to feel the affects of the virus.
MARCH 17
France imposes a nationwide lockdown.
MARCH 17
The E.U. bars most travelers from outside the bloc for 30 days.
MARCH 19
For the first time, China reports zero local infections.
MARCH 23
Prime Minister Boris Johnson locks Britain down.
MARCH 24
India, a country of 1.3 billion, announces a 21-day lockdown.
MARCH 25
The United States leads the world in confirmed coronavirus cases.
MARCH 27
Trump signs coronavirus stimulus bill into law.
APRIL 2
Global cases top 1 million, and millions loser their jobs.
APRIL 6
Prime Minister Boris Johnson moved into intensive care.
APRIL 12
Prime Minister Boris Johnson moved into intensive care.
Follow me for consistent high quality updates, with clear explanations and charts.
Please like this post to support me.
- Trading Guru

Continuation patterns - Bitcoin forming a Bear FLAGA trader can spot trend extensions with the help of bullish or bearish continuation patterns, which occur in a variety of easily identifiable shapes, some of the most popular of which are known as bull and bear flags.
A bull flag is appropriately spotted in an uptrend when the price is likely to continue upward, while the bear flag is conversely spotted in a downtrend when the price is likely to sink further.
(While the implication of the pattern is far more important than its name, the “flag” terminology derives from its visual similarity to the fabric you’d see hanging outside a government building.)
Each flag pattern consists of two main components: the pole and flag.
The “pole” represents a strong impulsive move (higher/lower) and is backed by a surge in trading volume and the subsequent pause or consolidation the “flag,” which looks like a falling or rising channel.
The flag pattern can be invaluable for a trader in that there are clear points of success and failure to profit or mitigate risk from. If resistance breaks in a bull flag, the trader can be confident price will continue upwards roughly the length of the pole (popularly known as measured height method).
If support of the bull flag is breached, the trader knows the pattern is invalid and continuation is unlikely. The exact opposite is the case for a bear flag.
Is this method 100% safe?
Bull flags and bear flags can be a trader’s friend in strongly trending markets, but they do not always perform as advertised. In some cases, the pattern can present a trap known as a “false breakout” when price breaches the boundary of the flag and quickly retraces.
Waiting for a candlestick to close outside of the flag tends to add credence to the breakout, and can help the trader mitigate risk.
As a trader, you would want to avoid betting or punting on an asset price if the bull flag breakout of bear flag breakout is not backed by strong volumes. A low volume move usually ends up trapping investors on the wrong side of the market.
Further, using indicators like the Relative Strength Index (RSI) to gauge scope for a rally following a breakout can help boost traders’ success rates.
If you like it, please support it liking and following!
Thanks!

BitcoinSymbol: BTCUSD
Here is another tool that we have to share with you.
Long green dot and short red dot.
Find more details about it in our scripts on our trading page.
----------------------------------------------------
Want to level up your trading skills?
We just realesed our new course! Follow our tradingview page and visit the link in our bio if you are looking for new strategy to add to your arsenal.
Also checkout our trading indicator available in the link on our page.
---------------------------------------------------
Thank you for your continued support, God bless.
- Major League Trader


Bitcoin | Rising Wedge & CME GAP..!!BTC/USD (Update)
In 4hr Chart, #Bitcoin Forming Rising Wedge Pattern & Almost Ready for Big Move.
If Wedge Broken Upside, Then Bulls Might fill the $800 Unfilled gap in Coming Days.
If Wedge Broken Downside, then It Might Test the 5.8k Area.
BTW Rising Wedge is Bearish Pattern.(70/30)
In 8h Chart, Still Bulls trying to Clear the Important Resistance (6840-6960) but Bears Defending it.
Waiting for Strong Confirmations i.e RSI, MACD, Volume & EMA50 & 100!!
Please like the idea for Support & Subscribe for More ideas like this and share your ideas and charts in Comments Section..!!
Thanks for Your Love & Support..!

The other perspective and Dollar Cost AveragingHappy Sunday, here I give you another perspective that may support my previous bearish bias of bitcoin.
The key of this analysis is the high period of moving average which I use to identify whether there is a down trend or the uptrend which hold current major trend in the market. Here in this example, I use the 1000 moving average on the daily time frame.
The 1000 moving average can be used as the benchmark to identify the dynamic support or resistance. In this current structure, we've found that based on the historical performance of bitcoin, there are only 3 period of times that the price trended below this 1000 MA on daily chart. The first period was between January - October 2015, The second period was between November 2018 - April 2019 and the third period is now. I might say with current price structure, the 1000 MA is acting as a dynamic resistance and the fact that the price is coming closer to this line makes me expecting a potential rejection toward this resistance and make the price goes lower.
On the other hand, The fact that the price is now trending slightly below the 1000 moving average is once again becoming a good area of doing the dollar cost averaging for a long term investment. At this rate below this dynamic support, the price of bitcoin is becoming undervalue. But, this doesn't mean the price can't goes even lower, but doing the dollar cost averaging at this rate is less risky than if we wait for the price to breaks out of current resistance to confirm the uptrend.
So, for short term, I will bet that the price will go even lower. But, for longer term maybe for the next 2 - 5 years, this time is a great time to start your dollar cost averaging on bitcoin as part of your portfolio.

BITCOIN | Almost Ready for Big Move..!!BTC/USD (Update)
In 8h Chart, Bitcoin Has been Still Moving inside the Triangle & trying to Clear the Crucial Resistance Area ((6840-6960) .
So far Bears Looking Strong, Might Retest the Trendline. (6.5k)
Next Week, Bitcoin Will Decide the Direction (Make or Break it)
(Waiting for Weekly Close for More Clear Direction)
Please like the idea for Support & Subscribe for More ideas like this and share your ideas and charts in Comments Section..!!
Thanks for Your Love & Support..!

BITCOIN | Ascending Channel & EMA100 Resistance..!!BTC/USD (Update)
Bitcoin Has been Moving Inside the Ascending Channel & Facing EMA100 In 8h Chart.
Now There Are Two Possible Scenarios!!
1- If Bulls Lost the MA50 & Channel Broken down, then It Might Crash Hard towards 4.8k Support.
2- if Bulls Clear the EMA100, then It Might Test 8k Area. (Major Resistance)
Please like the idea for Support & subscribe for More ideas like this and share your ideas and charts in Comments Section..!!
Thanks for Your Love & Support..!

XBT Really Struggling to break Resistance Back to 5800???XBT has tried to break that key level of resistance multiple times now, the more times it is rejected the weaker it gets.
after a quick spike up to 7300 last night we still closed below that resistance level.
yesterday we broke the supply zone so you will see I have made the new supply zone which is at high 7's
at this stage in my opinion if we close above res we will be heading up to the 7800 mark
however over the next few days I will be keeping a close eye on this trendline. (the trend is your friend)
if it doesn't respect the trend then down we go to 5800.
Trend bias still bullish
over the weekend I will post some other bitmex pairs for you guys
4hr XBT

When to buy or sell bitcoin and gold using VIXAnalysis buy gold MTH close >$1,703.6. Buy bitcoin MTH close >$9,241.5 Sell gold MTH close <$1,547.67. Sell bitcoin MTH close <$4,000. Use VIX mark 1st MTH up & if gold & SPX red candles then mark low. For bitcoin use VIX mark 1st MTH up & if next MTH both bitcoin & SPX red candles then mark low. Then create custom strategies when to buy. NOT ADVICE. DYOR.

Bitcoin Vs Big Oil war games See my previous post how big oil pumps bitcoin. Now see how big bitcoin hodlers fight back and dump big oil. Caveat small sample. NOT ADVICE. DYOR

Big Oil pumping and dumping bitcoin - See MACDBitcoin & Big Oil. Best buy when MACD on Oil turns positive & bitcoin Rate Of Change positive. NOT ADVICE. DYOR.

Second BULLISH attempt out of the consolidation zone!simple chart on consolidation zones
Still up and down in this zone however looks like some bullish activity is happening as we try to get back up to that supply zone
Trend Bias is bullish
1hr chart
Don't forget to follow me guys

This won't happen - Depression crash (seriously it won't)Study of the 100 Weekly MA. Yellow verticals denote where 100 MA turned down. Blue verticals where price peaked once hit 100 MA. NOT ADVICE. DYOR.

Yet Another SOLID!! recovery out of the demand zone for XBT!!!An almost immediate bounce out of the supply zone yesterday
indicates buyers are still in control
No trade zone yet
waiting for more conformation.
Looks to me like this could be a temporary consolidation zone. before we head back up to supply
1hr chart XBTUSD
love to hear you thoughts guys. follow me for more Bitmex TA
linktr.ee/tennillewalsh

A Guide To The Fundamentals Of Support And Resistance TradingHere's my definitive guide on how to place your take profit, entry positions and stop loss orders when you are trading using support and resistance patterns. Many people have reached out to me asking to provide more details on where to place the orders exactly. In this guide I will share my experience, and show what I learned during my trading journey to be the most effective.
Again, this is my personal view and the way I personally trade. If you have another view on this, I encourage you to share it in the comments. The reason all of us are on Tradingview is to learn. A trader would be quickly out of the market, if they don't continuously keep learning. Please challenge my explanation, ask questions, and share your own vision. Without further ado, here is the explanation for each of the orders:
Take Profit.
Many people will be looking at the resistance areas. As soon as the price comes close to this area, it will find friction and will struggle to go higher. Make sure you place your take profit limit order directly below the area of resistance, to stay ahead of the curve. This will maximize the chances of your take profit to get hit, even when the price prematurely bounces off the resistance area.
Entry Position.
Similarly to the logic of the take profit, you would want to place the limit buy slightly above the horizontal support. The closer you get to this zone of support, the more bulls will start to fight back and try to push the price back up again.
Keep in mind, if you spot a support and resistance trade set-up, you don't necessarily have to immediately enter the trade. You can place a limit buy on the price where the pattern you spot would be validated.
Stop Loss.
Everything about a trade goes along with the assumption that the pattern you found is true. You should use a stop loss to make sure you exit the trade immediately after your pattern gets invalidated. For a support and resistance set up, this translates to the price breaking through the support.
Follow me for consistent high quality updates, with clear explanations and charts.
Please like this post to support me.
- Trading Guru
--------------------------------------------------------------
Disclaimer!
This post does not provide financial advice. It is for educational purposes only!
About the links below:
20% Discount on Binance: Did you know that Binance introduced a new system where you can get 20% discount on your fees? Find the step-by-step guide on how to add it to your account on the website of 100eyes
Forex & Crypto Scanner: Nobody can keep track of all the pairs on all timeframes. This scanner works on Telegram and sends an automated message including a chart every time something happens to a coin. E.g. it can automatically detect areas of support and resistance, RSI Divergences, Fib Retracements, and more.
Further reading on BTC:

BTC MARKET STRUCTURE AWARENESSIin this idea I just want you people to be more aware of market structure, too many shiny distractions of cool sounding things like VWAP, FIBS, etc, market structure is always the most important thing you should look at before anything else
