Bitcoin (Cryptocurrency)

Bitcoin Retraces But What About The Altcoins?We know many of you are really interested in the smaller altcoins...
The altcoins market continues to grow stronger and in bullish potential, here is what will happen next.
Now, before we get started, it is always necessary to make this small but very important distinction when we talk about Altcoins.
Conventional analysts here talk about Bitcoin and Altcoins.
When they say Altcoins they are mainly referring to the big ones, the TOP10: ETH, ADA, LTC, TRX, BCH, EOS, XRP, USDT, BNB, and XLM...
(Not necessary the TOP10 but those with the biggest market cap.)
When we/I/us mention Altcoins, we are always exclusively talking about ALL ALTCOINS minus the TOP10.
When it comes to market capitalization and the bullishness of the market, we have to separate these bigger altcoins from the smaller ones for two reasons:
1) These bigger altcoins move together with Bitcoin (Bitcoin is now dropping strong, these as well).
Normally, we tend to see altcoins detach (move inverse) to Bitcoin in a bullish cycle... Right now, you can see the Binance and Bittrex altcoins growing, as well as those on other exchanges.
2) They do not behave as the smaller alts.
So we can see the altcoins chart (TOTAL2) full bearish and going lower while "the Altcoins Market continues to Grow" .
Even with that said, they are still producing higher highs and higher lows, meaning that the entire market is now in full bullish mode.
What Happens To The Altcoins?
As I've said many times before, this is only the beginning.
Feel free to buy up on your favorite pairs.
Feel free to take your time to research, make your choice, buy and hold.
The cryptocurrency markets are very likely to grow for years to come.
This is Alan Masters...
Thanks a lot for your support.
Namaste.

Bitcoin is like the early internet"Bitcoin is like the early internet" we hear that sentence over and over.
The convenient thing is the internet and crypto, as we know them, both appeared the same year, in 1983.
So how about a simple side by side comparison?
* Note I have strongly overstated crypto adoption to make it visible.
As you can see, adoption wise, crypto is indeed like the early internet.
But the fact that is has been like the early internet for now almost 40 years, means crypto investors should not get their hopes up too much about it getting adopted.
Their best bet is that new buyers that think the price will go up show and buy their bags.
Not sure who will do that, now that the whole planet has heard about crypto & Bitcoin in particular.
Aliens maybe? Who knows.
I suggest creating a whole new type of crypto, call it etrash, and leave it there.
Would be the perfect end for this joke of a ride.
C'mon ... 40 years... Claiming claming crypto is as important as the internet or can ever be half as successful... Some people can't stop dreaming...
40 years and only use case has been being untraceable & buying drugs and kiddie porn. Crypto enthusiasts are nuts.
They should wake up from their dream and start doing something useful with their lives.

How to see where Bitcoin is heading and when to trade long/shortUsing a weekly log chart showing Bitcoin from when it was only 1 cent up to today's prices of around 9k. In regards to anything mentioned below wait for BTC to close twice above or below any level mentioned for full confirmation.
Indicated is each halving of BTC on the chart with the vertical red lines (close enough to date as can't do exact when using weekly chart). The upcoming halving date is estimated.
In regards to the date ranges showing bars/days in light purple, you can see with the halving in 2016 that the bull rally afterwards took longer than the previous time. The date ranges in dark purple showing bars/days is from one halving to the next halving which also took a longer time than previously.
The price ranges in yellow/orange show the price rise from one halving to the next.
The Gaussian Channel shows that when it turns green after being red, the price continues to rise until the next all time high.
The yellow rectangle box indicates where the EMA 10 has gone under the MA 21 on the weekly chart. With the 10 under the 21 and BTC trading under the 21 at the same time BTC is in a new bear cycle. You can see there is 1 bear cycle each halving except for this current yellow box BTC is in now, indicated where the ? is on the chart. BTC has not had 1 false breakout this halving, so this yellow box BTC is in currently could be a false breakout.
The flags show where there was a false breakout of the crossing of the 10 over/under 21.
When the EMA 10 is above the MA 21 and BTC doesn't trade under the MA 21 on weekly chart, BTC is in a bull cycle and prices continue to rise until the next all time high.
Hopefully you can see where BTC will go each week using these indications and trade accordingly.
Happy trading legends!
HTBB

BTCUSD 1D BIG THREE TRADING STRATEGY50sma determine trading bias.
Price below 50sma bearish bias.
Price above 50sma bullish bias.
Short Entry
Candle Close
1 - Red Colored Candle
2 - Price below 50sma
3 - B3 Subchart Red
Long Entry
Candle Close
1 - Green Colored Candle
2 - Price above 50sma
3 - B3 Subchart Green
Stop Loss on the opposite side of 50 sma
Take Profit you determine

Double ZigZag Elliott Wave 4hrDouble three is a sideways combination of two corrective patterns including zigzag, flat, and triangle. When two of these corrective patterns are combined together, we get a double three
Guidelines
• A combination of two corrective structures labelled as WXY
• Wave W and wave Y subdivision can be zigzag, flat, double three of smaller degree, or triple three of smaller degree
• Wave X can be any corrective structure
• WXY is a 7 swing structure

How to Read Pennant Price Action More AccuratelyWe're all here on TV for the same reason, to become better traders and to make money. I came across this tip not too long ago and found that it really helped me read the price action better within pennants, so I wanted to share it with the community.
Pennants form after a strong movement in price (either up or down) where the price bounces back in forth in a small area before it has to make a decision of where to go. The rule of thumb with pennants is they tend to break out in the same direction they were entered. This is often referred as a continuation pattern, where the price continues in the same direction it was heading. If the price was heading up, it will more likely than not break out to the upside and continue upward and vice versa. However,
I noticed many times pennants not following that rule and I paid the price for being complacent in my trade. That was when I got this tip from Francis Hunt (highly recommended analyst) and it has really helped in anticipating where the price action is headed.
Looking at WRX, notice how the price has strong spikes up in the price, followed by slow sell offs? This is bullish price action where the buyers are in control and it often leads to breakouts to the upside. I am merely using this price action as an example. WRX is a newly listed coin on Binance that did 9x in its first couple days on the exchange, so take this example more for the price action behavior than as evidence that it is going to explode to the upside.
Now look at the pennant I have to the right of that. It entered the pennant on a bullish breakout so the price should continue in the same direction right? Well take a look at the price action inside the pennant. Notice the difference in how the price is reacting? In this case, each time the price slowly rises and is met with a sharp fall. This is an indication that the sellers are in control and you should be cautious of a strong breakout to the downside.
I hope this tip helps you gauge your future trades into pennants more accurately. I have found that it has helped me dodge some sharp falls and take advantage of some big gains. I suggest you start searching the charts and analyzing the price action within those pennants to see if you notice this pattern as well. I hope it serves you as well as it has served me.

19.2.2020 - Bitcoin (BTC / USD)Hi Traders!
Today we look at a bit specific bitcoin analysis. It will be about bitcoin but on CME futures exchange. Have you heard of CME gaps?
Many people are starting to talk about CME gaps. How do these gaps actually come to existence? There are two options:
CME doesn't trade futures over the weekend and is off. However, crypto exchanges normally work at weekends, so the first way is that there is a strong movement at the weekend and we open Monday at a totally different value than we closed on Friday.
The second way is that bitcoin simply has such a strong up/down movement that it flies through the order book and creates a GAP.
GAP acts as a magnet on the graph. Many people know about this, but they don't know the logic behind it. In the first case (the weekend), there will be many unfulfilled orders at that point. After a strong movement, the graph later gets tired and still comes after these orders. Of course, this does not work 100%, but in the vast majority of cases, it does.
We currently have a GAP blank at a level of $ 8,500. It's extremely difficult to determine whether this gap is filled or not. There came a wick, but exactly to the edge. If the GAP is not completed in a given week, it will usually only be completed after a certain cycle has been completed. Will it be so?
May the crypto be with you!

BTCUSD 1D THE BEST GANN FAN TRADING STRATEGY(Rules for BUY Trade)
Step #1: Pick a significant High, Draw Gann Fan Angles and Wait For the 1/1 Line to Break to the Upside.
The best Gann fan trading strategy works the same on every time frame. But we recommend not going lower than the 1h chart, as you want to be able to pick significant swing high points. This can’t be seen on the lower time frames.
Step #2: Wait for a Break Above 2/1 Gann angle Before Buying at the market
This step is significantly important because a reversal of the previous trend is only confirmed once the 2/1 Gann angle is broken to the upside. You want to buy at the market as soon as we break above 1/1 line.
Step #3: Apply again the Gann Fan Indicator on the Swing low Prior to the Breakout above 2/1 Gann Fan Angle
How to use the Gann fan indicator? Simply follow the instruction presented in the above sections. At this point, you can also get rid of the previous Gann fan angles drawn from the swing high. This will make sure your chart will not get cluttered and the price is still visible.
One of the reasons why this is the best Gann fan strategy is because we use the Gann fan indicator to track every swing in the market.
At this point, your trade is opened, but we still need to determine where to place our protective stop loss and take profit orders, which brings us to the next step of best Gann fan trading strategy.
Step #4: Place Your Protective Stop Loss below the Most Recent Swing Low Which Should Align With the Point from Where You Draw the Second Set of Gann Fan Angles.
The best Gann fan strategy has a very clear level where we should place our protective stop-loss order which is right below the swing low located prior to the 1/2 Gann angle breakout.
Next, will learn where to take profits:
Step #5: Take Profit One we Break and Close Below the 1/1 line. We Need the Close Below 1/1 line to be by at Least 20 Pips to Consider it a Valid Breakout
We want to ride the new trend for as long as possible and with the help of the Gann fan indicator, we can pinpoint the ideal time to take profits. We take profit at the earliest symptom of market weakness which is a break below the 1/1 line that signals a possible start of a bearish move.
Note** The above was an example of a buy trade using the best Gann fan strategy. Use the same rules – but in reverse – for a sell trade.

Bitcoin head and shoulders and how to trade themwanted to post this because I see so many people commenting on and trading these patterns "incorrectly."
I put incorrectly in quotes bc I acknowledge that it's subjective. This is ideal from a risk/reward standpoint. Whether one is right or wrong really doesn't mean that much in trading if you make a lot more money when you are right than when you are wrong (or vice versa).
The most important thing is risk/capital management and what chart patterns are good for is identifying levels of maximum profitability. I was influenced to make this post from a recent comment of Peter Brandt on twitter which seemed to confuse people but he is absolutely correct. His comment was
"I have made my living since 1975 trading futures markets using charts
My conclusion on chart trading:
1. Charts do NOT predict prices
2. Most chart patterns fail
3. Charts simply tell us where a market
has been
4. The only value in charts is for trade/risk management"

Psychology in trading. Manipulation of consciousness Bitcoin 666Bitcoin's main trend is upward. Which formed the ascending channel .
Always trade with the trend. Decide in which trend you are trading and on which timeframe. Decide on strategy and risk management.
Your first enemy is a lack of experience and knowledge. Your second enemy is greed and a sense of lost profits.
You always have time to make money, the market will not run away from you, but money in the absence of experience and knowledge will run away.
On a bull trend it is better to always work on the bull side; on a bearish trend , on a bearish side. Always follow the trend! Going against the trend is the same thing that falls under the locomotive and hoping that it will not overeat you, but will bounce off of you!
There should be a strategy and plan. At the same time, your strategy and plan should be plastic from market situations.
You need to not only know the rules of technical analysis , but also understand what and how and why it works.
Knowledge of technical analysis and the psychology of the crowd will make you in trading - God.
If you are like everyone else, then the result will be like everyone else.
Those people who rely on quick profits without effort and time are doomed to give their modest deposit more smart and hardworking. For the minority to earn money, the majority need to lose money in the market. The more the majority plays according to the rules imposed by the minority, the more money is lost. Consequently, a minority earns. To earn, you need someone to lose! When a minority needs it, the rules of technical analysis stop working. The faith of the majority imposed by the minority destroys the mountains and minor minority deposits.
In the game against the crowd, only time decides the question of when the average zeroing of the deposit in the average person will occur.
Those traders who are sure that success depends on only one successful purchase, retention of the asset for a short time, and then sales are many times more expensive - are doomed to zero the deposit. This is what the majority think, which means that this is an erroneous opinion. Thanks to this majority faith, the minority earns. Trading is not only work - it is creativity and relaxation!
Remember, trading is a game of probabilities . Who trades from the situation created in the market - earns.
Who trades on the basis of what he wants - receives a loss.
The crowd trades out of their desires, not market probabilities. The crowd always loses.
Thanks to the thinking and desires of the crowd, we earn.
There are no accidents, there are random patterns that must be understood and used.
Coincidences are planned actions disguised as randomness.
369-27-669-27
3075-1170-1666-444-27-01-20
310-130-23-13-06-02-2020-13
371-27-671-27
Money is not the meaning of life, but a tool for life!!!
Appreciate the time of your life in this world - this is really a limited resource . Time will pass, life will go.
Have you been born in this world for a cut paper of money that you will never have in your desired quantity? Think it over.
Also think about patterns.
Why is it that everyone who wants to have a lot of money remains very poor. And the opposite is true - who does not pursue the amount of money, but does good deeds, receives fantastic amounts in a short time that the “supplicant” and “wait for money” will never receive for all their wretched existence. How to give such is not safe. The crowd with their desires is crazy and selfish. To give to such is tantamount to destroying them. The world is honest. Who creates - he receives.
Most want to receive - but do not give anything in return. This is the secret of poverty.
Understand the world, understand yourself - life will become meaningful, understandable and easy.

Debate 'Safe Heaven' Bitcoins- Skyrocket Coronavirus nCoVid2019Hello my dear traders and friends,
As you can see the Bitcoins chart, the value has skyrocket in 2 months after the first major outbreak pandemic coronavirus on January 2020. People start to buy the bitcoins and the value increase towards the sentiment.
They thinking this bitcoins will be the safe heaven towards this pandemic. For the reason, if you move towards to other countries you can sell it online anytime.
This is their perspective which cause this element to bullish. For most people, they tend to see bitcoins can be really the safe heaven money.
In my opinions, the bitcoins is just only worth the credit and it against the fiat currencies towards the major Dollar. While Dollar also has decreased its value as what we can see the central bank trying to adjust so many times the interest rate and clearly they do not know what their doing.
It is a bitcoins that digital currencies which the value that something you do not own. It is just a value and with not many countries accepting the change towards the bitcoins currency. For the I put it bitcoins is a new currencies which we do not own physically but it is still a fiat currency that non-physical.
I just want to records this as my journal and put my ideas towards this currencies. Yes of course I do trade bitcoins but to the somepoint which I do not agree where this digital currencies is be in the sentiment that people look as describe the 'safe heaven' currencies. As what like we saw on the historical and let the history of the Dollar speak for itself.
For the past of bitcoins history, BTC also has got some major crash long time ago and this also happen on the fiat currencies as well.
WIll people purchase the BTC as long this pandemic coronavirus in the background ? Or is it just a sentiment only ? Will Bitcoins drop when all the sentiment towards the virus disappear?
As what I can conclude, this is just a trend. When the trend is over, people will less demand towards it. The price will drop and more event in the future caused it to be skyrocket as well. It is just a pattern.
By Zezu Zaza

Bitcoin : sweet spotHello all, here we start the chart work on bitcoin again. On this technical analysis, I will cover the movement of the bitcoin on smaller degree, we use the 4 hours time frame to analyse this movement for bitcoin. Let's get start!
Just like what I've wrote on the title of this analysis, I call the blue areas 'sweet spot'. Just like what you've seen on the chart, since the January 10th, the price has consistently bounced of this blue regions as well. This blue region is the previous broken resistance that become a support in the upcoming moves. However, if you use this break out strategy, since in the beginning of the January, you'll get a tremendous amount of profit.
And in the last period of price action, the price has already tested the previous broken resistance that becomes a support as well and it bounced! will this be another sign to forms an upward movement? if yes, the next target will be on the white zone which I've anticipated on my previous post.

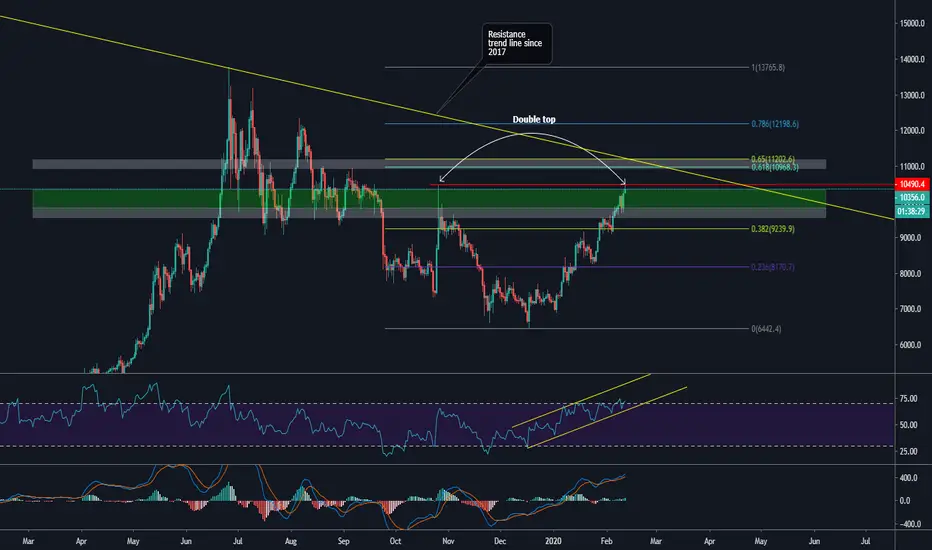
Bitcoin update : Crucial levels and where to head nextHello all, it's been a very bullish pressure for bitcoin and current crypto market and therefore, In this technical analysis I will cover about bitcoin based on the daily time frame. Let's get it started.
Bitcoin is currently trending at around the green region which I've acknowledged before as a liquidation zone of current movement. But, with latest movement to the upside, this liquidation zone could means nothing if the price continue its bullish momentum to the upside. And therefore, we must anticipate the next potential resistance for bitcoin to head of.
First minor level which I want to anticipate is at current region which is the red line and area around the $10500 region as a double top region comparing to previous swing high. I make this as the minor support because at the previous action of bitcoin which around October 26th, 2019. The price was heavily rejected when it touched this area. Will it forms the same price action as this past historical action? We don't know it yet.
The second crucial level that I want to cover is the resistance around $10900 - $11200 region. It will be very ignorant for me to not anticipate this area of resistance because it has the alignment with a lot of factors of current price formation. It's moving align with the golden pocket, heavy price action and the most important thing is the resistance trend line that has been established since 2017.
The RSI is forming a higher high and higher low consistently since the bottom of November 23rd, 2019 . And it's now the first time that it enters the overbought region since 2019.
This is going to be a very important period for bitcoin and just to be honest with you that at current degree and current level, I really don't feel comfortable if the price pushes to the higher level of price again. There are a lot of reasons that make this market very manipulative.

Ethereum : Major resistance and liquidation zoneHello all, this will be a quick update analysis about Ethereum. Let's get it started!
Red zone is the liquidation zone
White zone is the resistance area
The price however is in its decent parabolic bull run since December 2019. And since the parabolic bull run, we haven't seen any significant corrective pattern. This time could be different for ethereum. The reason why I believe there will be a significant correction is based on these 3 factors :
1. Although the price has already broken out of the white resistance trend line, it's now testing the liquidation zone as it has a confluence with the white trend line and the .382 fibs level as a major resistance. White trend line is the previous broken support that is now become resistance as well.
2. The MACD histogram has a potential of ticking down on daily time frame. This will indicate that the bulls is losing strength
3. Looking at the green zone, it's beautifully aligning with the yellow line which is the previous broken resistance that is now become support. Since the price has broken out of this yellow line as resistance, we haven't seen any retest toward this line as a support to confirm the phase 2 of my break out strategy.
We might see a correction in the upcoming days. The additional reasons why I believe that there is now a shifting period from bulls to bears is that bitcoin potentially will have its major correction to the downside.
