Father of all strategiesHello traders!
This is a detailed and most importantly a correct analysis of the previous pump and dump.
There is always a reason behind everything and there is also a reason behind this whole formation. There is a complete cycle that forms before this formation and this formation is a reaction of that cycle.
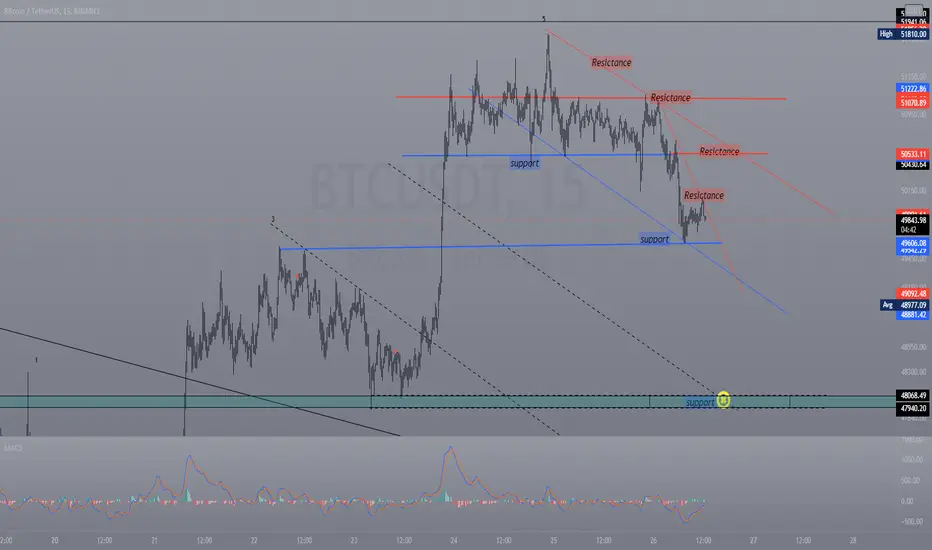
Let's talk about this formation
After a deep search, I have figured out that the market never leaves any Support/Resistance untested and if it happens then we will see this type of formation and when the formation is completed we will see the market will move back to that untested Support/Resistance.
(Tip 1: You can trade every breakout but on the opposite side of breakout because the market always show retracement after the breakout)
At the start of this Formation the time the first pattern we see is a 'J' pattern.
Now, what is the J pattern?
'J' pattern is itself a reversal pattern only if it is formed above the support area but in this case, 'J' pattern is not connected with the support area so it kept pushing up.
The Next pattern after J is a correction/consolidation pattern and in total, we will see 3 consolidation/correction patterns in this formation.
(Tip 2: After every breakout there is a reaction pattern and 5 out of six times market moves back after a breakout so follow tip#1)
After the 'J' pattern the second pattern is an Expanding triangle and if you are aware of this pattern then I must tell you that you were always taught wrong because you must be taught that trade towards the direction of the breakout and it's a wrong way. As I told you 5 out 6 times market moves back after breakout and you can see the charts yourself. So trying your luck on 5 out of 6 probability is better than trying your luck on 1 out of 6 probability.
(Tip # 3 is don't be fooled and follow tip # 1 and always use stop-loss to save yourself from unwanted loss and save your account for new trades)
The third and final pattern is a correction breakout without any reaction pattern and this is a pattern that pushed the Bitcoin back to the pavilion.
Happy new year guys and I hope you will make millions in the year 2022.
Don't forget to hit the like button and follow to stay connected.
Bitcoin (Cryptocurrency)

Lesson in trade setups. take it or leave itTrading is difficult. it takes patience. the key to a successful trade is planning.
in this chart we do away with diagonal trend lines . all we are looking at is the horizontal support and resistances.
to keep trading simple you have a thesis, stick to it and execute on it. you breakout from either support or resistance that will be your signal to begin to watch the charts for your trade to develop. you need to have the patience to wait for a retest and bounce off the horizontal line and the price to break past the retest pivot
waiting for your thesis to play out and always using stop losses in this case right below the support/resistance lines that the price broke from will keep your stack safe and your losses small.
in turn (not shown on this chart) you can also take the short and long trades based on price tagging the support (short) or resistance(long) lines.
good luck trading
ELM Trading Group

Lessons for the year and into 2022Over the last year I have spent a lot of time on @TradingView writing up educational content, I have tried to apply drawings to my charts to express some lessons in simple yet easy to follow and understand walkthroughs.
Here's a chronology regardless of your experience and level.
Let's start with Psychology - this is the life and soul of the market, if humans where not so predictable then we would have a completely different looking chart. Humans spot patterns - even when they are not there. We try and assume, we get greedy, fearful and often just outright stupid. Entering trades at wrong times, listening to fake guru's and not doing the work ourselves. When you understand the emotional aspect of trading, your already 50% of the way to becoming a successful trader!
In this post (click the images for each individual post) - you will see how the basic emotions work at various aspects of the chart.
In a more simplistic form I broke the market phases down in relation to the post above, this time using the Simpsons as the best way to let traders relate to such phases;
Homer is brilliant!
Again - once you understand some of the basic psychology you can start to create a framework around investing, it will help build a plan. In this next post I wrote about the reasons why people get into crypto - the thrill of the ride, the desire to make it.
Once you got a feel for what it is your looking to do and you are wanting to play in the crypto sphere - here's a post that will help you on assessing an alt coin, the process of going through your own due diligence rather than listening to a youtube guru. A lot of what you need to know when searching for the next big thing, is already written in the business itself - this will include everything from the founders, the plan, money raised and so on.
Ok so let's step over to some of the technical aspects of trading;
Here's a post on the simple trendline - for you experienced traders jump this and the next Moving average post.
From trendlines to Moving Averages;
These kinds of tools coupled with some basic off the shelf indicators will get you going on your your journey - but you have to remember over 70% of retail traders lose money. There's even an industry quote that states 90% of new traders lose 90% of their account in 90 days. When everyone is using the same Moving averages, MACD and RSI - all it does is lends itself to the type of emotional analysis mentioned in the psychology section. So trade carefully.
ALWAYS deploy proper risk management and do your own due diligence.
Here's the basic on using the MACD if you do want to use it along with the 50 and 200 Moving Averages ;-)
All new traders want to buy the dip! But how; well here's a little advice on that too.
This is where it get's interesting;
Going back over 100 years there was a cluster of hyper intelligent traders, these techniques are still widely used today and just as relevant in crypto as they where for commodities and stocks when they where first introduced.
Here's the introduction;
Personally I feel these guys where not technical analysts but emotional analysts - they understood various aspects of why the charts do what they do, why the human mindset drives the target levels, the patterns are created and so on.
From here we can cover the technical viewpoint;
Here is an intro to Dow theory...
Elliott waves;
And even Wyckoff;
It was this post that many of you know me for - this was the method used in March to call the incoming top for Bitcoins first major move down.
However, the greatest tool of all for doing any kind of Technical Analysis is likely to be Fibonacci;
A very old technique and amazing to see the levels get tagged each step of the way, this can be applied to various other strategies and techniques.
The whole crypto space is filled with rubbish advice, scams and people claiming to make money. The truth is, like every other trading instrument - it's a dog eat dog world and you need to be able to take care of yourself. I wrote this article explaining why common sense is not that common anymore - logic seems to go out of the window when it comes to crypto. So please keep a level head.
Life ain't linear - Yes this is a drawing; took AGES!!!
I've tried to cover as much useful info for the @TradingView community as possible throughout the year. Here's another couple of posts that you might find interesting;
Do you know what is going on, inside the candle?
Chart patterns?
Even covered the art of the Pivot Point.
What don't you know about dark pools?
Or the difference in Volume profiles?
Or even if your interested in making your own indicators?
And to finish with on the technical side- Here's a couple of good books to get you going into 2022!
If you haven't followed me throughout the year and seeing this for the first time - here's every swing & supporting logic for the Bitcoin move throughout the year.
And to finish with NFT's and the METAVERSE.
and this one;
Hope you have had a great 2021! 2022 will be even better! Have a great NEW YEAR's eve and see you on the other side!!!
Feel free to give me a follow here and comments always welcome!
Disclaimer
This idea does not constitute as financial advice. It is for educational purposes only, our principle trader has over 20 years’ experience in stocks, ETF’s, and Forex. Hence each trade setup might have different hold times, entry or exit conditions, and will vary from the post/idea shared here. You can use the information from this post to make your own trading plan for the instrument discussed. Trading carries a risk; a high percentage of retail traders lose money. Please keep this in mind when entering any trade. Stay safe.

the way of market when u can tell were is the force goinghey guys when I start publishing market lessens I consider 3 possibilities for the btc/usdt u can also predict market as well sometimes its obvious but you but position open therfore greed comes to you in dec25th I know tat market have no way but go down so I sold all my perpetual contact's.
remember experience in right direction can give you vision

Trend line and price action at Support and Resistance According to the chart, we see how the classic lines of resistance and support and trend lines work well. Anyone who wants to open a trade can benefit with the simplest lines.
Retracement MappingHello friends,
What do you think of when you hear the phrase “Past makes future "?
My way:
Retracement mapping: any prescribed way of assigning to each domain in one set (initial domain), in another set (future domain)
In other word, retracement mapping (Geometric mapping or map-to- map transformation)
is a method to perform some operations on a retracement domain, in order to get a future retracement domain or to extract some useful information from it (output may be features associated with that retracement).
linear mapping:
To apply the retracement mapping method to a domain, the initial domain (retracement) is converted to Pitchfork in which each high (or low) entry, corresponds to the high (or low) at the future time.
Validation:
Case 1: Comparing the result of the presented method against actual data (2019 to 2020) revealed excellent agreement with them.
Case 2: Comparing the result of the presented method against actual data (2019 to 2021) revealed excellent agreement with them, this shows a small margin of error in the calculation.
Non-linear mapping:
This allows the coordinate(s) to be multiplied by a Non-linear transformation.
This is easier said than done!

Futures Trading & Terminology ExplainedTrading futures is not for beginners and should only be attempted by experienced traders with a strong understanding of the market as a whole and especially a strong understanding of Risk Management & Trading Psychology.
Below I have explained some of the Risks involved in Trading Futures:
-------------------------
Liquidation
When liquidation occurs your position is forcibly closed due to not having sufficient balance to keep your borrowed positions afloat. When trading futures on high leverage, your losses can quickly reach double digit percentages and if they exceed the remaining balance in your account you can be liquidated.
-------------------------
Leverage
Leverage, or to be leverage refers to the act of borrowing money off the exchange to trade. When a trader has insufficient balances to cover their leveraged position left in the account a liquidation call can occur. Keep track of your margin ratio and keep it low to prevent liquidations, and use risk management techniques.
-------------------------
Volatility
Market volatility can be high in emerging markets, and many traders love volatility for its big swings to profit, but in futures trading considering losses are potentially heightened by leverage volatility can become a dangerous thing to a trader. In volatile markets market stop losses can often trigger much further than the triggered price adding to losses, or even resulting in liquidation.
-------------------------
Stop Hunting
Stop hunting occurs when large entities such as corporations, or “Whales” purposefully target the stop loss orders of traders, knowing that at these areas when a large amount of orders is triggered a contrarian position can be acquired by these entities by buying or selling into a large stop trigger event, by doing this they can easily buy or sell a large amount of an asset when also having very little affect on the price in the short term.
-------------------------
Exchange Downtime
During extreme market movements sometimes exchanges can crash and traders are unable to login, close or open positions on the exchange, Liquidation events, Market Crashes, Manipulation, Volatility, Stop Hunting may all come into play when Exchange Downtime occurs and it is a risky endeavor to be positioned in borrowed money when a exchange is offline.
-------------------------
Market Crashes
Market Crashes, Black Swan Events etc. can occur frequently in emerging markets, infrequently in traditional markets. During Market Crashes huge cascades of liquidations can occur taking out over leveraged long traders.
-------------------------
Manipulation
Stop Hunting is also a form of Market Manipulation. Sometimes vested interests work together to hold down the price of an asset or push up the price to trigger orders, and shake out retail players.
-------------------------
Overtrading
Due to the heightened losses applicable from borrowed money, overtrading on futures/leverage can quickly wipe out your balance, it is key that you understand how to size your trades correctly as well as managing your risk and mental state to avoid this occurring.

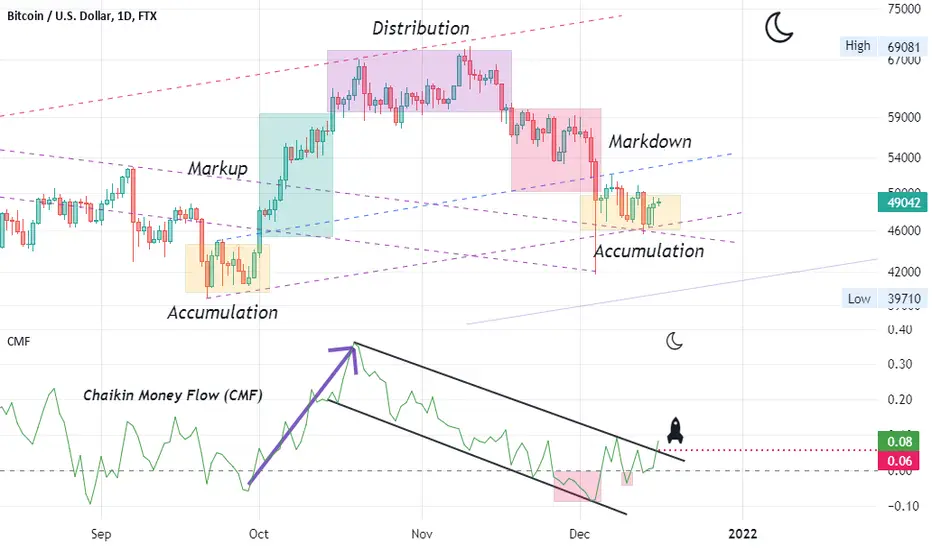
Accumulation and Distribution (based on CMF)
Hello friends:
It's the result of my efforts to offer a simple (using Graphical idea) presentation.
Concepts, I know you know ;)
Bullish: When demand is greater than supply, the price goes up
sideways: When demand is equal to supply, the price goes sideways
Bearish: When supply is greater than demand, the price goes up down
Chaikin Money Flow (CMF)
The main advantage of the CMF is that this indicator can assess the buying pressure vs the selling pressure.
1- Smart money is accumulating = increase CMF volume + candle closes near the top of its price
2- Distribution = decrease CMF volume + candle closes near the bottom of its price
Question: How is The Chaikin Money Flow Calculated ?
answer: it's not important (a bit complex!)
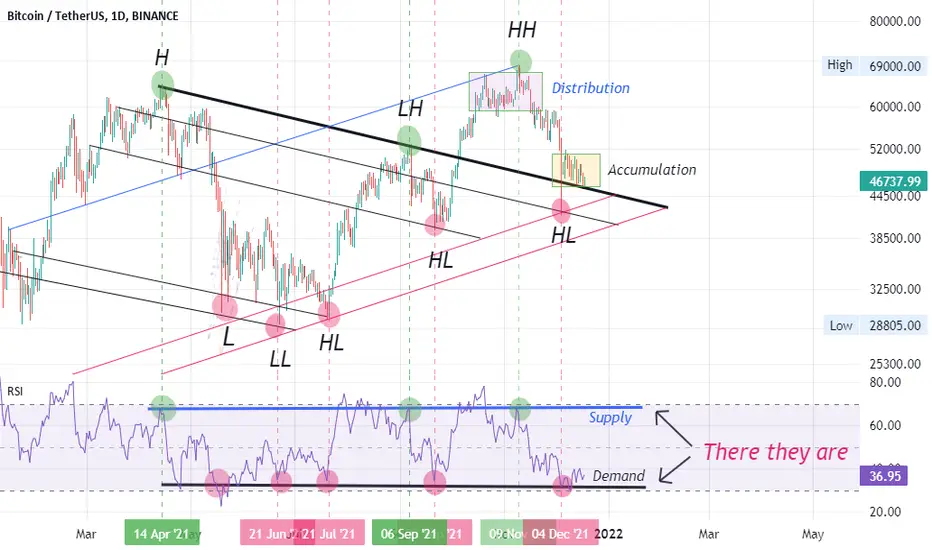
Accumulation & Distribution (Part 2- There they are)Hello friend,
What do you think of when you hear the phrase "Bitcoin Whales"?
Who Are Bitcoin Whales?
1- Institutions: money centre banks, hedge funds, Grayscale, Tesla ...
2- Exchanges: (6.7% of Bitcoin in circulation was held on exchange wallets),
3- Individuals: Elon Musk (also a Dogecoin Whale),..
4- Satoshi Nakamoto: first 1.8 million or so BTC first created, have never been spent.
How Do They Trade?
Let's start with the buy range, also known as the Demand zone.
Demand Zone:
1- When they are buying, they put their whole order (into the market) at once (strong price move- Pump)
2- They buy increments within a specified price range (Accumulation). (because the buying pressure would send the price sharply higher)
Supply Zone:
3- When they are selling their position, they put their whole order (into the market) at once (strong price move- Dump)
4- They sell over a period of time (Distribution).
Market Saturation :
Where selling and buying are out of balance (after Accumulation or Distribution)
5- Accumulation Zone- price goes up
6- Distribution Zone- price goes down
See attached Idea (Part 1).
reference:
twitter.com
🌊 ELLIOTT WAVES CHEAT SHEET 🌊10 Rules to 🏄♂️ them all! Hello, You may have never heard of Elliott Wave Theory before! Here is a cheat sheet for Elliott Waves for top 10 Rules, so you can master them all! print this out and keep on your desk.
How do you read Elliott waves?
The Elliott Wave Theory is interpreted as follows: Five waves move in the direction of the main trend, followed by three waves in a correction (totaling a 5-3 move). This 5-3 move then becomes two subdivisions of the next higher wave move (fractal).
The Elliott wave principle is a form of technical analysis that finance traders use to analyze financial market cycles and forecast market trends by identifying extremes in investor psychology, highs and lows in prices, and other collective factors. Ralph Nelson Elliott (1871–1948), a professional accountant, discovered the underlying social principles and developed the analytical tools in the 1930s. He proposed that market prices unfold in specific patterns, which practitioners today call Elliott waves , or simply waves. Elliott published his theory of market behavior in the book The Wave Principle in 1938, summarized it in a series of articles in Financial World magazine in 1939, and covered it most comprehensively in his final major work, Nature's Laws: The Secret of the Universe in 1946. Elliott stated that "because man is subject to rhythmical procedure, calculations having to do with his activities can be projected far into the future with a justification and certainty heretofore unattainable." The empirical validity of the Elliott wave principle remains the subject of debate.
OpenSea version in signature below

Bitcoin's Market Cycle Explained Through Elliott WavesThis is an educational post on Elliott Impulse Wave structures, and how the theory can be applied to Bitcoin's chart, in order for us to identify the overall market trend.
Disclaimer: This is not investment advice. This is for educational and entertainment purposes only. I am not responsible for the profits or loss generated from your investments. Trade and invest at your own risk.
Basic Elliott Wave Structure
- 80% of the time, an Elliott Impulse Wave would have a structure as the diagram demonstrated above.
- After the first impulse wave, we have wave 2, which is a short term corrective wave, play out.
- Most of the time, the second wave demonstrates a zig zag pattern, in which we can count ABC waves.
- When the second wave is a zigzag, there's a high probability that the fourth wave demonstrates a complex correction, such as a double three (WXY), or a triple three (WXYXZ).
- Also, when the second wave is a zig zag pattern, there's a high probability that the length of the third wave is 1.618x of the first wave's length.
- In this case, there's also a high probability that the length of the fifth wave is equal to that of the first wave.
- Keep in mind that these are all probabilities. There are no rules set in stone that state that waves have to move a certain way, in a certain length, but they tend to demonstrate this structure under certain conditions
Bitcoin's Elliott Wave Structure
- However, as you can notice from Bitcoin's Elliott Wave count chart above, Bitcoin's second wave did not demonstrate a zig zag pattern.
- Instead, Bitcoin demonstrated a triple three (WXYXZ) leading to a sharp final drop caused by the Covid outbreak.
- When the second wave demonstrates a triple three pattern, there's a high probability that the fourth wave demonstrates a zig zag pattern.
- Also, when the second wave is a complex correction, there's a high probability that the third wave's length is 2.618x of the first wave's length.
- Additionally, when the second wave is a complex correction, there's a high probability that the final wave's length is 1.618x of the first wave's length.
Bitcoin Weekly Chart Elliott Wave Analysis
- Taking into consideration the Elliott Wave structures explained above, we can now see that Bitcoin's trend can be explained by the second diagram.
- We saw a complex correction (triple three, WXYXZ) pattern on Bitcoin's second wave.
- We're currently completing wave 4, which seems to be a running flat pattern (ABC).
- While this isn't exactly a zig zag pattern, it's a variation of the zig zag pattern, and part of the larger concept of simple corrections.
- For a more in-depth explanation on this corrective trend for the short term, make sure to check out my previous analysis by clicking the chart below:
Revealing My Secret Method: Technical Symmetry Analysis
Summary
I believe that there's an extremely high probability that Bitcoin's bull run isn't over. While December's price action may be rather disappointing, as we're in the process of completing the final corrective wave within a bigger impulse trend, we could expect a parabolic rally as we move towards Q1 of 2022. Using Elliott Waves isn't about accurately predicting the exact price and period of an asset's price action. While a lot of people try to correct each other on "wrong counts", unless the general rules are kept, there really isn't a strictly correct way or incorrect way of using this theory as a tool. In my opinion, Elliott Waves are best used on longer time frames, to identify the overall trend, and which point of the market cycle we are at.

The dominance of stablecoins as a divergence tool in BTCOn the top chart we have the BTC/USD index, and on the bottom chart we have the sum of the dominance of the main stablescoins: USDT, USDC, DAI and UST.
As a rule, when the dominance of stablecoins rises, the price of BTC falls.
Just look at the respective numbered arrows. The only exception was arrow number 3, which had a more lateral movement in the dollar's dominance.
Now looking at this exact moment, we have a rise in stablecoin dominance.
The next resistance is at 7.75% (if dominance continues to rise).

Everything started with Maradona's deathJust found this interesting to share with you. Golden fibs are calculated by multiplying (1+√5)/2 by the previous golden fib. the rest are calculated by multiplying 1.145,1.236 and 1.382 by the previous golden fib.
PS: maybe it's wasn't Maradona but nearing an ATH :)

Butterfly Effect
Hello friends,
When overconfident, traders tend to take very bullish (or bearish) positions in the futures markets. A slight variation in the spot market could have triggered several liquidation orders.
This, in turn, causes a sort of butterfly effect in which more people start selling to get out of their positions, which triggers even more liquidations.
Crypto VizArt, an on-chain Data Analyst at CryptoQuant shared explains:
The volume of Long Liquidation in less than 1 hour can confirm that this price fluctuation was majorly Futures Market-driven.
Reference: cryptopotato . c o m
see attached Idea (Technical Analysis Section)

MARKET STRUCTURE 🗒🗒🗒I am not the best painter, but i tried to show you the difference between the structure that we have in every market. And it doesnt depend if its crypto/stocks or forex everything is the same in terms of structure.
Trade in the direction of the HTF MARKET STRUCTURE.
Do you want more examples like that ? Comment below ..

MARKET FALLS DEFINTION 📉📉📉During those times i would like to inform my community about market falls and when we can consider a market crash or a correction.
Comment below if it was a valuable information for you !

The rule you should never forget! About a week ago bitcoin suddenly started to drop and falling more and more unexpectedly While everyone was talking about 98K. Now everyone is talking about 52. Most of people are waiting to buy at 52 and lots of traders are selling bitcoin so they take profit at 52. But there's a rule you shoul never forget. When most of people thinking about an ultimate target it will be never hit. That's it! Most of people were waiting for bitcoin to hit 100K but it started to drop from 64K then they were waiting for 13K bitcoin but bitcoin started to rise up from 30K. Now people think the reversal point will be 52_53 and i did too But when i noticed everyone is thinking like me i doubted it. The logic behind this rule is a bit complicated and takes much time to explain but anyway it works well.

How to catch the TOP : BitcoinRSI Divergence (Bearish): When the price goes high but the RSI goes lower
RSI Divergence (Bullish): When the price goes lower but the RSI goes higher
These can indicate a shift in momentum in the underlying market.
Using the RSI divergence is a great tool to help you find when the price is getting ready for a correction. Keep an eye on bearish RSI divergences on the Bitcoin chart to help you find when a correction will talk place. Conversely, an RSI bullish divergence will indicate potential buying positions.
We are using the Daily time frame to search for RSI divergence on Bitcoin for a major shift in momentum. These can be found on all time frames, the larger time frames the more dramatic the move will potentially be.
Trading View also has an indicator that will find these divergences automatically for your for assistance. "Divergence Indicator" in the built-in indicators.

BITCOIN DOMINANCE EXPLAINEDTo be successful in crypto you need to know how the market works and why it’s behaving like it is.
Bitcoin is the first ever cryptocurrency and will be the biggest a long time. This means that what bitcoin does will have a large impact on the market. But there are also times where every coin does it’s own thing.
Here is where Btc.d comes in.
Simply put, when bitcoin dominance is high, it means that almost every move is similar in the whole market. While when it’s low, we don’t need to worry too much about what bitcoin is doing if we see a good trade in some other coin.
We can take advantage of this!
Btc.d is surprisingly accurate with technical analysis. In the chart you can see two boxes where I would either buy bitcoin or altcoins.
You still have to find good setups and everything, but it gives a good indication of it’s either altcoins or bitcoins time to shine!
Good luck traders! Leave a like if you found this helpful <3

🧐🧐SEE THIS BEFORE SELLING BITCOIN🤯🤯Hi Trading view Family, Theres lot of noise on social media regarding selling bitcoin, But we should see this scenario before selling bitcoin.On dailt TF we can see a trendline with fib retracement, And till now it is retraceing 0.382 level with 20 EMA support. Along that we also can have testing of 0.5,0.618 level on fibonacci retracement. And high chance is that it can take support from one of these 3 levels and continues its uptrend. So take actions carefully
Date of Analysis:-16 November 2021

HOW TO TRADE A TRENDLINE SUCCESSFULLY USING MARKET STRUCTUREThis video entails the two major ways to trade a trendline. The major ways are trend continuation and trend reversal. This video explained the basic approach to trading trendlines. There are more advanced approach you can use with trading trendline which confluence trading. Confluence means backing up your analysis with another technical analysis tool. Example; using trendline plus moving average for trade analysis. We will talk on Trendline confluence trade in future video. Thank you for watching.

FIBONACCI TOOL common reversal levels📊
❗️Fibonacci levels are one of the most popular tools for analysis. These are price levels that are located in certain parts of the movement corresponding to the mathematical Fibonacci numbers.
🟢What are Fibonacci numbers?
In the XIII century, the famous scientist Leonardo of Pisa lived in the Republic of Pisa – the first major medieval mathematician in Europe. On the cover of one of his most famous works was attributed filius Bonacci (son of Bonacci). Hence the nickname Fibonacci.
The Fibonacci numbers are a sequence of numbers derived from Leonardo's experiment on rabbits. The Pisan mathematician decided to find out how many pairs of rabbits will be in a fenced pen a year after the start of breeding (provided that there will be only one pair in the pen in the first month). In the third month, the cuts began to multiply recurrently – each subsequent number was equal to the sum of the previous two (1, 2, 3, 5, 8, 13, etc.).
If any number from the sequence is divided by the previous one, you get a number tending to 1.61803398875… This number is the "golden ratio". In algebra, such a number is called the Greek letter phi. When dividing any number from the sequence by the following, the inverse of phi 0.618 is obtained. When dividing any number from the sequence by the number following one, 0.382 is obtained. In this form, Fibonacci numbers are much more familiar to traders.
🔴Correction levels
Correction (retracement) - movement against an existing trend. The correction "absorbs" part of the trend movement. Of the Fibonacci numbers, 38.2 are mainly used for correction levels (from the previous trend movement), 50%, 61,8%, 78,6%.
Correction levels are based on candle wicks, in other words, on their maximum or minimum points. To build a correction level, you need to find a trend. Fibo levels can be asymmetrical, so it is especially important to pay attention to where the beginning and end of the wave on which the level is being built are located.
On a downtrend, 0% at the bottom, 100% at the top. When ascending, the opposite is true. The most significant correction level is 61.8. When a breakdown of this level occurs, a new trend in the opposite direction usually begins. After that, it is necessary to build a new corrective level.
Correction pattern – movement between minor correction levels. After such a move, the price usually moves to the key level of 61.8. 4 patterns are depending on which levels of correction the price concerns.
⚠️Even if the skills of analyzing the state of the market by Fibonacci levels will not be a big advantage in trading, then in any case it is a great (and to some extent integral) experience of technical analysis. Fibo levels can be combined with a footprint, deltas, and other tools. The trader will understand only in practice if it is possible to benefit from this or not.
❤️ Please, support our work with like & comment! ❤️

What to Do with Consolidation Patterns in BitcoinConsolidation is about the turnover of stock, first and foremost. When the investors who bought more recently replace those who want to sell (and by implication have high expectations for the BTC:USDT to go higher from current levels), downward pressure on the stock is replaced by demand.
This technical analysis (TA) pattern predicts a sudden and sharp price increase, and when formed properly is one of the more reliable indicators. While not always present in most stocks, when you’re certain that a consolidation pattern has formed, it can represent an opportunity to take significant profits.
On the trading chart, the BTC:USDT price will look like it’s forming a cup and handle. The indicator is generated in the following phases, and in this exact order:
1) Before the cup forms.
First approach what will eventually become the cup pattern. This approach is flat and sideways trading, in a very tight price range.
2) BTC:USDT fall steeply, forming the left side of the cup.
Shares fall relatively steeply and quickly in price as some investors grow tired of the lack of volatility in the stock. This drop usually occurs in a matter of days and forms what will eventually look like the left edge of the cup and handle pattern.
3) Sideways trading after the drop forms the bottom of the cup.
BTC:USDT eventually stop falling and enter a tight sideways range for several days. During this time, many sellers stop selling because they’re unwilling to unload their BTC:USDT at these prices. At the same time, buyers see value, thus creating a price floor that limits any further downside. Shares neither spike higher or lower as the bottom of the cup forms.
4) BTC:USDT price rises, forming the right side of the cup.
For almost the exact amount of the fall (which formed the left side of the cup), and just as quickly, BTC:USDT will jump higher. The trading chart will now show price activity that looks as if a cup pattern has formed. Sudden demand overpowers the last of the sellers who would take the lower price, and after they are gone, BTC:USDT respond to even minimal buying by moving higher.
5) Reactionary fall.
After the sudden price spike, some shareholders who had been on the sidelines move back in to take advantage of the price jump. Even the buyers get spooked by the speed of the move and aren’t interested in paying these “expensive” prices. BTC:USDT fall back lower, although only partially. They settle slightly lower than the high in the latest price spike, yet well above the bottom of the cup pattern.
6) The handle forms.
After the spike and the reactionary sell off, BTC:USDT enter a narrow sideways trading range, forming the handle of the cup pattern. During this time, old shareholders turn over in favor of new ones, so that an increasing percentage of investors in this company expect good things from the BTC:USDT price going forward and aren’t likely to sell.
Think of the handle of the consolidation pattern like a spring that is slowly coiling. The greater percent of shareholder turnover during this time period, the more pronounced the subsequent upward move will be and the more reliable the indicator.
