Waiting to Enter on a Channel BreakHello my friend | Welcome Back.
Please support this idea with LIKE if you find it useful.
***
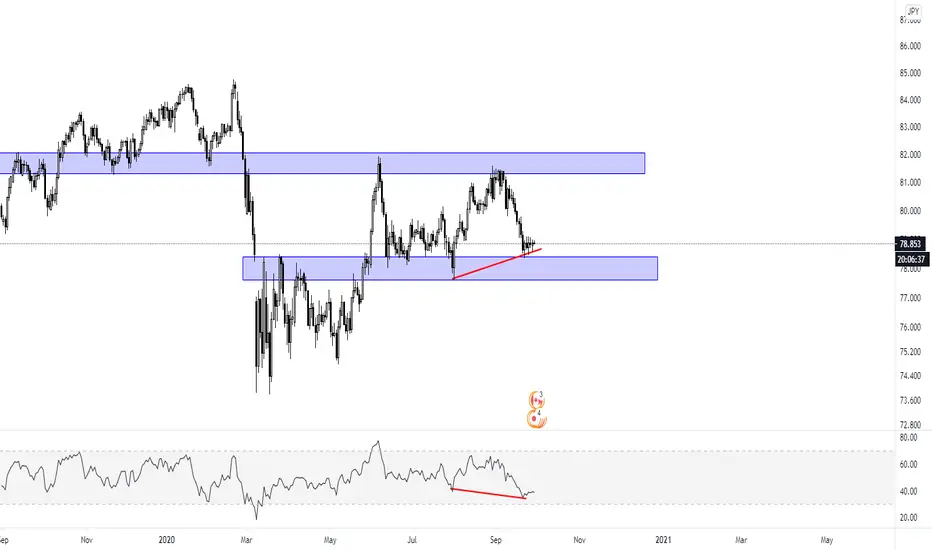
* Once I have this structure in place, finding the trend becomes relatively easy. When the pair is trending lower, I only want to look for selling opportunities. Of course, the opposite is true when the pair begins trending higher.
Enter in the Direction of the Trend
At this point, you have identified the major trend and found a favorable corrective pattern such as a channel or a wedge.
The next step is to look for an entry once price breaks the pattern.
Bitcoin (Cryptocurrency)

Head and ShouldersHello my friend | Welcome Back.
Please support this idea with LIKE if you find it useful.
***
where would you enter? 🤔


Only 5 Set-ups like this mon-shot since 2012 - How to trade ?All Charts To Same Scale For Comparison.
See Can Spot A better Way To Trade It
NOT ADVICE. DYOR

Bitcoin Suuport In or Not Yet ?Bitcoin - Support In or Not Yet ?
DXY - Retrace Over or Not Yet ?
Will USDCNY Crash By End By End Oct ?
NOT ADVICE. DYOR.

Very useful comicsBe like Alex, do not be like Jack!
Many of my students have a bad experience working with scam brokers.
I will tell you the story of one of them!
He decides to try different brokers and get a lot of bonuses from them......
Everyone loves to get a lot of attention. So, the managers of these brokers called him every few times a day.
They told many beautiful stories about a wonderful life with a bag of money, expensive vacation, sports cars, and personal Jet...))).
But when they talk about such things, they sit in a small room without air conditioning, dressed in cheap clothes and eating fast food.
Yes, he will get it all if he cheats you and hundreds of other novice traders!
Then you can think about the police, court, or indictment, but they just change their head office address and contact phone number.
They never refund money, except when you have a good influential friend.
I have two videos for you on my youtube channel.
The first one is about how to identify a cheating broker and the second one about how to choose a reliable broker.
I recommend that you check both of them and never make the same mistake as my friend.
He did not get his money back and that managers (traders, bots) are losing most of their deposit.
Be careful, take care of your money, take care of your nerves, take time... be like Alex!).
Don't forget to support this idea with your like!

How to trade GOLD/SILVER RATIO in Any platform!?This is the first educational post I Make on Tradingview so make sure you like and comment and follow if you like it,
in this post I will explain how to trade The GOLD/SILVER RATIO in any platform
You can use the same strategy to trade ETH/BTC in Binance Futures with leverage ...
first lets define what is gold silver ratio ,
The gold/silver ratio (GSR) is the current price of an ounce of gold divided by the current price of an ounce of silver. It's a simple numerical calculation that shows how many multiples gold is trading relative to the price of silver, a common indicator used by precious metals investors worldwide.
this indicator help us know which is going to gain more or wich is going to lose more in some cases when there is high volatility in the markets you might find this chart stable with very strong trading opportunity for example back in the 26/2/2020 when the markets were uncertain and volatile this chart made a very good breakout and huge gains! you can find that on the chart above
so now lets explain how to trade it in any platform that have GOLD/USD and SILVER/USD
if you want to short the GSR
all what you need to do is to sell short GOLD and buy long SILVER with the same amount of money and leverage in each of the positions
Example
if you open a long position with 1000$ and x3 in SILVER/USD you have to open a short position in GOLD/USD at the same moment with 1000$ and x3 leverage.
If you want to long the GSR
all you need to do is the opposite of shorting we buy GOLD/USD and sell SILVER/USD with same rules again we should use the same amount of money and us the same leverage in each of the two position.
thanks for reading good luck

EMPTY YOUR MIND: PSYCHOLOGY OF A TRADERWe have always believed that the business of Cryptocurrency Trading thrives on 3 things – Intelligence, Psychology and Information.
If all humans had the same level of IQ and everyone was emotionally zero (i.e. had similar psychological traits) and if the flow of information to everyone was equal, then what purpose would the Crypto markets serve?
None whatsoever. In fact, it would become the most boring fixed income scheme you could invest in.
Nevertheless, of these three traits, human psychology has the maximum impact on the movement of Crypto prices in the short-medium term.
It is the psychology of a trader to overcome biases and human emotions like greed and fear and envy and desire that sets him apart from the others.
Mostly, a trader just reacts and makes a lot of money if he can correctly predict the behavior of others.
In order to succeed long term you must first understand your self and the relationship between yourself and the market.
Your emotions, thoughts, and perception of the market, and how these relate to actions taken in the market place.
If you do not believe these are directly connected with your actions and therefore performance, you will likely struggle to maintain a consistent performance.
Rather than viewing your emotions as an enemy, learn to use them to your advantage.
Learn to understand the circle or cycle between you and the market.

Forward into the past!Let's start from the beginning!!!
Every day I get a lot of messages from the newbies from ower the world with the same problem... "I have opened a trade position without stop-loss! What should I do? A bigger part of my deposit gone!"
It's so sad to hear about it!
Stop-loss - an exchange request placed in a trading terminal by a trader or investor in order to limit their losses when the price reaches a predetermined level.
Almost all experienced Forex traders agree that it is necessary to set the stop loss in any style of trading.
Beginners who have only come to the market often neglect this rule, but over time they also come to
understand (or they just stop trading because of constant losses).
Ways to Stop Loss
To trade on any financial market (not only on, but also on commodity futures, the stock market or even exchange) a system is required.
As a rule, each quality trading strategy has rules for setting a stop loss, but there are universal techniques that will fit almost any vehicle.
The easiest way to set the stop loss is on the local minimum (when buying) or maximum (when selling).
Finally, it's important to realize that stop-loss orders do not guarantee you'll make money in the stock market; you still have to make intelligent investment decisions.
If you don't, you'll lose just as much money as you would without a stop-loss (only at a much slower rate).

📖 Diversification in trading strategies. Part 1Often, traders are pursuing the system's maximum profitability, upon creating trading strategies. However, it is more important not to increase the value of the expected profit, but to reduce the possible risk, which is expressed in the maximum allowable drawdown.
A simple, but relatively reliable way to assess the trading strategy effectiveness is to determine the profitability ratio to the system's drawdown maximum in the period under study, the so-called recovery factor. For example, if the system's profitability is 45% per annum, and the maximum drawdown is 15%, the recovery factor will be 3.
If we compare two systems with different profit values and drawdowns, then the system with a higher recovery factor will be better. A system that allows to earn 30% per annum with a 5% drawdown will be better than a system with 100% per annum and a 40% drawdown. The profitability can be easily adjusted to the required value using margin lending, but the risk level in the system profitability cannot be changed, these are integral terms of the system. By increasing the yield, we increase the risk accordingly.
However, it is possible to reduce the portfolio risk at all applying diversification, that is, trade not one separate strategy, but a whole set, dividing the capital between the systems. In this case, the drawdown of each individual system does not necessarily coincide with the drawdowns of all other systems in the portfolio, therefore, in general, we can expect a smaller total drawdown maximum, while the system's profitability is only averaged. If the systems are sufficiently independent of each other (different trading strategies are used, different instruments are traded), then the drop in equity in one of the systems will most likely be compensated by the increase in equity in some other system. The more independent trading strategies and trading instruments are, the more the overall risk is diluted.
There are even situations when it makes sense to add a knowingly unprofitable strategy to the portfolio. Although the overall portfolio profitability will decrease slightly, it may turn out that the risk will decrease even more, and overall portfolio performance will improve.
Theoretically, if you add more and more strategies and instruments to your portfolio, you can get as little risk as you want, and, accordingly, as much efficiency as you want. However, in practice, such an intention will inevitably face the problem of correlation between different strategies and tools.
The main ways of possible diversification are as follows:
Diversification by trading strategies
Diversification by parameters of trading strategies
Diversification by trading instruments
Diversification across markets
🧐In this part we will take a closer look at the first option.
📌 Diversification by trading strategies
At the heart of every trading strategy is some general market attribute or traded instrument that can be used to make a profit. For example, the ability of the market to form prices trends and continue moving after a breakout of a strong resistance level.
If there are several systems based on fundamentally different considerations, then capital diversifying between these systems can lead to significant risk reduction. Indeed, in terms of the internal essence of the system, they can be as different from each other as you like, and as weakly correlated with each other. If, for example, trend-following systems and systems on level breakouts are somehow similar to each other and often give similar equity, then trend-following and counter-trend systems, on the contrary, will even show a negative correlation. Where the trend-following system will be sawn, the counter-trend system will show profit, respectively, the overall portfolio risk will significantly decrease.
Diversification of this kind, in theory, has no limits in depth and depends only on the creative ability of the trader to create systems. Therefore, it is important to constantly continue to work on the search for new trading strategies, since it is in this direction that the most reliable way to increase the efficiency and profitability of trading lies.

RISK MANAGEMENT : Not more than 1%Many traders would have you believe that a certain trade or indicator is the best way to manage your risk in the Crypto market. But the truth is, the best risk management strategy, is self-discipline.
Specifically, as a trader, you must never risk more than 1% of your total capital on a single trade.
The main reason for this rule is to minimize capital losses in case of harsh market conditions.
By adhering to this rule, you would need to lose 100 trades in a row to wipe out your account. You could even implement stop loss orders to further minimize such losses. Trailing stop loss has proven itself to be the life saver.
Thus, if you risk 1%, you should set your profit goal on each successful trade to 1.5 – 2% or more. When making several trades a day, gaining a few percentage points each day is entirely possible, even if you only win half of your trades.
Trading is about preserving your capital as much as it is gaining profit. By controlling your losses, you can endure tough market conditions and be ready for profitable opportunities once they appear.

BTCUSD: Decision Time - What Will Autumn Bring $9K or $12k?What will the break of the symmetrical triangle bring: $12K, $9K or more $10K?
Bitcoin Hash Rate, Dominance, Energy, NVTS & Volume
Logirthmic Curve & Network Growth : $100K in 2021?

Tesla getting ready to race bitcoin againUsing candlesticks in extraordinary ways. CAVEAT: small sample size. NOT ADVICE. DYOR
Signal code: Rising Window followed by Long Lower Shadow & then Rising Window again is a buy.

HYPOTHETICAL: BITCOIN - $30,000 BY 2024?The volatility of Bitcoin on anything less than a 4H chart, hides its path of momentum. On this monthly chart I show what I see. Move chart to left to see more. The path is more probably up in the long term based on monthly momentum. In my hypothetical $30,000 is possible - but I make no predictions. I previously made other speculations.
If we hit a 1929-type depression in the next few years - and fiat becomes meaningless as in 1929, what will we use to exchange value? I think it could be Bitcoin - or possibly some other crypto(s). I can't say it won't be Ethereum.
Some argue that 1929 is gone and the scenario would never happen again. I'm not so sure. When I look at the factors that contributed to 1929, I'm seeing them right now as the COVID-crisis evolves.
This post does not mean that you should rush out and purchase or invest in Bitcoin or cryptos.
Disclaimers : This is not advice or encouragement to trade securities. Chart positions shown are not suggestions. No predictions and no guarantees supplied or implied. Heavy losses can be expected. Any previous advantageous performance shown in other scenarios, is not indicative of future performance. If you make decisions based on opinion expressed here or on my profile and you lose your money, kindly sue yourself.


Where will the trend end? TD Trend Factor and TD PropulsionBITFINEX:BTCUSD
Dear friends!
I continue describing Thomas DeMark’s technical tools. I have already explained such tools as:
1. TD Retracements
2. TD Lines of demand and supply
3. TD D-Wave
4. TD Sequential and TD Combo
Today, I am going to deal with TD Trend Factor and TD Propulsion. These are two independent technical tools that in combination help you quite accurately identify the trend reversal moment and potential targets. But first, I’d like to unveil a small secret of DeMark. Following long experiments with Fibonacci numbers, DeMark found out the two most important of them. These are 0.382 and 0.618. By subtracting one from the other and dividing the result by 4, he found the value of 0.059.
Later, for many years using this number in practice to calculate levels of support and resistance, he came to the conclusion that the most frequent ratio that occurs in trading is 0.0556. Therefore, when calculating the resistance levels, an upward percentage of 0.0556 * 100% = 5.56% is used. When calculating the support levels, a downward percentage of 100% - 5.56% = 94.44% is used to analyze micro-movements or prices whose count goes more than two digits after the decimal point, DeMark suggests using a coefficient with a shifted decimal point, i.e. 0.556% and 99.444%, respectively.
TD Trend Factor basically aims at identifying the trend reversal level and confirming its relevance. To do this, we first need to find out the reference point.
For a bearish trend, it is determined by the following conditions:
1. Identify the bar that marks the peak of the bullish trend
2. If the high bar above the previous bar, the starting point is at this bar’s high
3. If the high bar closes below the previous bar, the reference level is the closing price of the bar with the peak.
To explain it better, I’ll give an example:
The above chart presents Bitcoin all-time high. Its peak is at 19891 USD. You see that this bar’s close is lower than the previous bar’s close, so, the reference level is the high bar’s close.
This level is at 18960 USD. So, based on this level, we shall build the levels of TD Trend Factor for a bearish trend. The simplest way is to calculate them in Excel.
Therefore, I’ve got the following calculations:
18960*94.44% = 17905
17905*94.44% = 16910
16910*94.44% = 15970
You can be calculating in this way until the result is close to 0. With rounding to integers, there are the following levels
18 960
17 906
16 910
15 970
15 082
14 244
13 452
12 704
11 997
11 330
10 700
10 105
9 544
9 013
8 512
8 039
7 592
7 170
6 771
6 394
6 039
5 703
5 386
5 087
4 804
4 537
4 284
4 046
3 821
3 609
3 408
3 219
3 040
2 871
2 711
Eventually, as the history has proven, the low of the bearish trend came at 3215.2 USD, that is just a few dollars below one of the levels indicated above.
You might say that this is a coincidence but try to carry out this experiment on other trends and you will see that it works.
If we analyze the earlier history BTCUSD price chart, we’ll see that the TD Trend Factor levels of the downtrend had excellently worked out before that (see the chart above). In addition, it is clear that the lower the price is moving, the thicker becomes the grid. This construction fully matches to the market behavior; in a bearish correction, the deeper the price falls, the stronger the resistance becomes and the shorter is the range of price swings.
For a bullish trend, the same rules are applied, only in vice versa. .
To find a reference levels, we need identify the bar that marks the low of the bearish trend and:
1. If the low bar closes below the previous close, the reference level is at the low.
2. If the low bar closes higher than the previous close, the reference level is the low bar’s close.
I’ll explain on the example.
The above chart represents the low at 3215.2 USD that we have already marked before.
If we zoom it in, we’ll see that the close is a little higher than the previous bar’s close, so the reference level will be set based on condition 2, at 3283.4 USD.
The levels will be calculated in the same way, only the coefficient will be 105.56% instead of 94.44%.
Finally, there are following levels:
3 283
3 466
3 659
3 862
4 077
4 303
4 543
4 795
5 062
5 343
5 641
5 954
6 285
6 635
7 004
7 393
7 804
8 238
8 696
9 179
9 690
10 228
10 797
11 397
12 031
12 700
13 406
14 152
14 938
15 769
16 646
17 571
It makes no sense to mark all the levels in the chart, but to estimate the relevance of the calculated levels, I’ll mark the closest ones to the recent price movements.
As you see from the above chart, the calculated zones serve not only as strong resistance levels, but as a support as well.
How to use TD Trend Factor
TD Trend Factor is a supplementary tool, used to confirm signals, it doesn’t provide any buy or sell signals by itself. So, you need to use it together with other DeMark's tools:
TD Retracements
TD Lines of demand and supply
TD D-Wave
TD Sequential and TD Combo
And other DeMark's indicators that I haven’t yet described.
One of these tools is TD Propulsion.
The indicator is designed to send signals of the trend extension or exhaustion. This tool consists of two parts. The first element is TD Propulsion Up and TD Propulsion Down,these indicate entry points. The second part is TD Propulsion Up Target and TD Propulsion. As you can guess by the name, these are trend targets. So, let us see how this indicator is built and how it can be employed in practice.
Thomas DeMark says that to confirm a bullish trend, we need to do the following:
1. Identify the points of X and Y – the low and the high of last growth wave in they bullish trend.
2. Identify the Z point – the lowest level of the bearish correction, following the growth wave XY.
If this level is lower than 23.2% of the correction size, than the points of X and Y are correct; if this is not so, one needs to rearrange the borders of the wave.
Next, we shall identify the TD Propulsion Up level
To do it, we use a simple formula:
A = Z+(Y-X)*0.236, , so, in the given example, this is:
A = 12730.6 + (17171 - 5400.2)* 0.236 = 15508.5 USD.
This level marks the first resistance level in the trend continuation. As a rule, this level is not broken out when the trend reverses. Next, we shall find out the level of TD Propulsion Up Target.
To do it, we use a simple formula:
A = Z+(Y-X)*0.472, so, in the given example, this is:
A = 12730.6 + (17171 - 5400.2)* 0.472 = 18286.4 USD.
This level is potential buy zone. As you see from the chart above, this level is very close to the real one and the trend reversed only after just a little more than a thousand of dollars,
I will describe this situation in more detail a little later. Now, I’d like to explain how to analyze a bearish trend with TD Propulsion.
Here, you build everything in a similar way, just like when using other DeMark's tools. For the further analysis, I found out clear borders of the downward wave. They are marked with the points of X and Y in the above figure.
Now, let us look at the start of the bullish correction and the level where it finishes. This is point Z in the chart. You see that this level exceeds the level of 23.2% of the correction, and so, the wave itself and point Z are suitable to calculate the TD Propulsion Down.
To do this, I use the following formula:
A = Z-(X-Y)*0.236, so, in the given example, this is:
A = 4384- (6485.8-3215.2)* 0.236 = 3612.14 USD. This level is TD Propulsion Down.
Next, I identify D Propulsion Down Target.
The formula is:
A = Z-(X-Y)*0.472, so, the there is the following result:
A = 4384- (6485.8-3215.2)*0.472 = 2840.27 USD.
As you see from the above chart, the A level has worked out. As I’ve already written above, this level may signal either the trend continuation or its reversal. And the way how the price goes through this level, very difficult and slowly, is the trend reversal sign. In addition, I should note that both in the first case, when we identified the bullish trend reversal, and in this situation, level A works out. Therefore, it can be applied as a low-risk trading strategy to set the intermediate targets when analyzing the Bitcoin future price movements. To see the full capacity of these tools, we need to study their application together with other DeMark's tools on a real example.
As an example, I will analyze the moment when the trend was reversing at 3215.2 USD. It is clear from the above chart that TD Propulsion Down A level exactly matches to the TD Trend Factor level at 3612.1 USD. When, following the Z point, the BTC price was moving down, it is clear that this level provides a strong support. In addition, the TD Trend Factor level at 3466 USD is not broken out. The price rebounds from it like a rubber ball.
A buy signal here is the bullish Setup (remember TD Sequential and TD Combo). This signal is marked with a red arrow in the above chart. It is confirmed by a typical rebound from the TD Trend Factor level at 3466 USD and the bar closing above level A. After this combination, one could have already entered a long with a short stop beyond level 3466 USD.
You already know what happened next. The risk/profit ratio for such a trade is perfect. Now, for a fair experiment, let us try to find out an entry point in the current market. First, let us build the TD Trend Factor support and resistance levels.
There is already a clear high with the peak at 13764 USD. We see that this high bar closes above the previous bar’s close. So, the reference level will be at the highest high of 13764 USD. Next, we multiply each level and the product of each multiplication by *94.44%.
There are the following values:
12 999
12 276
11 593
10 949
10 340
9 765
9 222
8 709
8 225
7 768
7 336
6 928
6 543
6 179
In the above chart, I marked these levels and I have noted that the last bar closes above the previous bar’s close; and its low at 9728.2 is close to the TD Trend Factor level at 9765, which itself is a bullish signal. For the Bitcoin price prediction, based on this signal, I may already assume a reversal and point Z to calculate the levels of TD Propulsion.
It is clear from the above chart that the Z point is a little lower than the level of 23.2% of the correction from the wave XY with the coordinates on the price scale of 3405.3 and 13764. Therefore, the Z point is relevant for this wave. So, we can calculate TD Propulsion Up (A) and TD Propulsion Up Target (B), according to the coordinates and the formula studied above:
A = 9728.2 + (13764 – 3405.3) * 0.236 = 12172.85 USD.
A = 9728.2 + (13764 – 3405.3) * 0.472 = 14617.51 USD.
Next, I attach the TD Sequential indicator and select the timeframe where setups are worked out most accurately on the historical data. For the BTCUSD pair, the indicator performs the best in the five-day timeframe.
As a result, you see that the BTCUSD is now in a bullish setup, where the fifth bar is formingg, out of nine in total. It means that before a the bitcoin trend could reverse and a bearish trend should starts, there at least four bar more to be formed in the bullish trend, not counting the currently forming bar, that is, there are more then four weeks ahead. In addition, there is a strong support level at the Z level at 9728 USD, below which, one might set stop losses, and the first target for ta take profit is at 12172.85 USD, the second target profit is at about 14617 USD.
Besides, I can define the possible BTCUSD scenarios and suggest an adequate response to a particular market situation.
The chart above outlines three possible scenarios for the BTC future trend.
1. The first scenario, a pessimistic one suggests that the BTC ticker shouldn’t break through the A level and rebounds downside. This is a clear trend reversal sign. We should take the profits and enter short trades with a stop above the A level.
2. The second scenario is neutral. According to it, the ticker should break through the A level and stop close to the B level. In this case, we will take the profit at the B level and expect either the reversal below the A level to enter shorts, or reaching the B level to enter new longs.
3. The third scenario is the most optimistic and the least possible, in my opinion. The ticker breaks through the levels of A and B with large volumes and without strong delays. In this case, we should just follow the trend, moving the stops, covering the TD Trend Factor levels, calculated before, based in the low of the bearish trend.
Here, I am about to finish describing Thomas DeMark's tools, TD Trend Factor and TD Propulsion, but I am not finishing writing about his studies. In my next training article, I will deal with more unique tools by the famous trader and explain how to apply DeMark's indicators to cryptocurrency trading.
Subscribe not to miss the continuation!
I wish you good luck and good profits!

How to filter good and bad entry signals? TD REI and TD POQBITFINEX:BTCUSD
Dear friends!
I continue describing Thomas DeMark’s technical tools.
Today, I am going to deal with more DeMark’s technical tools, TD REI and TD POQ that are included in the group of indicators TD Oscillators.
Major problem of all oscillators
The main problem that DeMark sees in the use of oscillators is that average traders exaggerate the value of the divergence of the indicator with the price position.
As a rule, people, who do not understand how an indicator works and based on what principle it alternates, do not care what the composition and the recommended interpretation of this indicator might be. They try to interpret its vague signals that aren’t basically signals and must be confirmed by other indicators. A good example is a famous indicator, RSI.
In May, this indicator showed a bearish divergence in the daily timeframe (see the chart above) and, according to all rules, the trend should have reversed, and the price should have started declining. According to DeMark, the main problem in interpreting such signals is that users do not take into account the time that the indicator is in the overbought and oversold stages. DeMark notes that if the indicator is in the overbought or oversold zone for more than 6 bars, this indicates the strength of the trend, which means that this signal is false.
It is clear from the above chart that the two overbought zones lasted for more than 6 bars, which indicates the trend’s strength, and so, the oscillator’s correction in these cases will be a false sell entry signal.
The number of bars may be different for other oscillators. Everything depends on the indicator’s parameters and the peculiarities of its composition. Therefore, in each particular case for each timeframe, one should perform an own analysis of the number of bars in the overbought or oversold zones.
To facilitate the analysis of all these parameters, DeMark developed his own series of oscillators that will described below.
Introduction to TD REI indicator
First, I’d like to write about TD REI, or Range Expansion Index. This indicator is designed to filter out false signals when the price is trading in the range or in a strong trend, it should send a reversal signal only if the market sentiment really changes.
Before I present the charts with this indicator, I want to pay tribute to its developer @ e2E4mfck. The matter is that the TD indicators are not available in the Tradingview standard library, therefore, I had to look for those that were published in the public library and only thanks to such enthusiastic programmers can you get acquainted with these wonderful tools by DeMark.
So, you see the TD REI indicator in the chart above, at its bottom. The TD REI oscillator typically produces values of -100 to +100 with 45 or higher indicating overbought conditions and -45 or lower indicating oversold. Besides, the TD REI counts the number of bars, and, if the price is in the overbought or oversold area for more than 6 bars, the indicator shows this and indicates a strong trend.
On the other hand, this indicator is more responsive to the price changes, and, while the RSI is still in the overbought area, or in the neutral area, the TD REI has already a few times entered the oversold area, thus sending a buy signal (in the above chart, all buy signals on the indicator are marked by circles, and by green flags on the price chart.
It stands to reason that this indicator is much more complicated than it may seem, based on the above example. It also has many peculiarities, which I will describe later.
First, I’d like to describe its mathematical model, so that you can understand the indicator’s signals.
Mathematical model of TD REI indicator
The TD REI value is calculated by adding the respective differences between the current day’s high and the high two days earlier and the current day’s low and the low two days earlier.
To make it clearer, the calculation formula looks like this:
X = (H – H2) + (L – L2), where
H is the current high
H2 is the high two days earlier
L is the current low
L2 is the low two days earlier.
Besides, two conditions must be met:
Condition 1
• the current day’s high must be greater than or equal to the low five or six days ago,
or
• the high two days earlier must be greater than or equal to the close seven or eight days ago.
Condition 2
• the current day’s low must be less than or equal to the high five or six days ago
or
• the low two days earlier must be less than or equal to the close seven or eight days ago.
If neither of the conditions is met, a zero value is assigned to that day’s bar.
If both conditions are met, then there will be a different formula:
TD REI = (Y / (H5 - L5)) x 100
Where:
Y = (Sum X1 next… X5)
H5 is the high over a five-day period
L5 is the low over a five-day period
Differently put, TD REI a kind of shows the price movement, adjusted to a trading range over the five days.
TD REI filter for signals
Like any other indicator, TD REI is not a Grail and sends false signals too. To filter out these false signals, Thomas DeMark suggests using the TD POQ indicator, (Price Oscillator Qualifier).
To be fair, I must note that this indicator can be used together with any oscillator, based on the price action, (for example, MACD, RSI).
TD POQ conditions to validate the TD REI signals:
Buy signal:
1. TD REI has been in the oversold condition (below -40) for six or more bars;
2. The last complete bar should close below than the previous bar
3. The current bar’s open should be equal or lower than the highs of the previous two bars;
4. The market should be trading above the open price and break through the high iver the last two days.
Sell signal:
1. TD POQ has stayed in the overbought condition (above + 40) for six or more bars;
2. The last complete bar should close higher than the previous bar’s close
3. The current bar’s open should be equal or higher than the low for over the last two days
4. The market should be trading lower than the opening price and break through the low of the last two bars.
To explain how you can use the TD POQ to filter the entries, I’ll describe the examples of a buy and a sell signal.
Buy signal:
1. It is clear from the chart above that the first condition is satisfied, the price has been in the oversold area for more than 6 bars.
2. The last complete bar closed lower than the previous bar’s close (green dots below the red ones in the chart)
3. The current bar opens lower than the highs of the two previous bars (the current opening price is the same as previous bar’s close, it is market with green dots; and it is lower then the two yellow dotted lines)
4. When the price breaks through the highs of of the last two bars, there is a buy signal (it is marked with the red cross).
As you see from the chart, there is a reliable early signal to enter a trade.
I must note that the TD REI is a good supplementary tool for other Thomas DeMark's indicators. It is clear from the above chart that the signal perfectly matches to the start of a bullish set, indicated by TD Sequential (the developer is @andyhitchman) on the five-day timeframe (but it also matches on the shorter timeframes).
Sell signals
Now, let us analyze the sell signal on the example of the BTCUSD all-time high.
First, I’d like to note that the TD REI indicator, starting from 8000 USD recorded on November 20th, 2017 (in the BTCUSD price chart) was in the overbought condition for more than 30 bars and has never sent a false sell signal! In my opinion this fact alone is the evidence of the TD REI efficiency.
Now, let us analyze the sell signal produced on December 19th.
1. As I’ve already said that the indicator had been in the overbought zone for than 6 bars before the signal emerged. We can put a check.
2. The last candlestick closed as a doji, the closing price is almost equal to the previous bar’s close. This condition is NOT fully met, so we need an additional confirming signal.
3. In the above chart, you see that the current bar, of December 19th, opens lower than the high of the previous two days, so, we also put a check.
4. The market broke through the lows of the previous two bars and is trading lower (I marked the breakout with the red cross).
Therefore, as there is not a fully confirmed signal, it is important to employ this indicator with other Thomas DeMark’s tools.
For example, in the previous article (see here), I described a good tool, TD Propulsion.
In that article, we defined the TD Propulsion Up Target level for the bullish trend at level 18286.4 USD.
If we attach it to the present chart and add the calculations of the TD Sequential indicator, we shall see that this very bar closes lower than the TD Propulsion Up Target level, and at the same level, a bearish set up starts, based on the TD Countdown indicator.
Both these signals are confirming signals and, finally, suggest sell trades.
Analysis of the BTCUSD current market situation
Now, let us analyze the current BTCUSD price trend. In the previous article, when I was writing about the TD Trend Factor and TD Propulsion indicators, I finally outlined three possible scenarios for bitcoin trading.
At that time, it was difficult to determine the BTCUSD future trend.
Remember, there were three scenarios:
1. BTC price should rebound from level 12172.9 USD and go down
2. The price should rebound from level 14202.4 USD and be trading flat with a possible decline in future
3. The BTCUSD should continue moving up.
Now, if I apply the TD REI with the TD POQ filter to this chart, the situation becomes clearer.
As you see from the above chart, the last TD REI signal satisfies all the four conditions of the TD POQ filter (the overbought condition continues longer than six bars, the last bar’s close is higher than the previous bar’s close, the current bar’s open is higher than the lows of the two previous bars and the lows of those bars have been broken through).
In addition, as the fourth condition suggests, the market was trading lower than the reversal bar’s open (blue dots). Therefore, the first scenario, a more pessimistic one, becomes more likely. As I wrote in the previous article, the BTCUSD price is likely to hit the TD Propulsion Up level (level A). In fact, the market has already worked out this target so far, having not reached just a few dollars. Considering the bullish set up on the five-day timeframe, according to the TD Countdown, the btcusd may be trading flat for some more time. The BTCUSD may even try to hit level again 12172.9 USD, but, in general, it is not enough to invest your entire deposit into entering a buy trade.
As experience proves, the combination of TD REI signal and the TD POQ is a strong signal and I don’t recommend ignoring it. The BTC price is likely to rebound and continue its downward correction, according to the pessimistic scenario. After all, it doesn’t suggest that the bullish trend will necessarily end. However, my overview of the TD REI indicator won’t be complete if I don’t describe a situation, when the TD POQ filter doesn’t work.
The above chart represents such an example. You see that the TD REI has been in the overbought area for a long time, however the reversal bar (marked with the red arrow) doesn’t satisfy the last condition, the bar doesn’t break through the lows of the previous two bars. It is clear from the above chart, that the price hasn’t reached the level, marked with blue dots.
It suggests that the sell signal is false, and so, when the indicator reaches the oversold area, one might use this opportunity and enter a new buy trade, to increase the bullish position (I marked the buy zone with a green flag in the chart).
In case of a bearish trend and an unconfirmed buy signal, one may act in a similar way. However, you must always bear in mind that it is better to employ DeMark’s tools together. Only when all the indicators send the same signal, you can avoid trading mistakes and safely put entries.
I am not finishing writing about Thomas DeMark's oscillators. In my next educational posts, I am going to describe such indicators as:
TD DeMarker,
TD Pressure,
TD Range expansion Index,
TD Rate of Change.
Subscribe not to miss the continuation!
I wish you good luck and good profits!
Mikhail @Hyipov
________________________________________
like!
Subscribe!
Leave a comment!

How to be prepared in case of manipulation movement? Tips!!!In this mini-class, I want to discuss the H4 and H1 and Daily timeframe on the BItcoin price using the BItcoin as example of the manipulation. That is simulated and experimental what will be happing in case that doesn't have a bullish movement and bears take the domain again.
Look in the H4, we could see a formation of bearish rising wedge, but yesterday we see a simetric triangle that I still in this example
But, now looking in H1 timeframe, the price make a little correction until the $11,020 USD, but in cases that Bitcoin go to the $11,100 USD, in that exact point, we need to stay alert in case that we will have a bearish candlestick group. So, in case that was a bearish candlestick, the price action is goes to speak us that we need to sell Bitcoin if the demand is weakness!!! Because as the demadn is weakness, we could see a deep correction until the $10,638 USD, and that is a perfect target to put in short position in BItocin in case, but our position is still bullish until we not look and be cautelous in that zone that I talk.
Right now, lookin the Daily, we see a bull trend, but in cases that Bitcoin doesn't make support above of $11,100 USD and starting to show a bearish candlestik, is an huge alert to closed up our long positio nand then, pick up our money in profit, that we are in crypto in LTC. ETH and BTC.
So, guys, this is my class to knowing how to be prepared for in cases of manipulation movmeent, I invite below to look an example of manipulation when we are in the up-trend in the example of simetric tirnagle and later in some hours formed a bearis rising wedge.
That two examples I explain why we need to be prepared in two side in cases that Bitcoin make in the next hours possible manipulation to identification
Well, guys, this is an tutorial to learn how to make trading in Bitcoin and be prepared of market's manipulation
If you like it my idea, please support this idea in your analysis!!!
Tips:
1. Always look the price action
2. Be prepared when there will be possibles formation that you not see, always mark lines formation, support and resistance formation and more!!! Be creative
3. If in cases that we dont see a reversal of the trend, was a fake alarm and we continue with security our trend

Market Forecasting with Gann Boxes, BTC. Bishko published an interesting BTC chart showing the use of Gann Fans yesterday.
I rarely see Gann's work being showcased on TV, so to continue the same vein, here is something to play with for those who want to diver deeper into market harmonics.
This chart uses essentially the same starting point as Bishko's chart, only using a 1-day chart, rather than a 3-day chart.
However, here I am showing the use of Gann Squares / Gann Boxes, as opposed to Gann angles.
I won't explain in detail how this works, as I believe in doing to work when it comes to discovering market secrets.
What I will say is that this box is formed fully off the price high 13868.
Both the price and the time dimensions are formed from the high.
That's a BIG clue on how to form a correct Gann box.
In fact, the ONLY piece of information you would need to draw this chart on the exact day of the high would be that price of 13868.
The price high will give you the future major support and resistance levels.
See the 0.25 / 0.382 / 0.5 / 0.618 levels on the chart. Those price supports would have been known months in advance.
But you'll see the Gann box doesn't extend through to the 0.618 level that was hit in March 2020.
Why is that?
Because the time cycle aspect of the initial price high reached its completion in mid-February 2020.
And what happened when that time cycle returned full cycle?
Immediately the market dropped.
You can look back at the other time ratios (0.382 and 0.75 especially) to see how upon reaching those points in time the market began major moves in their the same directions but significantly stronger, or switched directions entirely.
Gann boxes like this can give you key price levels and important dates of time to keep in mind, where the market has a significant chance of making major moves.
This can be done months in advance, as seen here.
Investigate this phenomenon for yourself.
Markets are harmonic in nature.
Price and Time are the same.
Good luck.

Knowledge Is Super Power! How to Make Money in Simple Way?I don't understand the majority of traders who search for trading signals services, spend money for buying trading signals, and believe that such an approach will make them rich. I don't understand the strong wish to be dependent on a signal provider and his or her ability to provide quality trading signals for the audience.
If we are given something we depend upon the giver and isn't it better to know how to fish instead of waiting for a fish from someone?
Trading in any financial market can be simple for everyone. Of course, if you know what you are doing and how to catch opportunities from a price movement. Maybe you think it will need years to become a master of charts and predict future price movements? To tell you the truth you don't need to predict future price movements at all. It is an amateur's way of thinking and of course, it is wrong. What do you need, it is just to follow the market. That's all!
I prepared for you the examples of 3 trades which gave good profit. They are based on a trend-reversal and trend-following setups. They will be the same in different timeframes and different markets. How many years do you need to study all of them? I guess we shouldn't talk about years. Maybe several weeks if you know nothing about trading. How much time do you need to learn the simple rules of proper money management? Maybe 1-2 days? Do you think it really takes a lot of time and effort to catch an uptrend as we have in the BTCUSD market? The majority can do it without waiting for trading signals from someone. But why the majority prefer to do nothing in this direction? It is a good question.
You want to spend time and money for buying trading signals thinking that they will make you rich. Don't be so naive. There are no people in the world who will make tons of money for you for nothing. But there are people who can teach you how to trade properly and make consistent profit in the long run. You must remember, that only you can make yourself a successful person and change your life for the better. If you don't want to do it, why other people should care about you?
Knowledge is a super power! It is a well-known fact and successful people will remind you about it one more time.
Thanks for your attention!
