Head and Shoulders PatternThis is just one example that we mustn't expect perfection. If everything were perfect everyone could be billionaire and to be one could be so much easier. Should we expect life to be easy? I think it would be boring. Hahaha. A little challenge is good for us, when we put in diligent effort to learn something and achieve some measure of success we become proud of ourselves, deep inside we praise ourselves for accomplishing something.
Trading is not easy as the books portray it, it was designed not to be easy, but if we take time to learn it we can make it a bit easier for ourselves and the rewards that comes thereafter are much greater.
Trade Smart!
Do not forget to like, share, comment and follow if you enjoy my ideas.
I will be thankful!
Bitcoin (Cryptocurrency)

Where do you place your stop-loss? 🌐Where do you place your stop loss? 🌐
First, read our tutorial about market orders and limit orders:
Your stop-loss is such a limit order that you place above the point of collision of the trend lines that print the technical pattern on your chart:
- If you've got a Bullish Pattern (Bullish Wedge or Bullish Pennant), you place it below the pattern.
- If you've got a Bearish Pattern (Bearish Wedge or Bearish Pennant), you place it above the pattern.
In channels (Bullish Flag or Bearish Flag), you do not place the stop loss outside the pattern because you put it inside your channel around the point where the price last touched the left trendline.
Where would you place your stop loss in the pattern above?
(The solution's in a comment.)
Regards,
OXY

Reversal Zone Indicator / bitcoin litcoinIn this video, I show my most recent indicator that I have created which spots reversal zones based on stochastic RSI indicator combined with MACD indicator.
Potential buy zones are indicated with green columns printed on the chart, and sell zones are in red. a signal is more powerful and accurate whenever its surrounded by black bars before or after.

What you may not realize...Over the last couple of months, I have posted several educational articles. This one is to show how some of the tools widely used in trading can actually fit together.
I wrote a post a while ago about Dow Theory and how it fits into most modern technical analysis.
Click on each link to get the in depth content from the posts
When looking at a trend, cycle or major market move. The best place to start is from the biggest time frame available. This giving an overall bias for the overall trend, some people will refer to this as the monthly, super cycle, major trend. It basically means as large as you want. This can be based on your trading style, no point trying to obtain a bias on a minute chart.
For me I like the bias based on monthly Elliott wave moves;
Again click the image for the full post, at the bottom of this post in related ideas there is also basic level 2 Elliott.
Once you have the bias we can work out exactly where we are, like one of those street maps in a city.
We can use Fibonacci levels to drill down into potential areas of interest and targets for both the extensions and retracements.
Here is another article posted recently as an intro to Fibonacci;
Once you can identify potential areas of interest, you can drill down again into more advanced techniques such as Wyckoff.
In Wyckoff terms - I wrote a couple of articles and recorded several streams on the logic for the BTC call at the top in the middle of February, before the "Rocket post in March" all based on the info mentioned above here.
In this post, I covered the basics of Wyckoff and it's simple logic
Before going into the types of schematics here below;
The Wyckoff schematics is a little more advanced than the other techniques here, but when you know where you are in the cycle, they become a lot easier to identify.
In the "related ideas" section I covered a chronology of education, covering other topics like buying the dips, MACD, Trendlines and Moving Averages.
I hope this post gets you thinking about how it all fits and works together.
Disclaimer
This idea does not constitute as financial advice. It is for educational purposes only, our principle trader has over 20 years’ experience in stocks, ETF’s, and Forex. Hence each trade setup might have different hold times, entry or exit conditions, and will vary from the post/idea shared here. You can use the information from this post to make your own trading plan for the instrument discussed. Trading carries a risk; a high percentage of retail traders lose money. Please keep this in mind when entering any trade. Stay safe.

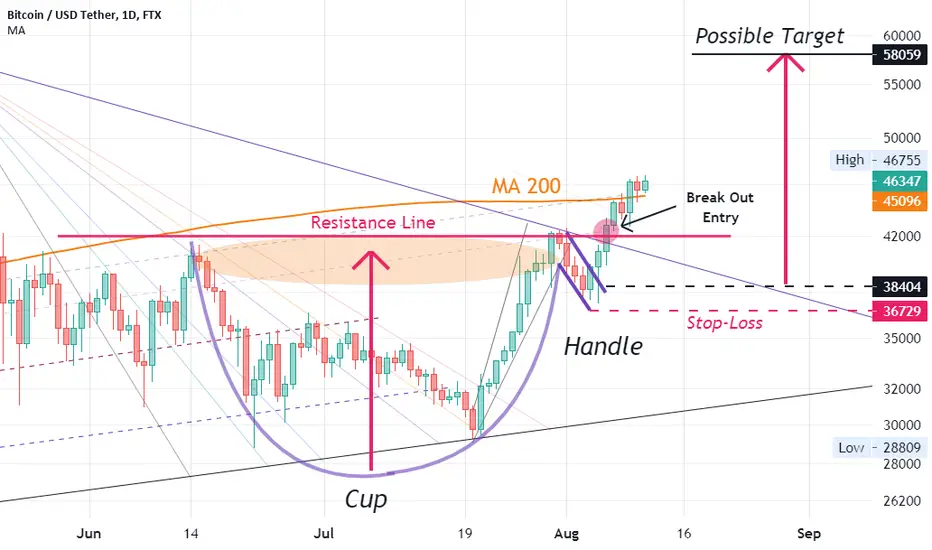
Cup and Handle Pattern (in simplest form)Dear traders:
It is the result of my efforts to offer a simple presentation.
Cup And Handle Pattern:
1- William J. O'Neil defined the cup and handle pattern in 1988 (American entrepreneur).
2- The Cup and Handle is a bullish reversal chart pattern.
3- Safe Entry: Price over 200-day moving average.
4- Most (cup) are two to six months long.
5- Cup and handle patterns can happen on both daily and weekly charts.
6- Take-Profit: When the price reaches an increase equal to the height of the cup
Reference:
1-www.newtraderu.com
2-www.tradingwithrayner.com
3-www.stockmarket-coach.com
Algorithmic Trading and it's Pros and ConsAlgorithmic Trading is the activity of bots to perform buy and sell actions on an exchange. These bots are scripts created by traders to eliminate manual trading.
It's all rule-based trading. A trader codes the indicators, moving averages, and various other conditions for the buy's and sell's to happen. Stop losses and take profits are coded and so are dynamic buys and sell conditions which makes algorithmic trading even more versatile.
Pros
Speedy executions make it easy to capture quick price movements as soon as they occur.
There is no risk of any human error during trading.
Execution of large volumes of trade in a short period of time.
Ability to backtest historical data to train the algorithm accordingly.
Investment can be diversified using multiple trading scripts.
Cons
Technology Dependency which means if the algorithmic trading platform is not reliable, there could be a possible loss of capital in the event of disruptions.
Need to know how to code or understand the concepts of trading, indicators, etc.
Need of high-end resources to create, backtest and run trading scripts.
How many of us make use of Algorithms to trade and what are your favourite trading strategies? Share in the comment box below
For more Educational content follow us.
Happy Trading

CONSENSUS MECHANISMS - PoW vs PoSHey, Alkalites! If you want to invest in cryptocurrencies and know how to recognize long-term opportunities, you should start learning the technology behind them.
Do you know what a consensus mechanism is?
Consensus decision-making is a process in which group members agree to support a decision in the best interest of the whole.
In other words, this mechanism is used to govern the blockchain behind each asset. Usually, this consensus is necessary to confirm the validity of the transactions that take place in that network.
The most common consensus mechanisms are PoW (Proof of Work) and PoS (Proof of Stake).
PoW is used to determine how the network can be sure that the transaction is valid and that someone is not corrupting the network, for example, with double-spending. The Proof of Work is based on advanced mathematical formulas called “cryptography”. That is why the name "cryptocurrency" was invented.
All miners compete looking for a solution to the mathematical problem. The first miner (or pool of miners) to solve the block problem receives a reward, the block is created and transactions are included. Examples are BTC and ETH.
PoS uses a process by which contributors to the system earn commissions from transactions. To validate the transactions, the user must put their coins in a wallet that freezes the coins. The more you stake, the more you earn.
If someone tried to hack the network or process malicious transactions, he would lose all of his participation, since it would affect the integrity of his wallet. Also, it encourages holding the tokens, which is good for the value. Examples are Algorand and Cardano.
Do you have any question? Let me know!
Have a great Sunday, Alkalites!

Crypto/Investing Cycle - How INVESTING really works, EducationWhen we hear the first time about investing the majority thinks that this is rocket science. But it is not. I do not mean that it super easy but with the right knowledge it will super clear on how to participate and how take advantage of it.
In this video I will explain everything which is important to know
- Investing Cycle
- Crypto Cycle
- how money is moving
- big institutions
What do you think?

Visualizing Risk ManagementI would like to save people from getting burned so after 3.5 years of being in this space here is my advice:
1. It is easy to fall in love with an investment, especially when you believe it could make you rich.
Have belief, but don't be blinded by it. Consider that you could be wrong, late, or even too early.
2. Price can remain irrational longer than you can stay solvent.
Getting chopped up in the range will dwindle your capital that can be very hard to recover.
3. If everyone knows it, the market will no longer follow that path.
The moment you determine a certainty is the moment you're destined to learn some lesson.
4. Doing nothing is hard.
It feels good to be all-in, but this pushes emotions to the brink for new investors that can't stop looking at the screens.
Trading/investing can be as simple as drawing one horizontal line on a chart.
Price goes above and you're in.
Below and you're out.
Numbers don't lie.
Develop a plan and cut the emotion.

A technique from 1202 - Really? images
Who was Fibonacci?
Fibonacci (1170 – c. 1240–50), also known as Leonardo Bonacci, Leonardo of Pisa, or Leonardo Bigollo Pisano was an Italian mathematician from the Republic of Pisa, considered to be "the most talented Western mathematician of the Middle Ages".
Fibonacci popularized the Hindu–Arabic numeral system in the Western world primarily through his composition in 1202 of Liber Abaci (Book of Calculation). He also introduced Europe to the sequence of Fibonacci numbers, which he used as an example in Liber Abaci.
You may have seen this?
This is what’s called the Golden ratio. I am not looking to go into depth on Fibonacci use cases, spirals, fans, arcs, circles, wedges and channels. However, it was important to mention so you can go away and do your own research on Fibonacci beyond this “welcome to” post.
Why is this useful for trading?
The Fibonacci sequence is quite possibly the most used tool in trading stocks, Forex, Commodities and even crypto.
In mathematics, the Fibonacci numbers, commonly denoted Fnuch that each number is the sum of the two preceding ones, starting from 0 and 1.
However, you are probably more familiar with Fibonacci extension and retracement levels.
It’s all based on the same logic.
Fibonacci numbers appear unexpectedly often in mathematics, so much so that there is an entire journal dedicated to their study, the Fibonacci Quarterly. Applications of Fibonacci numbers include computer algorithms such as the Fibonacci search technique and the Fibonacci heap data structure, and graphs called Fibonacci cubes used for interconnecting parallel and distributed systems.
They also appear in biological settings, such as branching in trees, the arrangement of leaves on a stem, the fruit sprouts of a pineapple, the flowering of an artichoke, an uncurling fern, and the arrangement of a pine cone's bracts.
Just look at this image once more!
So what?
The fact that these numbers appear in nature, it has clearly been adopted in art and architecture – this is due to the human desire for pattern recognition. It’s built into our DNA, the fact that we as a collective want to identify such patterns, will in fact drive charts.
I have written articles on Elliott Waves - which again is quite possibly one of the biggest use cases for Fibonacci, definitely an easy way to see the powers at work.
Here’s a link to one such article;
How to use Them?
If you have been trading for some time you are most likely familiar with Fibonacci techniques, if you are new, here is some basic logic to get you started.
As mentioned above there are several tools for Fibonacci, as a new trader I would suggest only looking at extensions and retracements to start you off.
Retracement
These levels often work well as support and resistance, you will find opportunities to enter on pullbacks (retracements) against the overall trend. Common levels here are 23.6%, 38.2%, 50% (although it’s not technically a real fib level, another topic for another time) then of course the 61.8% and the 78.6%.
How to draw these on the chart – you are looking for 3 points let’s assume A,B & C. You are looking for A to be at the start of your trend. Often this will be a swing low or high.
Let’s assume we are looking at an uptrend and we want to see the pullback. A would be placed here as above.
The next step is to use the extension tool and click A and drag to point B as below;
and the pullback level;
Now we have a move A to B we can start to look for areas of interest, in this example we can see the pullback was to the 38.2% level.
Some people are critical on the levels, for me I like it to tag the level and if it goes a little deeper then I still like it, if it doesn’t tag the level I would round it down to the lower level. Meaning if it fails at say 37.9% I would like to still think of it as only the 23,6% fib level. But there is no hard and fast rule on this.
Now this gives me A and B with a 38% pullback for C.
One way to trade using this could be a simple Buy at the break of B with a stop “Below” C
Not telling you this is what you should do, it’s just one method some do use. Obviously, you could increase the stop and put it under A instead.
Difference between Retracement and Extensions?
The data you gather by assessing the pullback becomes valuable when looking for potential targets, so whilst we used 2 touch points (A & B) for getting the retracement level, the most accurate extension forecasting tool would be to use all 3 (A, B and C). Although it can also be done by using only A and B as well, It’s another one of those not so clear rules.
Whilst the retracement tool gives us the pullback, the extension will give us some target areas.
Let’s start with the simple (not my preferred) method;
This is known as the extensions – 2 points (A, B) drag the curser from A to B and click and then back to A and click off.
With this method you will notice in your back-testing those areas of interest will often be at the 61.8% of the A to B move. This means if A + B = 100, then the target would be around 161-2.
Also, the 100% of the A-B move giving a target example of 200 and lastly the 1.618 level. Giving a target of 261-2 level. Again, no hard fast rule. This is just something seen over and over again.
Expansion levels
To start with go from A to B with the extension tool and pullback to C and click off. Assume you are using @TradingView
Much like the Extension you will notice similar characteristics of the moves up (in this example of the uptrend)
Something interesting
I mentioned above this is a great tool to use alongside Elliott Waves, here’s an example of how this works and can fit into the charts.
In this image above we use the same A point as a starting point, B becomes the 1 and 2 becomes the C. We can then work the Fibonacci extension & expansion levels to determine where 3 is likely to go. And then we can use the retracement for the pullback for (4) as well as new extensions for the projection of the 5th wave.
A few months back, I wrote an article here on tradingview on the psychology on the charts, it’s worth highlighting that here.
Click the link/image to view the article;
Nothing is 100% certain, but using these methods will help give you a better understanding of waves and swings, logic for pullbacks and reason for extension levels.
I hope this helps someone out here!
Disclaimer
This idea does not constitute as financial advice. It is for educational purposes only, our principle trader has over 20 years’ experience in stocks, ETF’s, and Forex. Hence each trade setup might have different hold times, entry or exit conditions, and will vary from the post/idea shared here. You can use the information from this post to make your own trading plan for the instrument discussed. Trading carries a risk; a high percentage of retail traders lose money. Please keep this in mind when entering any trade. Stay safe.

CONSENSUS MECHANISMS - PoW vs PoS Hey, Alkalites! If you want to invest in cryptocurrencies and know how to recognize long-term opportunities, you should start learning the technology behind them.
Do you know what a consensus mechanism is?
Consensus decision-making is a process in which group members agree to support a decision in the best interest of the whole.
In other words, this mechanism is used to govern the blockchain behind each asset. Usually, this consensus is necessary to confirm the validity of the transactions that take place in that network.
The most common consensus mechanisms are PoW (Proof of Work) and PoS (Proof of Stake).
PoW is used to determine how the network can be sure that the transaction is valid and that someone is not corrupting the network, for example, with double-spending. The Proof of Work is based on advanced mathematical formulas called “cryptography”. That is why the name "cryptocurrency" was invented.
All miners compete looking for a solution to the mathematical problem. The first miner (or pool of miners) to solve the block problem receives a reward, the block is created and transactions are included. Examples are BTC and ETH.
PoS uses a process by which contributors to the system earn commissions from transactions. To validate the transactions, the user must put their coins in a wallet that freezes the coins. The more you stake, the more you earn.
If someone tried to hack the network or process malicious transactions, he would lose all of his participation, since it would affect the integrity of his wallet. Also, it encourages holding the tokens, which is good for the value. Examples are Algorand and Cardano.
Do you have any question? Let me know!
Have a great Sunday, Alkalites!

How to Combine Day Trading with a Full-Time Job?There is an opinion that day trading is not suitable for traders, who have a full-time job. I would like to say «yes, you are right» and advise using hourly and daily timeframes for swing and long-term trading. It is the simplest way and it is obvious that swing and long-term trading don’t need so much attention as day trading. But what if we think together about how to combine day trading with your full-time job? Will we solve this task? Let's try!
I want to start from the main point, if we talk about trading in the market available 24/7, we have to find opportunities for day trading! Yes, you won’t be able to catch all price movements during the day, but you can pick the period when you are at home and stay in front of your monitor. It doesn’t matter where are you from. It doesn’t matter when you start your trading session, anyway the market will be able to give you trade opportunities in the period when you are ready to take them.
Yes, 24/7 format has its advantages and disadvantages, but I would like to use 24/7 format as the main advantage for building a plan for day traders who have a full-time job. Just think about several hours which you can spend for day trading.
The next thing is, you have 24 hours per day and many of you 2 days off per week. How should you use these hours effectively? We have to plan a day properly in order to get free hours for day trading.
How do you spend 24 hours? Ask yourself and describe your average day hour by hour.
It can be something like that:
- 8 hours you spend for a rest
- 1-2 hours you spend for a road to/from your job
- 8 hours you spend for your full-time job
As a result, you spend 17-18 hours for a good rest and your full-time job.
And now, I have a very important question - How do you spend other 6-7 hours each day???
Many of you just blow these hours doing useless things.
But these 6-7 hours per day are your resource which you have to spend effectively!
The part of these hours you spend with your family and doing home tasks. Yes, it is amazing and you have to do it like that! But is it possible for you to take 2-3 hours from that 6-7 hours for learning about day trading and for day trading?
Is it possible for you to spend 2-3 hours per day doing the job, which can give you financial freedom in the future??? I think the answer should be «YES, IT’S POSSIBLE!»
IF you have to work 10 hours per day or spend more time with your family and doing home tasks, and you don’t have 2-3 hours… okay, there is an option for you! Use 1 hour per day in order to learn how to day trade properly and use WEEKENDS for active day trading! Yes, it is a solution, not the best, but it is possible to do it like that!
And another point is about how many hours you have to spend per day on day trading.
There is an opinion that day trading has to take all your time and you have to watch for the price action 10-12 hours per day! No, it is a stupid idea!
I would recommend having trade sessions for something like 1-4 hours and not more. Why? Just in order to avoid overtrading and keep high concentration on trading. You can be concentrated for several hours but obviously, it is impossible to keep enough concentration during 6-8 hours in a row. That’s why you should use short sessions for active trading.
Different markets will be able to give you several trade opportunities per day. Short trade sessions like 1-4 hours will allow you to open positions, manage, and close them. In many situations, 1-4 hours will be enough not only for trading but also for making notes about your trading!
So, if we combine all ideas above, we will have the following:
- when you start day trading, focus on getting knowledge first of all.
Spend 1-3 hours per day reading stuff about day trading, watching videos, communicating with experienced traders.
- when you get the main knowledge about day trading, start adding paper/demo trading but keep getting new knowledge and experience from other sources and traders. In this period you can spend 1 hour on trading and 1-2 hours on learning.
- when you are confident in your knowledge, you have enough experience, you can focus on trading more and spend 1 hour per day or weekends for getting additional knowledge and experience.
This plan will be workable for the majority of traders who have a full-time job but want to become day traders in the Crypto market.
If you are from those people, who can’t afford 2-3 hours per day for day trading, optimize the plan for weekends.
IF you have to work 10-12 hours per day and you don't have days off - well, my advice will be to change your job!
As you can see, day trading can be combined with your full-time job and what you really need for doing it - YOUR WISH!
I hope this post gives you better ideas on how to plan your day more effectively and move forward to your goals!
The next post will be about the reasons WHY day traders fail! Please, support my work by your LIKE's and comments and I will publish a new post within 1-2 days.
Thanks for your attention!

Clean S/R Flip of Previous Range Highs - Crypto BullishWatching Total 2 closely for alts to continue further upside.
Looking for a clean S/R flip of the previous range highs.
Currently Looking Good!, forming a nice symmetrical triangle as well.
We need to be cautious of a fake out to downside, but mainly looking for the apex of the triangle to hold to confirm that bulls are in control for a break to the upside.
If we can break out on this alt coins will continue much high upside!
4 hour chart Below -
Looks real clean on this.
I think alts are getting ready to go again when/if this breaks to the upside.
Let me know your thoughts in the comments below!
#bitcoin
#eth
#420Investments

Day Trading - The Way to Financial FreedomWhat’s is Day Trading?
In a few words, day trading is a trading approach when you open and close trades within the borders of a single day.
Of course, such a trading approach gives traders a lot of amazing opportunities as well as it requires good knowledge, experience, and discipline. I want to share with you my point why day trading should be in the trading arsenal of every trader who wants to get a stable income for living and diversify a trading portfolio.
What are the benefits of Day Trading?
1. You can get trades in different market conditions. The market can be bullish, bearish, or in a range - as a day trader you can trade in all these conditions. For the crypto market, it is an obvious advantage when the market becomes bearish and you can’t trade profitably as a swing or a long-term trader.
2. You trade within the borders of a single day and it means you control all your trades. You close your trades and sleep well, without thinking how the market will move during the night. The same goes for situations when you are not at your laptop but you have active trades.
3. A lot of trade opportunities which markets give you every day. You can pick the most interesting and strong which perfectly match your trading style.
4. More trades mean better income you can get from the market. If we compare day trading with swing and long-term trading, we will see that day trading is a much more profitable approach. It is possible to make 1-5% per day as a day trader when a swing trader will dream about 10-20% per month. As for investors, they focus on 20-30% annual income.
5. More trades give you more experience and knowledge. It means you improve your trading much faster using new experience and knowledge. Day trading can highlight the strong and weak sides of your personality as a trader. You have an opportunity to improve yourself and it will need less time than if you were a swing/long-term trader.
6. More income from day trading means less capital you need to start from. You can start from 100$, turn it into several thousand, and for many of you this capital will be more than enough for your day trading. You will be able to generate enough profit for living trading with 3000-5000$. For swing trading, you will need 20 000 - 50 000$ and for investing it will be better to have 100 000$.
7. The path to your financial freedom is shorter with day trading. If you want to become a full-time trader and you don’t have good capital - day trading is the best choice.
8. Day trading keeps the motivation to move forward to your goals. You see feedback from your activity in real-time. With swing and long-term trading, you need to wait for days, weeks, and months in order to get a result. Sometimes it is boring! With day trading you have emotions every day and it is cool!
9. Day trading in combination with swing trading/long-term trading / Algo trading can give you a system with very strong risk diversification and smart money management. In this model, day trading will be responsible for short-term income which can be invested in other activities.
10. Day trading is the best way to build your brand and an audience. People like action, emotions, and day trading can produce catchy content for them. It gives you an opportunity to start your own business in the Financial field and do cool things together with interesting people!
There is an opinion that day trading = gambling!
NO! DAY TRADING IS NOT GAMBLING!
It is a trading approach that gives high profit not because of ignoring rules of proper risk and money management, but because of leverage and a high number of trades per day, week, and month.
Definitely day trading worths your attention. It is an opportunity for you to boost your trading in a shorter period of time, get everything you need for profitable trading, gain a lot of trading experience. Day trading is the best approach that can help you become a full-time trader even if you don't have solid capital. As you can see, there are many reasons to try day trading.
For many traders, day trading looks impossible because of a full-time job. But I have ideas how you can combine your day trading with a full-time job. Do you want to read about it? If yes, please support this post with your LIKEs and comments and I will write a new post within this week.
Thanks for your attention!

The greatest teacher, failure is.Why I add drawings to my TA - mostly as I have time and enjoy entertaining on serious topics. Brighten up the world of @TradingView for you guys.
In the recent months since the Rocket call - (BTC Drop to 30k from 60k+) its been a slow steady burn on the weekly 3-4 move in terms of Elliott Wave. I have spent the time putting together some educational content as well as some of the defined logic for the drop itself, the moves down and of course the current situation.
If you haven't been following the post, here are a few to help you along.
1) Elliott Roadmap (click the image for a link to the post)
This is how it's playing out;
2) Wyckoff Distribution - during the move down, many people turned to "Wyckoff" as it was widely publicised by the media and the usual crypto GURU. The irony was, back in March they all had it as Re-Accumulation.
(Click image for link to post)
Taken this further and into stage 2 of the basics;
(Click link)
-------------------------------------------------------------------------------------------------------------------------------------------
3) I have written on the topic of assessment of alt coins, crypto in general and buying the dips. (click on the links again for posts)
-
-
-
-------------------------------------------------------------------------------------------------------------------------------------------
4) Streams; Myself or @Paul_Varcoe put out daily streams, Paul usually does the 10:30 AM (UK Time) and myself the 3:30 PM (UK Time) Recently we have been talking about the length of time, expectations and logic supporting the moves and dynamics.
www.tradingview.com
www.tradingview.com
Paul's stream are done as a viewers request series, so go ask him what you want.
If you dedicate the time to read through these articles above and watch the couple of streams posted here. It will all make sense, feel calm like Yoda. Enjoy your trading!
Disclaimer
This idea does not constitute as financial advice. It is for educational purposes only, our principle trader has over 20 years’ experience in stocks, ETF’s, and Forex. Hence each trade setup might have different hold times, entry or exit conditions, and will vary from the post/idea shared here. You can use the information from this post to make your own trading plan for the instrument discussed. Trading carries a risk; a high percentage of retail traders lose money. Please keep this in mind when entering any trade. Stay safe.

How to Make $1000 a Day?
Hi, In my mind, small variations are very important.
What do you need (to Make $1000 a Day or $ 30k per month, $ 360k yearly)?
- Just one successful trade per day (1*case-1 or 2*case-2).
How?
- Increase your chance of making a successful trade.
Remember: Past makes future.
Regards
BTC-XLM

BTC - what is it?//Let us have a discussion.Since we know what bitcoin is(read on the graph) we can talk about it.
I have concerns about bitcoin. Let us discuss them(but in a calm discussion).
1) The fundamental aspect of institutionless transactions(no trusted party)
"As such, the verification is reliable as long as honest nodes control the network" It means that we must trust everybody else (trusted party)? Isn't it better to trust a legal entity like a bank than bitcoin holders?
"if the attacker doesn't make a lucky lunge forward early on, his chances become vanishingly small as he falls further behind" What about people who saw the "potential" of bitcoin early when it was cheap?
What about the inventor? We don't know who he is? Maybe he has done something to be the attacker in the future? Is not he a trusted party?
2)The price of the bitcoin
Since the only purpose of bitcoin is to eliminate the transitions fees the max price for bitcoin is ~5000$/it means that bitcoin is a bubble(it may grow until the whole economy will cost less).
3)The jobs in the sector of transactions(640 million $ are there)
4)Legislation
Since there is almost none of it, bitcoin is used for criminal purposes.
5)Mt. Gox.
All of it is risk -> high risk means high profit or loss.
What do you think?

Heikin-Ashi system caught the bitcoin move spot on If you were trading my Heikin-ashi system during this bitcoin accumulation zone, this would’ve been a perfect long opportunity.
All signs were directed towards a bull run.
Bullish heikin-ashi doji formed after an impulse leg down, a bullish fractal appeared on the bullish hammer candle that started the move. The stochastic was in an oversold range and started to head up on the heikin-ashi doji.
With a system, always make sure that all signs are ticked before making a trade, in this trade all signs were ticked and therefore this would be a good trade to make at the time. Discipline is key and do not enter trades if something does not feel right about the price action or your system does not fully follow.

#ALTCOINS - Market Update, Can alt coins keep pushing?Previous Total2 Post See Here -
Hey Guys,
420 Investments back again.
So I'm sure everyone is thinking can alt coins continue pushing or is this a relief ralley?
well that's take a look at total2 to see what's really happening.
Daily Time Frame Analysis -
Daily Rsi Divergence Can Be found found
Liquidity Tap into High time Frame Support
Most Recently we have claimed the golden pocket ratio back after the sell, this is bullish behaviour for the altcoin market.
We Retested the 0.618% fib yesterday, giving us confidence and confluence that this is indeed not a relief rally and alt coins have plenty of room to keep growing!
The weekly chart also shows us that there was a weekly swing failure reversal pattern, which simply means alt coins have failed to continue to swing down.
Showing this high time frame reversal alt coins across the board should have some fantastic gains, as we have recently been seeing.
We have some resistances to break through along the way as well which you will find on the chart
I believe the alt coin market cap has much higher targets! and plenty of room left for growth!
Let me know your thoughts in the comments below, thanks for the support!
#420Investments
#420Family

5 Min Trading How to Identify SMS on a High Time FrameIn this 5 Min Vid...
We are identifying how to place your SMS lines to identify SMS ie...posibility of trend change on a high Time frame.
On a low time Frame this is consider a stop hunt.

THE TREND IS YOUR FRIEND,BUT HOW TO ACCURATELY DETERMINE THE WINMany of us have been taught that the trend is our friend and we should trade in the direction of the trend.As we have eventually discovered this is easier said than done.I am a Mechanical Engineer by profession so i was inclined to find an excellent way to determine the trend of a market,forex currency pair, cryptocurrency pair or a stock.

EDUCATION - TOP REVERSAL PATTERNS ⚡At the end of a trend, there is a typically a reversal pattern indicating to us that the trend is about to reverse. There are 3 main patterns that you NEED to know.
1. Double Top/Double Bottom
A double top/bottom pattern is a chart pattern that consists of 2 consecutive peaks of similar height indicating that there is not enough buying/selling pressure to surpass the extremes of the price. This leads to a reversal in trend.
Double top is a bullish to bearish trend reversal.
Double bottom is a bearish to bullish trend reversal.
For a safe entry, entry would be after the break of the neck line (the last swing point) which is a confirmation that the it is a valid double top/bottom pattern.
Double Top:
2. Rising Wedge/Falling Wedge
A rising/falling wedge is a chart pattern that occurs when price is making higher highs and higher lows (in an uptrend – rising wedge) and lower lows and lower highs (in a downtrend – falling wedge). As the pattern progresses in the wedge, the range of the price contracts and is confined between 2 lines which get closer. Price eventually breaks out of the wedge and creates a reversal.
Rising wedge is a bullish to bearish trend reversal.
Falling wedge is a bearish to bullish trend reversal.
For a safe entry, wait for a breakout of the wedge to confirm the validity of the wedge pattern.
Rising Wedge:
3. Head & Shoulders/Inverse Head & Shoulders
A head and shoulders pattern is a chart pattern that appears as a baseline with three peaks. The outside two peaks (shoulders) are close in height and the middle is highest.
A normal head and shoulders is a bullish to bearish trend reversal.
An INVERSE head and shoulders is a bearish to bullish trend reversal.
For a safe entry, it is often advised to enter on the break of the neckline as that would be confirmation of the head and shoulder pattern.
Inverse Head & Shoulders:
Do your best to find them in your analysis!
