Boom And Bust Cycle of BitcoinGreetings, esteemed members of the @TradingView community and all Vesties out there!
The financial markets is a complex and dynamic arena where investors seek to capitalize on opportunities and generate profits.
One recurring phenomenon in the financial world is the "boom and bust cycle", characterized by periods of rapid asset price escalation followed by sudden and often dramatic declines. Understanding this cycle is crucial for investors to make informed decisions and navigate market volatility effectively. In this article, we will delve into the life cycle of a bubble within the context of the financial markets, using the Bitcoin price chart as a compelling example. Additionally, we will explore how Bitcoin's circulating supply contributes to its perceived value.
The Anatomy of a Bubble:
A bubble refers to a speculative phase during which the prices of assets, such as stocks or cryptocurrencies, soar to unsustainable levels fueled by investor euphoria, media hype, and the fear of missing out (FOMO). These bubbles are often followed by a sharp correction or crash, resulting in significant losses for those caught up in the frenzy. The cycle typically consists of four key phases:
a) Stealth Phase: Prices begin to rise slowly, driven by fundamental factors or innovative breakthroughs. Initial interest is limited, and only a few astute investors take notice.
b) Awareness Phase: Media coverage and public attention increase as prices gain momentum. More investors start to notice the rising prices and may begin to invest, contributing to further price appreciation.
c) Mania Phase: FOMO sets in as a growing number of investors rush to buy the asset, driving prices to astronomical heights. Speculative behavior dominates, and valuations become detached from underlying fundamentals.
d) Blow-Off Phase: The bubble reaches its peak, and prices begin to plummet as profit-taking and panic selling ensue. The market experiences a rapid decline, erasing gains made during the boom phase.
Bitcoin's Boom and Bust Cycle Example:
Bitcoin, the pioneering cryptocurrency, has experienced multiple boom-bust cycles since its inception. One particularly notable example is the bubble of 2016-2017-2018 period:
a) Stealth Phase: Bitcoin's price had been steadily increasing due to growing interest and adoption within the tech and financial communities.
b) Awareness Phase: Media coverage intensified, drawing mainstream attention to the soaring Bitcoin prices. Retail investors started entering the market.
c) Mania Phase: The price skyrocketed to nearly $20,000 per Bitcoin, fueled by widespread FOMO. New investors poured money into the market, believing the rally would continue indefinitely.
d) Blow-Off Phase: The bubble burst, and Bitcoin's price tumbled, ultimately losing over 80% of its value. Many inexperienced investors who bought at the peak faced substantial losses.
The Role of Bitcoin's Circulating Supply:
Bitcoin's circulating supply, the total number of coins available for trading in the market, plays a crucial role in shaping its perceived value. The scarcity of Bitcoin is often cited as a driving factor behind its price appreciation. With a fixed supply of 21 million coins, the principle of supply and demand suggests that as demand for Bitcoin increases, its price should rise over time.
a) Halving Events: Approximately every four years, Bitcoin undergoes a "halving" event, where the rate at which new Bitcoins are mined is cut in half. This scarcity-inducing mechanism further accentuates the notion of limited supply, potentially driving up prices.
b) Investor Perception: Investors often view Bitcoin as a store of value and a hedge against traditional financial markets. As this perception grows, demand for Bitcoin increases, putting upward pressure on its price.
Understanding the life cycle of a bubble is essential for investors to make informed decisions and mitigate the risks associated with market volatility.
By examining the case of Bitcoin's boom and bust cycle and considering the impact of its circulating supply, we gain valuable insights into how market dynamics and human behavior can shape asset prices. As the financial world continues to evolve, these lessons remain relevant, serving as a reminder of the importance of rational investment strategies and a clear understanding of market fundamentals.
Bitcoin (Cryptocurrency)

Mastering Liquidity in Trading: Unraveling the Power of SMC 🔥Liquidity is what moves the market. Liquidity and liquidity pools are created and targeted by the markets and a lack of understanding on this topic is the main reason why the trading mind fails even if the analyst mind is correct. Traders who have been victim to their stop losses being taken by a wick before price running in their favour are the perfect example of having the correct analytical mind but a weak trading one.
Liquidity is unlike an order block or price inefficiency or anything else that can be physically identified on a chart. It is invisible, however, it is still possible to identify without the need of indicators or anything other than price action alone.
Simply put, liquidity is money in the market. Typically, this money comes in the form of retail orders and stop losses. Knowing this allows us to understand that if the market targets liquidity, and liquidity comes in the form of retail stop losses, the market must be hunting and going against retail strategies.
🟢The first and most prominent of these retail strategies is the idea of support and resistance. On the chart we can see an example of what retail traders would refer to as a level of resistance. In doing this they would short price from this level expecting a move down. This creates a liquidity pool just above this ‘resistance level’ where the average retail trader would place their stop losses. This liquidity pool is now a target for the market. So instead of trading this move down, we wait for the liquidity grab and use the rest of this strategy to capitalise on the bearish move that we can expect.
On the Chart is a demonstration of the market hunting liquidity before making its next move. Again this is where traders would be correct in terms of bias but incorrect in terms of trading.
This is an example of what an informed chart looks like. Instead of highlighting support and resistance levels, we highlight equal lows and equal highs respectively. Equals are usually in the form of otherwise referred to double tops or double bottoms but can also be more than that. The key difference, however, is that we would anticipate the market hunting the liquidity above the equal highs and below the equal lows. Due to this, we avoid being a victim to the market stopping us out by a wick and falling in our direction.
The second most prominent retail strategy or idea is the trend-line. Every time a trend-line formation is present within the market, we can now understand the amount of stop losses and, therefore, liquidity that would be sitting under this ‘trend-line’.
Above is an example of the importance of recognising trend-line liquidity. Once the liquidity above the equal highs has been hunted, we need to establish the next liquidity pool in the market. Seeing a break above the ‘resistance level’ would be seen as a ‘bullish breakout’ by the average trader. However, we can identify that as a liquidity purge and higher high, in which case we can expect a higher low to be made - which would mean a bearish retracement.
On top of this, we can see a build up of trend-line liquidity just above the discount end of the parent price range. This gives us an added confluence and confidence in the fact that we can expect lower prices with the liquidity underneath the trend-line as our first target.
Above is an example of liquidity being grabbed on the bullish side (above the equal highs) sending the uninformed trader long based off of a ‘bullish breakout’, then hunting the liquidity on the bearish side (below the trend-line) and sending the uninformed trader short based off of the break of the trend-line. This is typical of the market - it shakes out impatient and uninformed traders on both sides of the market before making the actual move.
Here is another examples of how trendline liquidity gets purged by the market. On the chart we can see a trend-line where many traders would be longing the market, unaware that they will be victims of a liquidity purge.
Below we can see that liquidity purge below the trend-line which would send the average trader short. Using the rest of the strategy, we are able to understand that price will react from specific levels to go long
Below we can see the completion of this market cycle with our levels being respected and the real bullish leg being made.
🔥🟠🔥🔥🟠🔥 BONUS CHEATSHEETS👇👇👇👇

News-Based Trading: How News Acts as the Best Indicator Beginners diving into the dynamic world of cryptocurrency trading often find themselves influenced heavily by news. Eager to anticipate trends and, obviously, earn big, they hang on to every piece of information. Here’s the twist: trading based on news, more often than not, ends in heartbreak and empty pockets. 📉 But what’s the reason?
🔑 KEY QUESTIONS:
How can you navigate cryptocurrency trades using news?
Can news truly be an effective indicator for cryptocurrency moves?
Delving into the ripple effect of news on the crypto sphere.
Crafting a winning strategy: Navigating news-based cryptocurrency trades.
News: The Puppeteer Behind the Scenes🎭
On the surface, news might look like the golden compass for predicting market moves. However, the waters run deep. Big sharks - those with hefty wallets - often use news as their puppet strings to control the market. They capitalize on the knee-jerk reactions of retail traders. 🎣
Imagine: A piece of unfavorable news is released. Retail traders, gripped by panic, rush to sell their cryptocurrency, hoping to minimize losses. This is when the big players snatch up large amounts of cryptocurrency at bargain prices. Suddenly, the market takes an unexpected turn, soaring high, leaving those sellers scratching their heads in confusion. 🚀
On the flip side, when the headlines scream positive news, the actual price movement might surprise you. The real game-changer isn’t the news per se, but how traders respond to it.
1. Elon Musk & Bitcoin: When Musk revealed Tesla's embrace of Bitcoin, charts showcased this at the pinnacle of the market. Yet, the aftermath? A staggering 50% plunge. 😲
2. Salvador's Bitcoin Move: Despite the buzz and optimism around Salvador adding Bitcoin to its reserves, Bitcoin's price took a surprising dip. 📉
3. Meme Crypto’s Grand Debut: Post the grand showcase of the meme crypto, Shiba Inu, at Times Square, its value dwindled. The euphoria surrounding this news turned to disbelief as Bitcoin dropped by a whopping 70%, with altcoins plummeting by 90%. 😵
These narratives underline the power of news in the cryptocurrency arena, not always for the right reasons. News might ignite fear or trigger euphoria, but it's vital to stay grounded. 🧘 Recognizing the potential manipulative tactics of major players is key. Equipping oneself with a robust trading strategy and a sound risk management plan is your armor against the tumultuous world of cryptocurrency trading. 💡🛡️

The 4 Tips Often Overlooked by BeginnersGreetings, esteemed members of the @TradingView community and all Vesties out there!
Let's explore four timeless pieces of advice that beginners tend to overlook and why we should give them closer attention.
1. Manage your expectations.
Some newcomers fall into the trap of unrealistic expectations, drawn in by "get rich quick" schemes that initially sparked their interest in trading.
Beginner traders may anticipate similar returns to those promised in trendy strategies or TikTok videos, often without fully grasping the methods to achieve those profits.
Consistently profitable traders understand that success in trading requires more than just blindly following "profitable" traders on social media.
It takes time, discipline, and dedication to develop a trading system that suits your personality and the ability to adapt it to varying market conditions.
2. Simplicity is key.
Discovering a multitude of user-friendly education websites (with none better than TradingView, of course) can be enticing, especially when they offer a variety of indicators and trading systems.
Novice traders may find comfort in using fancy indicators and systems, ones that seem to be favored by the "pros," but without proper testing or practice, these technical tools can lead to mixed signals and confusion.
A wise approach is to start with price action and gradually incorporate indicators as you become more comfortable with their functionality.
3. Prioritize risk management.
Both beginners and experienced traders might envy those who achieve substantial gains, often overlooking the complexities behind their success.
While certain trading techniques can yield significant profits, they also carry the risk of wiping out an account in an instant.
Remember, even a good trade idea can turn sour if risk and trade management are neglected.
Proper risk management is crucial for maintaining longevity in the trading game and acquiring the skills needed to become consistently profitable.
4. Stick to your plan.
Trading novices are particularly susceptible to the psychological stresses of the market. Without trading confidence, they are more likely to deviate from their trading plans, even if the odds seem favorable.
Consistency is key in this aspect. After all, what you don't measure, you can't manage or improve upon. Without consistency:
• The trader won't learn how to adapt their system to changing market conditions.
• The trader won't cultivate the right mindset to handle losses, stay focused, and prevent emotional reactions.
• Inconsistent execution can skew the system's expected outcomes, leading to potentially worse results.
Don't hesitate to seek help and learn from a community of traders to avoid repeating the mistakes made by those who have walked your path before.
We would greatly appreciate your feedback on the article! Please feel free to share your thoughts and opinions in the comments section below.

Using Heikin Ashi and MS-Signal Indicatorshello?
Traders, welcome.
If you "Follow", you can always get new information quickly.
Please also click "Boost".
Have a good day.
-------------------------------------
(1h chart)
The biggest disadvantage of trading using moving averages is that it is not easy to identify support and resistance points.
To compensate for this to some extent, we looked at how to add and utilize Bollinger bands and StochRSI indicators.
The 150 moving average is an important moving average in utilizing the moving average.
This 150 Moving Average can be applied and utilized on any time frame chart.
The next possible moving average combinations are 5 and 26, 26 and 50.
Time frame charts suitable for utilizing the 26 and 50 moving averages can be utilized on charts under the 15m chart.
The reason is that it is a time frame chart with too fast volatility.
For other time frame charts, i.e. 15m charts and above, you can use a combination of 5 and 26 moving averages.
I have written down the names of the indicators displayed on this chart.
5 The indicator corresponding to the moving average corresponds to the Heikin Ashi indicator.
26 The indicator corresponding to the moving average corresponds to the MS-Signal indicator.
Therefore, when the 5 moving average crosses upward from the 26 moving average, that is, when a regular arrangement is made, it is time to buy.
As such, when the Heikin Ashi indicator breaks above the MS-Signal indicator, it is time to buy.
The good thing about using the MS-Signal indicator and the Heikin Ashi indicator is that you can see the breadth along the trend.
The thicker the width, the stronger the role of support and resistance.
Thus, it provides more confidence in direction than a single line, such as the 5EMA indicator on a 1D chart.
And, you can also tell if a trend reversal is taking place or not.
This change is indicated by the color change of the MS-Signal indicator and the width of the Heikin Ashi indicator.
The transition of the MS-Signal indicator from downtrend to uptrend is indicated by the transition from red to blue.
Conversely, a transition from an uptrend to a downtrend is indicated by the transition from blue to red.
The Heikin Ashi indicator transitions from blue to orange for a downtrend to uptrend and orange to blue for an uptrend to bearish transition.
This change in appearance can be useful when conducting transactions.
The M-Signal indicator on the 1D, 1W, and 1M charts and the 5EMA indicator on the 1D chart are very useful when conducting day trading.
Therefore, it is recommended to activate it and check the movement during day trading.
The M-Signal indicator on the 1D chart works similarly to the 26 Moving Average.
Therefore, the short-term trend of the 1D chart can be intuitively identified by the 5EMA indicator on the 1D chart and the M-Signal indicator on the 1D chart.
Therefore, it can be very useful if you trade using tradingview brokers.
(1D chart)
Also, if you mark the M-Signal indicators of the 1W and 1M charts on the chart, you can intuitively know the mid- to long-term trend, so you can complete the chart analysis faster.
-------------------------------------------------- --------
With this, we learned how to trade using moving averages and indicators that are more valuable than this.
Chart analysis is only one part of the process to trade after all.
No matter how good your chart analysis is, if you don't come up with a good trading strategy, you will end up with losses or small profits.
---------------------------------------------------------------------------------------------
** All descriptions are for reference only and do not guarantee profit or loss in investment.
** Even if you know other people's know-how, it takes a considerable period of time to make it your own.
** This is a chart created with my know-how.
---------------------------------

Correlation between different assetsCorrelation is a measure that establishes the degree of relationship between different assets. It is measured on a scale of +100% to -100%.
In the case of a +100% correlation (perfect positive correlation), both assets move in an identical manner in the market. Conversely, if the correlation is -100% (perfect negative correlation), we are talking about two assets that move in an exactly opposite manner.
Correlation is a crucial measure to consider because not being aware of the correlations between assets could inadvertently increase our risk. For example, if we open a sell position in NDJPY and another with the same lot size in NZDUSD based on an analysis conducted on the 4H timeframe, we would be multiplying our risk by 2 due to the high correlation between both assets in that timeframe (88%). The correct way to handle this situation may be to either reduce the risk of both trades by half or only trade the pair with a clearer scenario in your analysis.

Andrews' Pitchforks are FunHere's an example of a pitchfork drawn on the 2 weekly BNC:BLX chart, measured from the March 2020 low to the Nov 2021 high and completed at the Nov 2022 low, and then extended in direction and levels (up to 9 levels can be added).
The chart above makes for a solid example of how pitchforks can be used to derive a trend or channel and find solid support and resistance levels within it. They are also just fun to work with!
There are several types of pitchforks which can be tested until you've found one that works best for your chart. They are called Andrews' Pitchforks because they were originally developed by Alan Andrews, with several derivatives created by modifying calculation for the placement of the pitchfork's handle (the slope of its median line):
Normal Pitchfork - Andrews' original pitchfork tool.
Schiff Pitchfork - moves start of the handle line halfway to the base of the channel.
Modified Schiff Pitchfork - handle start is adjusted by a distance equal to half the difference between price values of its first two points (first low and high, or first high and low) of three.
Inside Pitchfork - handle adjusted to half of the vertical & half of the horizontal distance between the first two points of three.
In the example above, I chose a Modified Schiff Pitchfork , and then identified 3 points of consecutive highs and lows. In this case: low -> high -> low. You can choose to do the opposite of this and start from high -> low -> high, typically your first point should represent the beginning of a new trend.
Play around with trying this in different timeframes, and also try editing / adding / removing levels. You can try basic levels at increments of 25% or by utilizing classic Fibonacci levels (or both, as shown above).
Pitchforks are a type of Fibonacci tool, so I like using classic Fib levels. You could just use the Fibonacci Channel tool and get a similar result. But, the nice thing about utilizing a pitchfork is that it can help you identify a channel that may not be immediately obvious.
Here is another example of using a Modified Schiff Pitchfork to derive trends on a popular altcoin, BINANCE:HBARUSD :
Thanks for reading, I hope this was helpful to you. I learned more about pitchforks myself while working on this, and encourage others to do the same!

Key Interpretation Methods of CCI IndicatorsHello?
Traders, welcome.
If you "Follow", you can always get new information quickly.
Please also click "Boost".
Have a good day.
-------------------------------------
The CCI indicator, which is included in the 'Strength' indicator, now displays only the oversold or overbought zones.
Accordingly, it seems that there will be difficulties in understanding the indicators, so we took the time to give reinforcement explanations.
The CCI setting I use is 150.
Accordingly, it is utilized to see the flow of the mid-term and above.
The basic source value of CCI is (high + low + close) / 3.
Accordingly, we added the 150 SMA line and the CCI indicator as a secondary indicator.
If it rises a lot from the 150 SMA line, the CCI value rises above +100.
When it rises above +100, it is interpreted as entering the overbought zone.
Entering the overbought zone like this means that there is a possibility that it will exit the overbought zone in the near future.
However, while it is in the overbought zone, it also means that the force to rise is just as strong.
Accordingly, it is the basis for conducting transactions by identifying support and resistance points or sections.
Conversely, if the price drops a lot from the 150 SMA line, the CCI value will fall below -100.
Similarly at this time, when the CCI breaks out of the oversold zone, it enters the sideways zone, providing a basis for trading.
When the CCI is between -100 and +100, prices move sideways.
It is not easy to analyze with only the CCI indicator when it is in the sideways section with the CCI indicator.
Therefore, with the CCI indicator, it is recommended to find the basis for trading when entering and exiting the overbought section (CCI +100) and oversold section (CCI -100).
Since you can check the overbought and oversold sections of the Bollinger bands and CCI shown in this price chart, I think it is a good idea to use it together with the Bollinger bands.
It is quite difficult to create a trading strategy based solely on indicators like these.
Therefore, it is important to create a trading strategy by making sure to set support and resistance points on the price chart and see if the indicators are supported or resisted at those support and resistance points or intervals.
The setting value of Bollinger Bands used in this chart is 60.
-------------------------------------------------- -------------------------------------------
** All descriptions are for reference only and do not guarantee profit or loss in investment.
** Even if you know other people's know-how, it takes a considerable period of time to make it your own.
** This is a chart created with my know-how.
---------------------------------

Diversification in Cryptocurrency InvestingIn the evolving world of finance, cryptocurrencies have carved a unique niche, attracting investors worldwide due to their potential for high returns. With over 6,000 cryptocurrencies in existence as of mid-2023, investors have a multitude of choices when building a crypto portfolio. However, the inherent volatility of the crypto market also means a higher degree of risk. One way to manage this risk is through portfolio diversification. This comprehensive guide will delve into the principles and strategies of diversification in the context of cryptocurrency investing.
Understanding Diversification
Diversification, in financial parlance, is the practice of spreading investments among different types of assets to reduce risk. The primary purpose is to limit exposure to any single asset, thereby mitigating potential losses. As the saying goes, "Don't put all your eggs in one basket."
When applied to cryptocurrencies, diversification entails spreading investments across a variety of crypto assets. Given the high volatility and unpredictability of the crypto market, diversification doesn't completely eradicate the risk. However, it does offer a certain degree of protection against the extreme price swings characteristic of individual cryptocurrencies.
Importance of Diversification in Crypto Investing
The need for diversification in crypto investing stems from the market's inherent volatility. Due to factors such as regulatory news, technological advancements, market sentiment, and macroeconomic trends, crypto prices can fluctuate wildly within short periods. While this volatility can provide opportunities for significant gains, it also exposes investors to substantial losses.
A diversified portfolio helps to mitigate these risks. If one cryptocurrency in the portfolio experiences a significant decline, the impact on the entire portfolio may be cushioned by other cryptocurrencies that remain stable or increase in value.
Diversification Strategies in Cryptocurrency Investing
A well-diversified crypto portfolio involves more than holding an assortment of cryptocurrencies. It requires a strategic approach that considers various factors such as the types of cryptocurrencies, token sectors, blockchain ecosystems, investment strategies, and balancing crypto and non-crypto assets.
Types of Cryptocurrencies
There are thousands of cryptocurrencies available for investment, each with its unique features, use cases, and market behavior. A diversified portfolio could include a mix of the following:
- Bitcoin (BTC): As the first and most prominent cryptocurrency, Bitcoin often forms the foundation of many crypto portfolios.
- Ethereum (ETH): Known for its smart contract functionality, Ethereum is another major player in the crypto world.
- Altcoins: These are alternatives to Bitcoin and include a wide range of cryptocurrencies like Litecoin (LTC), Ripple (XRP), Cardano (ADA), and many others.
- Stablecoins: These are digital tokens designed to minimize volatility by pegging their value to a reserve of assets, usually a fiat currency like the U.S. dollar.
Token Sectors
Investing across different token sectors offers another level of diversification. Some of the main categories include:
- Decentralized Finance (DeFi): DeFi projects aim to emulate traditional financial systems in a decentralized manner. This sector includes cryptocurrencies related to lending platforms, decentralized exchanges, and yield farming platforms.
- Non-Fungible Tokens (NFTs): These are unique digital assets that represent ownership of specific items or pieces of content on the blockchain.
- Utility Tokens: These are tokens used to access services within a specific blockchain ecosystem.
Blockchain Ecosystems
Investing in various blockchain ecosystems is a powerful diversification strategy. Each blockchain has its unique features, community, and associated tokens. By investing across multiple blockchains, you are effectively spreading risk and potential rewards across various platforms. Some of the prominent blockchain ecosystems include Ethereum, Binance Smart Chain, Polkadot, Solana, and Cardano.
Diversification through Investment Strategies
Investment strategies also play a significant role in portfolio diversification. Some of these strategies include:
- Holding (HODLing): This involves buying and holding cryptocurrencies for a long time, irrespective of short-term price fluctuations.
- Trading: This involves buying and selling cryptocurrencies based on short-term price movements. This strategy can be further divided into day trading, swing trading, and arbitrage trading.
- Staking: In proof-of-stake (PoS) and its variants, you can participate in the network's consensus mechanism by holding and staking your coins, earning new coins as a reward.
- Yield Farming: This involves lending or providing liquidity to DeFi platforms in return for interest and fees.
Balancing Crypto and Non-Crypto Assets
Lastly, diversification also includes maintaining a balance between crypto and non-crypto assets. Even if you're heavily invested in crypto, it may be wise to hold a portion of your portfolio in traditional assets such as stocks, bonds, real estate, and commodities. This can provide stability during turbulent crypto market conditions and offer returns that are not correlated with the crypto market.
How to Diversify Your Cryptocurrency Portfolio
Step 1: Understand Your Risk Tolerance
Before investing in any asset, including cryptocurrencies, you need to understand your risk tolerance. Ask yourself how much risk you are willing to take and how much investment you are ready to lose without affecting your financial stability.
Step 2: Research Cryptocurrencies
Conduct thorough research on different types of cryptocurrencies. Understand their underlying technology, use-cases, and potential for future growth. This will help you select a mix of coins for your portfolio. You should also stay updated on crypto market trends, news, and regulatory changes as these can significantly affect crypto prices.
Step 3: Choose a Variety of Coins
A well-diversified crypto portfolio should contain a mix of established cryptocurrencies like Bitcoin and Ethereum, as well as promising altcoins. However, you should not randomly select coins. Each cryptocurrency in your portfolio should be backed by thorough research and sound reasoning.
Step 4: Diversify Across Sectors and Ecosystems
Invest in cryptocurrencies across different sectors (DeFi, NFTs, utility tokens, etc.) and blockchain ecosystems (Ethereum, Binance Smart Chain, Polkadot, etc.). This can help reduce exposure to risks associated with a particular sector or ecosystem.
Step 5: Use Different Investment Strategies
Utilize a combination of investment strategies such as long-term holding, trading, staking, and yield farming. Different strategies can help spread risk and maximize returns.
Step 6: Balance Your Portfolio with Non-Crypto Assets
To safeguard your portfolio from extreme crypto market volatility, consider investing a portion of your portfolio in traditional assets such as stocks, bonds, real estate, or commodities.
Step 7: Regularly Monitor and Rebalance Your Portfolio
The crypto market is highly volatile and can change quickly. Regular monitoring allows you to track the performance of your investments and make necessary adjustments. Rebalancing involves adjusting your portfolio periodically to maintain your desired level of asset allocation and risk.
Potential Limitations of Diversification in Cryptocurrency Investing
While diversification is a generally recommended strategy for managing investment risk, it does come with certain potential limitations. Investors must be aware of these aspects when building a diversified cryptocurrency portfolio.
Reduced Potential Returns
Diversification aims to mitigate risk by spreading investments across various assets. However, this approach can also potentially limit gains. If you invest in a wide array of cryptocurrencies, your portfolio may not grow as much when one cryptocurrency experiences a dramatic price increase. Essentially, while diversification helps limit downside risk, it may also cap the upside potential.
Over-Diversification
While having a variety of investments can help to reduce risk, there is such a thing as over-diversification. If you hold too many different cryptocurrencies, it can become challenging to effectively monitor and manage your investments. Additionally, if the number of investments is too large, the positive performance of one asset might be negated by the poor performance of another.
Increased Complexity
Maintaining a diversified portfolio can be complex and time-consuming. Each cryptocurrency needs to be researched thoroughly before being added to the portfolio, and even after the investment, it needs to be monitored continuously. This process can become overwhelming, especially when investing across various token sectors and blockchain ecosystems.
Costs
Diversification can sometimes come with higher costs. If you're trading or transferring your cryptocurrencies frequently to maintain a diversified portfolio, transaction fees or "gas fees" can add up. For small portfolios, these costs might make diversification less effective.
Lack of Correlation Data
In traditional finance, assets are often chosen for diversification based on their correlation. In the cryptocurrency market, however, the relatively short history and high volatility can make it challenging to determine reliable correlation coefficients. This lack of reliable data can sometimes limit the effectiveness of diversification.
Conclusion: Diversifying the Smart Way
Diversification is a powerful strategy to manage the inherent risk associated with investing, particularly in volatile markets like cryptocurrencies. However, successful diversification requires a deep understanding of the crypto market, careful analysis of individual crypto assets, and regular portfolio review and rebalancing.
Diversification strategies should be personalized to fit an individual's risk tolerance, investment goals, and knowledge level about cryptocurrencies. With the rapidly evolving crypto landscape, staying informed and adaptable is crucial to maintaining a diversified and resilient crypto portfolio. Remember, while diversification can mitigate risk, it does not guarantee profit or protect entirely against loss in a declining market. As always, thorough research and due diligence are vital before making any investment decisions.

Where to understand that bear market endedI'll be watching just these line to understand that market structure is broken and new bull is here (+examples)
1. Orange - break and retest for bull
2. White - for bear break and retest 2 times, 3rd one just break down
3. Blue - waiting for break and retest of 1st and 2nd lines for bull

Trading Mindset: The Winning Edge!In the world of trading, strategy, and market knowledge are typically seen as the twin pillars of success. However, this is only part of the picture. The psychological aspect of trading is often overlooked but can be equally, if not more, influential in shaping trading outcomes. This component involves understanding and managing the emotions, biases, and mental states that can impact trading decisions. Emotional decision-making can lead to costly mistakes, such as panic selling during market dips or holding onto a losing trade for too long out of hope or fear. Therefore, it is crucial to cultivate a clear, disciplined mindset for more profitable and consistent trading outcomes. This tutorial will delve into the psychological landscape of trading, providing valuable insights and practical tips to master your mind and, consequently, the market.
Common Psychological Traps in Trading
There are several psychological traps that traders can fall into, which can seriously undermine their trading performance. One of these traps is overconfidence. After a streak of successful trades, it's easy to start feeling invincible, which can lead to riskier trading behaviors and impulsive decisions.
Fear and greed are two more emotions that often dictate trading decisions. They are the key drivers behind market trends and can lead to significant financial losses if not managed properly. The fear of missing out (FOMO) can push traders into hasty, poorly thought-out trades, while greed can create a reluctance to sell even when all signs point to a market downturn.
Another common psychological pitfall is anchoring. This occurs when a trader becomes fixated on specific price points or values, which can distort their perception of a security's true value and hinder rational decision-making.
Understanding Your Trading Emotions
To manage your trading emotions effectively, you first need to understand them. One practical way to do this is by keeping a trading journal. Besides recording your trades and their outcomes, this journal should also note down your emotions and thoughts at the time of each trade. Over time, you may start to see patterns in how your emotions affect your trading decisions.
Knowing your risk tolerance is another crucial factor. Each trader has a different level of comfort when it comes to taking risks, and understanding this can significantly shape your trading strategy. A risk-averse trader might prefer more stable assets, while a risk-tolerant one might be comfortable with higher volatility.
Strategies for Managing Trading Emotions
Being in the right mental state before you start trading is paramount. Developing a pre-trade routine that helps you calm down and focus can prepare you for the trading day ahead. This routine could include activities like meditating, exercising, or going over the latest market news and your trading plan for the day.
Having a clear trading plan can also provide a solid foundation for managing your emotions. This plan should outline your strategy, including risk management tactics, potential entry and exit points, and your objectives for each trade. It serves as a roadmap and can keep you grounded when market volatility triggers emotional responses.
In addition, learning stress management techniques can be invaluable in trading, a field often fraught with stress. Taking regular breaks, deep breathing exercises, and ensuring you have a balanced lifestyle outside of trading can help maintain your mental equilibrium.
Conclusion and Further Reading
Trading psychology is a vast and complex field, but understanding its fundamental principles can drastically improve your trading performance. By being aware of the common psychological traps, understanding your own emotions and risk tolerance, and employing effective strategies to manage your trading emotions, you can make more informed and profitable trading decisions.
Continuous learning and emotional self-awareness are keys to successful trading. There are numerous resources available for those who want to delve deeper into trading psychology, risk management, and market analysis. While the journey to master your trading psychology can be challenging, the potential rewards - improved trading outcomes and personal growth - are well worth the effort.

The Struggle of Consistency: Navigating DCA in Crypto InvestingHello dear @TradingView community! Today let’s focus on what is Dollar Cost Averaging ?
Determining the optimal moment to buy cryptocurrency is often a challenging task due to the high volatility of crypto assets. Prices can fluctuate unpredictably at any given time, leading traders to experience the fear of missing out (FOMO).
This fear is commonly felt when the price of a cryptocurrency, such as Bitcoin (BTC), suddenly surges or plunges. During price drops, individuals tend to panic and sell their holdings in a frantic attempt to avoid further losses. Conversely, when prices rise, panic ensues as people worry they don't possess enough coins to sell.
As evident, making decisions to buy or sell cryptocurrencies is no easy feat. However, if you seek long-term financial gains from cryptocurrencies without succumbing to the anxiety caused by every price spike, it would be wise to consider the Dollar Cost Averaging (DCA) strategy. Let's delve deeper into what DCA entails and how it functions in the realm of cryptocurrencies.
What is Dollar Cost Averaging?
Dollar cost averaging is an investment strategy where fixed amounts are regularly invested at consistent intervals, in contrast to a one-time lump sum investment. This approach involves executing transactions regardless of the asset's current price or market fluctuations. It is highly favored by investors and management funds seeking long-term profits from various assets like ETFs, commodities, cryptocurrencies, stocks, and more.
How does DCA work? To employ the DCA strategy, you first determine the amount of cryptocurrency you wish to invest. In conventional investing, one would typically invest the entire designated sum in a specific asset. However, with DCA, you invest fixed amounts of USD into Bitcoin or any other asset over a designated period. For instance, you may choose to purchase $100 worth of BTC every month for a 10 year period.
When utilizing DCA, the selection of the cryptocurrency becomes crucial. With around 22,904 cryptocurrencies available today, you must pick a coin you believe will appreciate in value and yield profitable returns. You can even choose an ETF which follows the trend (up or down) for any specific asset or basket of assets.
To comprehend how DCA operates, consider the following example:
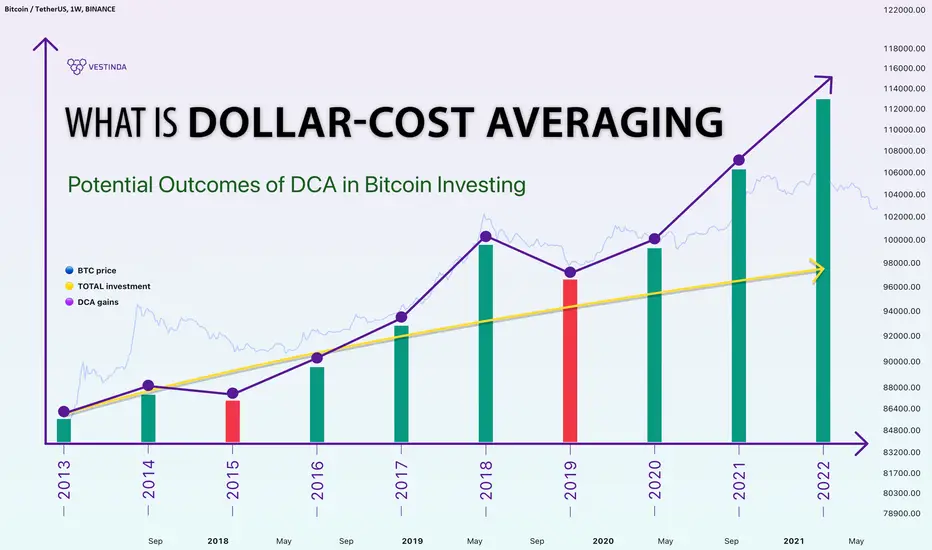
Let's assume it is June of 2014, and Katie decides to allocate $10,000 in BTC. In June of 2014, the price of Bitcoin stood at approximately $560 per coin. Instead of investing the entire sum at once, Katie opts for dollar cost averaging throughout the 9 years.
From June 2014 to May 2022, Katie spent $100 each month on BTC, disregarding market price fluctuations. After 8 years, she spends almost $9,600 and her earnings reflect the following:
The green line in the chart represents Katie’s total investment amount, while the orange line depicts the fluctuation of portfolio size value over the 9-year period. When Katie initiated his investments, both the cost of BTC and his investments were approximately $100. However, as time progressed, the price of Bitcoin underwent changes.
By May of 2022, Katie's $9,600 investment had grown to $287,518 worth of BTC, showcasing a growth rate of 2,895%. With maximum gain of $631,540 at bitcoin ATH.
Online DCA tools are also available to estimate the earnings from purchasing bitcoins over several months. For example, platforms like dcaBTC enable users to customize their DCA strategy according to their preferences, specifying the amount to purchase, investment frequency, and duration.
To successfully implement dollar-cost averaging (DCA) in Bitcoin investing, several key steps need to be followed. These steps involve setting a budget, choosing a reputable cryptocurrency exchange, establishing recurring purchases or utilizing recurring purchases and automated investment platforms (such as Binance, Coinbase, Kraken, Crypto.com or even at Vestinda), and monitoring and adjusting the strategy as necessary.
Pros and Cons of Dollar Cost Averaging
Let's commence with the pros of dollar cost averaging. By making regular and consistent purchases over time, you mitigate the risk associated with poorly timed lump sum investments. Additionally, since you make regular purchases, you alleviate the fear of missing out and impulsive decision-making prompted by price fluctuations.
Cryptocurrency exchanges and platforms charge transaction fees for every trade. While one might assume that DCA would result in higher commission fees, it is essential to remember that this is a long-term strategy. The commission costs are negligible compared to the potential profits that can be realized over several years.
Moreover, DCA does not necessitate substantial investments. This strategy involves smaller and consistent purchases, eliminating the need to determine how best to deploy a large sum in one go. Furthermore, if prices suddenly drop at the time of purchase, you can acquire the cryptocurrency at a lower price.
However, it is important to note that if the cryptocurrency's price is bullish, you may end up buying at a higher price. This is particularly relevant when dealing with BTC or any chosen cryptocurrency. Many crypto enthusiasts and investors prefer to purchase a significant amount at once, fearing a subsequent price surge in the hours, days, weeks, or months to come.
As previously mentioned, with the DCA strategy, you purchase small amounts at regular intervals, regardless of market stability.
Should you utilize the DCA Strategy?
DCA facilitates maximizing profits with relatively low risk. Although this approach is not devoid of drawbacks, it offers numerous advantages that can be leveraged to your benefit.
Hence, is DCA worth your time and money? As always, we recommend thoroughly studying all available information before making any decisions. Save this article to your browser bookmarks for easy reference in the future.
Happy trading!
How to: Dynamic DCA with Risk Metric [Live Backtest]Hi Everyone,
This tutorial is a live backtest demonstration of a basic Dynamic DCA strategy using my Bitcoin Risk Metric and how it performed in the 2018-2021 BTC market cycle.
The risk metric quantifies the risk of buying BTC at any given time, highlighting periods of overvaluation and undervaluation. A Dynamic DCA strategy allows the user to:
Accumulate BTC during periods of undervaluation.
Lock in profit during periods of overvaluation.
Grow a cash position (undeployed capital) to take advantage of periods of extreme undervaluation.
I hope this tutorial is informative and gives a clear picture of how the @panpanXBT Bitcoin Risk Metric indicators can be utilised to guide decision making.
Please refer to the ideas linked below for information on how to gain access to these private indicators and strategies.

Every man and his dogI have seen more and more Wyckoff posts recently, well - here's another one!
I was trading Wyckoff methodology when it wasn't cool. Unfortunately for the masses, it's not as easy as an 'influencer' will have you believe, from seeing their posts - they clearly lack the understanding and are simply joining the 'HYPE' club for view count.
A few years back I went into some depth on Bitcoin's phases as you can see below;
Here you would expect the mark up and straight into a Point and Figure forecasted level, which then became 'Re-accumulation'
As the price moved up, you could see as clear as day a nice AR move; I'll go into that shortly. But this was the sign of professional involvement.
This chart was posted on the 18th of March to highlight the BC (also cover in a second) Why was it so obvious? It was smacking us in the face with the fact it had it's re-accumulation phase earlier - although many said the 60+ thousand level was the accumulation. Point and Figure analysis had the range mapped out and as we neared the zone, the AR come into play.
To understand this, I have drafted the help of my good friend Chat GPT to explain this like we are 10 years old.
Imagine you have a jar filled with your favorite candies, and you really want to collect as many as possible. Here's how the stages of a Wyckoff accumulation schematic can be related to this candy scenario:
Stage 1: Markdown Phase
In this stage, you notice that the candies are on sale and their price has been reduced. This makes you excited because you can buy more candies with the same amount of money. So, you start buying some candies, taking advantage of the lower prices. Other people also notice the sale and start buying candies too. This is like the first stage in Wyckoff accumulation, where prices are falling, and smart investors start buying.
Stage 2: Absorption Phase
In this stage, you and other candy lovers continue buying candies, but you start to notice that even though you're buying a lot, the price doesn't go down as much as it used to. It's like the candies are getting harder to find on sale. This means that there are fewer candies available at the lower price, and more people are buying them. You and others keep buying as many candies as you can, but you start to realize that the sale might be ending soon.
Stage 3: Markup Phase
Now, the sale is over, and the candies are back to their regular price. However, you notice that the candies you bought during the sale are now worth more than what you paid for them. You feel happy because you made a smart decision to buy them when they were cheap. Other people who missed the sale also want to buy candies now, but the price is higher. You may decide to sell some of your candies at a higher price to those who want them. This is like the third stage in Wyckoff accumulation, where prices start to rise, and the smart investors who bought earlier can sell for a profit.
So, to summarize, in the Wyckoff accumulation schematic, we have the markdown phase where prices fall, the absorption phase where prices stabilize, and the markup phase where prices rise. Just like buying candies on sale, smart investors try to buy assets when their prices are low and sell them when prices go up.
=====================================================================
So now you got the basic idea of Wyckoff phases; this is still a very hard thing to spot. It helps if you have a bias and of course background as to where the price has been. When I posted the "Rocket call" in March 21, we had seen the Buyers Climax which can be defined like this; A major panic that occurs at the end of a steep ascent in prices. In its classical form it is typified by large range reversal in prices accompanied by large volume.
However to simplify this further; contrary to popular 'influencer' belief - Large operator don't go chasing 100x returns, their seeking to make money in all environments and often over a much longer time frame than retail would like. So think of a buyers climax like the bigger players have reached a target that they are comfortable with, the level of returns are sufficient. They sell off as retail are buying every little dip on their 15 minute chart.
An AR is an Automatic Reaction to either a buyers or sellers climax (for more, read the post below - Wyckoff basics explained)
Once we dropped to the 4 level marked up in March. The move away was ugly, it was low volume from the get go. Meaning a lack of overall interest (at the time) But under the surface, there was more to it. A lot more to it to be honest!
I covered the Wyckoff Distribution in this educational post;
So, we dropped "exactly as predicted" into a range that was measured only to rise on low, depleting volume. You would then expect a re-accumulation and the measurement for the extension is again mapped out.
Re-read the Chat GPT section above.
You see, Wyckoff can be useful if you know how to use it properly... People often say things like "it's over 100 years old, it can't work in these markets" Or they try and make patterns out of every move, clearly lacking the understanding.
As I explained in August 21 on the way to the current All Time High - the price could be plotted as the image above shows. Volume and COT intel plays a major part here, the sell off was going to be quick to the 40k level - why? Well, it was re-distribution in play.
And just like that January 22 through to May was also mapped out...
Once we got that break down lower, you could assess the Point and Figure regions.
And just like that, we are back into Accumulation. To the MOOOOON!!! ... Not so fast, as this is a much bigger cycle you have to look out for volume, what the bigger players are manipulating and assess the overall situation, being a bigger schematic it is likely to be a slower burner. Refer back to the Chat GPT section above.
========================================================================
Wyckoff, Elliott and Dow Theory still works today as it's not a study of technical charts to be honest, they understood the depth of psychology, retail sentiment based on an individuals own mindset. I have covered the psychology around this in several posts including the Simpsons one! Here's a quick look at the cycle.
Now, place these retail sentiment analysts together.
You see, things don't have to be complex to work.
Zoom out and if you have read this post well enough, you might spot the next clue as to where exactly we are. If you already know me or follow my posts and educational content, you might spot not only where we are, but why.
Anyways, I hope this helps at least one person out there!
Have a great week!
Disclaimer
This idea does not constitute as financial advice. It is for educational purposes only, our principle trader has over 20 years’ experience in stocks, ETF’s, and Forex. Hence each trade setup might have different hold times, entry or exit conditions, and will vary from the post/idea shared here. You can use the information from this post to make your own trading plan for the instrument discussed. Trading carries a risk; a high percentage of retail traders lose money. Please keep this in mind when entering any trade. Stay safe.

Exploring Bitcoin and Altcoin DominanceIntroduction
The dynamic landscape of cryptocurrency trading is filled with a multitude of variables that traders need to comprehend to navigate the financial waters successfully. One such vital aspect of understanding is the relationship between Bitcoin Dominance (BTC.D) and Other Cryptocurrencies Dominance (OTHERS.D). This article aims to provide an in-depth insight into this relationship and its long-term trends.
Bitcoin Dominance: What is it?
Firstly, to understand the relationship between these two, we must grasp what Bitcoin dominance implies. Essentially, Bitcoin dominance illustrates the ratio of Bitcoin's total market capitalization relative to the aggregate market capitalization of the entire cryptocurrency market. Expressed as a percentage on a scale from 0 to 100, it signifies the proportion of Bitcoin's capitalization compared to the total market capitalization.
Other Cryptocurrencies Dominance (OTHERS.D)
Similarly, Other Cryptocurrencies Dominance (OTHERS.D) represents the total market capitalization of the top 125 altcoins, excluding Bitcoin and some other leading cryptocurrencies. It reflects how the altcoins are faring against the total market cap in the crypto market.
Correlation Between BTC.D and OTHERS.D
Now, the crucial question is, why should we care about these percentages? The significance of this relationship is revealed through the Correlation Coefficient indicator, which quantifies the degree to which these two indices move in relation to each other.
A Correlation Coefficient value of +1 indicates a strong positive correlation, signifying that both instruments tend to rise or fall simultaneously. Conversely, a correlation coefficient of -1 represents an inverse relationship, meaning when one instrument rises, the other falls. A coefficient of 0 suggests no apparent correlation, implying that the two instruments move independently of each other.
Historical data reveals that the correlation between BTC.D and OTHERS.D is often around -0.9. This suggests an inverse relationship where an increase in Bitcoin dominance typically corresponds to a decrease in altcoins dominance, and vice versa. This correlation is significant as it guides traders on whether to shift their focus towards Bitcoin or altcoins.
Long Term Trends
When we delve deeper into the long-term trend analysis of BTC.D and OTHERS.D, a broader picture begins to emerge. This broader view becomes more apparent when we visualize these trends, with Bitcoin dominance (BTC.D) represented in orange and Others.D in red, which allows for a clear discernment of an inverse correlation trend.
Over time, Bitcoin dominance, as depicted by the orange trend, has tended to display a downward trajectory. This indicates that Bitcoin's proportion of the total market cap has been steadily diminishing. In stark contrast, Others.D, represented in red, has shown a long-term upward trend. This indicates that the dominance and capitalization of altcoins are gradually rising relative to the total market cap.
Conclusion
Understanding the symbiosis between Bitcoin Dominance (BTC.D) and Other Cryptocurrencies Dominance (OTHERS.D) is instrumental for navigating the cryptocurrency trading landscape effectively. A clear trend, observable over the long term, shows a steady decrease in Bitcoin dominance juxtaposed with a corresponding increase in altcoin dominance.
This evolution might be attributed to several factors. One of these could be the proliferation of new cryptocurrencies entering the market. Another factor could be the progressive advancement of blockchain technology, which is steadily pushing the envelope of modernization.
It is essential, therefore, to regularly analyze and monitor the BTC.D and OTHERS.D charts. Spotting a distinct trend in either direction could offer valuable insights for your investment strategy. Attempting to follow these trends can potentially provide advantageous trading opportunities.
The beauty of Bitcoin's design lies in its transparency. Nowhere else is the flow of capital as visible as in Bitcoin. This visibility lends a unique perspective, providing traders a strategic edge. By embracing this, you can bolster your understanding of these market dynamics, facilitating more informed and effective trading decisions in the fluctuating world of cryptocurrency.
Thank you for reading this article. I hope it has provided you with a useful insight into the relationship between Bitcoin Dominance and Other Cryptocurrencies Dominance, thereby enhancing your understanding of cryptocurrency trading. Your pursuit of knowledge in this ever-evolving field is commendable. Stay informed, stay ahead!
Best Regards,
Karim Subhieh

Inside Futures Trading: Key Lessons from My Years of ExperienceIn my years as a futures trader, I've learned valuable lessons. I'd like to share these insights with you, hoping to help you navigate the complex world of futures trading.
The Importance of a Plan
A well-structured trading plan stands as the cornerstone of successful futures trading. Like a roadmap, it navigates your journey through the often turbulent market conditions, providing clear guidance on your trading activities. It helps outline your specific trading goals and defines the strategy to achieve them. Whether you aim for short-term profits or long-term investments, a trading plan ensures your objectives align with your financial situation and risk tolerance, thereby averting overambitious goals that could lead to increased risk.
Furthermore, a solid trading plan encompasses your risk management strategy. This safety net is crucial in protecting your capital from significant downturns. Determining the level of risk you're comfortable with, often based on your financial situation and risk appetite, forms a key aspect of this strategy. Besides, your plan should provide explicit criteria for entering and exiting trades, eliminating impulsive, emotion-driven decisions. Such a plan, therefore, operates as a comprehensive framework that synchronizes your trading activities with your financial goals, risk profile, and market understanding.
Over-Expectation and High-Risk Bets
A common pitfall I've witnessed in many traders, especially those just starting out, is the temptation to make substantial profits with a single trade. This approach often involves placing a small amount, say $100, with low leverage, and expecting it to yield significantly high returns, even double the initial investment, in one trade.
This aspiration, while alluring, is fraught with high risks and often overlooks the fundamental principle of market volatility. The likelihood of an asset's value doubling in a short timeframe is generally low unless the market conditions are extraordinarily favorable. Furthermore, while leverage can amplify profits, it can also magnify losses, increasing the risk of liquidation.
It's important to note that futures trading is not a scheme to get rich quickly but a strategic financial activity that requires prudent planning, risk management, and realistic expectations. Patience and consistent smaller wins can often lead to more reliable, long-term profitability. Over-expectation can lead to an increased risk appetite, causing one to disregard safety measures like stop-loss orders and prudent leverage, making their position highly vulnerable to market volatility.
Remember, in futures trading, managing risks and preserving your capital is as crucial as making profits. The goal should be long-term sustainability in the market rather than short-lived, high-risk gains.
The Dangers of Overtrading
In my initial trading years, I subscribed to the notion that more trades equated to more profits. However, I soon discovered that this belief led to overtrading, which increased my costs and risk exposure.
Overtrading occurs when one trades excessively, often reacting to minor market fluctuations. This approach not only amplifies trading costs but also elevates the risk of encountering losing trades. A better strategy I've found is to focus on the quality of trades rather than the quantity, ensuring each trade is well-reasoned and supported by robust market analysis.
Risk Management is Key
The significance of risk management in successful futures trading cannot be overstated. It is the safety net that can cushion you from inevitable market downturns and unexpected volatility. Without proper risk management strategies, a single unfavorable trade could potentially inflict considerable damage to your trading capital.
In practical terms, effective risk management involves setting stop-loss orders to limit potential losses on each trade. It also means not risking too much capital on any single trade, regardless of how promising it might seem. Keeping risks within manageable limits preserves your trading capital and ensures your survival in the trading arena, despite the inevitable setbacks.
Be Careful with Leverage
In futures trading, leverage is a powerful tool that can enhance potential profits but also amplify losses. It provides the ability to control substantial positions with only a fraction of the investment typically required. However, it's crucial to remember that leverage is a double-edged sword.
Leverage can magnify gains when the market moves in your favor, turning a small investment into a substantial return. However, the market can also move against your position. In such cases, the same leverage that amplifies your gains can intensify your losses. Losses can even exceed the initial investment, leading to margin calls and possibly the liquidation of your position. Consequently, I've found it prudent to use leverage judiciously and to never risk more than I can afford to lose.
Understand the Underlying Asset
One of the key components in futures trading is the underlying asset of the contract. The value of a futures contract is inherently derived from this asset, which can range from commodities like gold or oil to cryptocurrencies like Bitcoin.
Understanding the intricacies of the underlying asset is pivotal for making informed trading decisions. It involves scrutinizing its historical performance, the factors influencing its price movements, and its potential future trends. This knowledge can provide crucial insights into the asset's volatility, helping traders formulate effective strategies and manage potential risks.
Researching and continually staying updated about the asset you're trading is not just a recommended practice; it's a necessity. It equips you with the essential information required to navigate the ebbs and flows of the market, potentially turning uncertainties into profitable opportunities.
The Value of Stop-Loss Orders
Stop-loss orders play an instrumental role in prudent risk management within futures trading. They function as automated safeguards designed to close out a trade when the price moves against your position to a pre-defined extent.
Utilizing stop-loss orders allows you to establish the maximum amount you are willing to lose on a particular trade, providing a degree of certainty in an inherently uncertain market. It effectively mitigates the potential impact of adverse market movements, protecting your trading capital from substantial losses. From my experience, using stop-loss orders is not just a recommendation—it's an essential trading practice.
Avoiding the Pitfall of Chasing the Market
Another invaluable lesson I've learned over the years pertains to the timing of market entry. Many traders fall into the trap of entering a trade after a trend has already been well established—a practice known as 'chasing the market.'
Chasing the market can often lead to buying high and selling low, which is the antithesis of profitable trading. This happens because once a trend is firmly established, it's likely closer to its end than its beginning. Jumping onto a fast-moving trend in the hope of riding it further can result in entering the market at an unfavorable price point.
Instead, it's more effective to develop a strategy that allows you to identify potential trends early and enter the market at a more advantageous time. The key here is patience and discipline, waiting for the right market conditions before committing your capital. By not chasing the market, you can avoid costly mistakes and enhance your trading performance.
Cut Losses Short
One of the toughest yet most valuable lessons I've learned is the necessity to cut losses short. It's a human tendency to hold onto losing positions in the hope that they'll rebound. However, in futures trading, this approach can lead to substantial losses.
A losing trade is not just a financial setback—it can also impose a psychological burden. Hoping for a market reversal when stuck in a losing position can cloud your judgment, causing you to overlook other potentially profitable trades. It's crucial to accept that not all trades will be winners, and knowing when to exit is as important as knowing when to enter.
Trade with the Trend
Predicting the market can be alluring, but it often results in entering trades against the trend. Over time, I've realized that it's usually more beneficial to trade with the trend. After all, 'the trend is your friend' is a well-known adage in trading for a reason.
Trends have a propensity to continue for longer than expected, and trading against them can be perilous. Recognizing and trading in the direction of the prevailing trend can increase the likelihood of successful trades. It reduces the chances of being caught on the wrong side of the market and enhances the potential for consistent profits.
Keep Records
Maintaining records of your trades is an essential practice for ongoing learning and improvement. A detailed trading journal allows you to review your past trades, identify recurring mistakes, and refine your strategy accordingly.
Keeping track of each trade, including the reasons for entering and exiting, the profit or loss, and any relevant market conditions, can provide valuable insights. It creates a feedback loop for self-improvement, promoting conscious trading decisions and encouraging disciplined trading.
In conclusion, futures trading is a challenging yet rewarding endeavor that demands careful planning, disciplined risk management, and relentless learning. The lessons I've shared from my years of trading are by no means exhaustive, but they provide a solid foundation for anyone embarking on their futures trading journey. That being said, learning never stops in the world of trading.
If you've come across any valuable lessons or insights that I've not covered in this discussion, please feel free to share them in the comments. It's through our collective experiences that we all become better traders.

It is necessary to check the created time frameHello?
Traders, welcome.
If you "Follow", you can always get new information quickly.
Please also click "Boost".
Have a good day.
** Analysis of the BTC chart publishes new ideas once a week.
** However, we publish new ideas when volatility occurs or when we show signs of diverging from our expectations.
** Excluding the above situation, BTC analysis is listed as a daily update.
-------------------------------------
(BTCUSD chart)
(BTCUSDT chart)
(BTCUSDT.P chart)
(BTC1! chart)
(BTM1! Chart)
(BTCKRW chart)
The flow of the charts listed above is the same or similar.
However, the difference is the location of the M-Signal indicator on the 1M and 1W charts.
Part of it is that the M-Signal indicator on the 1M, 1W chart made a regular arrangement (1W > 1M).
I think that these forward and reverse alignments mean that the trend has begun to change.
Therefore, if it moves sideways or swings strongly up and down in the current price range, it is expected to gradually form a straight line on all charts.
Therefore, it may temporarily drop to around 23K (BTCKRW: around 29639000).
All we can do in this decline is decide when to buy.
The reason is that funds are continuously flowing into the coin market.
The next big volatility is expected around June 9-13.
When referring to the explanation of the analyzed chart, you should pay close attention to which time frame the analyst is explaining.
If you look at the analyzed chart without checking it, you should be careful because it may be recognized as a completely different text from the flow you think.
So, in my article, I have displayed 1M, 1W, 1D, and 1h charts, and the corresponding analysis is displayed.
For example, if you look at the analysis written on the 30m chart and mistake it for an analysis of more than 1 day and loose your response, it means that you are likely to lose money.
Therefore, analysis written on a time frame chart of 1D chart or lower requires a quick response, so you should keep looking at the chart.
Therefore, you must check the time frame in which the analysis was written, as you may mistake the article analyzed with the time frame chart below the 1D chart for the overall flow of the chart.
-------------------------------------------------- -------------------------------------------
** All descriptions are for reference only and do not guarantee profit or loss in investment.
** Even if you know other people's know-how, it takes a considerable period of time to make it your own.
** This is a chart created with my know-how.
---------------------------------

USDT vs USDC Reserve BreakdownUSDT (Tether) vs USDC (Circle) reserves☝️
USDT seems to be more diversified then USDC, as they’ve split their reserves into 7 different asset classes. Compared to USDC who are only diversified into 3.
USDT has a healthy 4% of their reserves in Gold, which is up 8% year to date SO FAR. They’re more likely to survive a liquidation process, compared to USDT when the next Crypto crash happens💥

The other side of the tradeTrading has this stigma attached to it, everyone thinks they can come and make their millions. The reality is, 90% of new traders lose 90% of their funds in 90 days.
I've talked for years about the negative side of trading (trust me, I've done this over 20 years) Trading is often perceived as a wonderful, fabulous lifestyle. Cars, yachts, jets and women! Probably fueled by films like the Wolf of Wall Street. But not many people like admitting to the other side of the traders lifestyle. Of course, it's nowhere near as glamorous - it sure as hell won't get social media likes or follows. But it's there and it's real!
There are a couple of main points that I want to touch on, especially for you newer traders coming to find your fortunes.
1) Trading can be boring! Yes, boring as shait. If you are used to having a 9-5, you do not realise the effects (good and bad) on having human interaction throughout the day. You might have a partner you live with, the family. But what about when they go to work or school? You are left with your own thoughts. Yes, this can be dangerous!!!
The issues can include lack of motivation, uncertainty in what to do, overthinking. On your bad days, you have nobody to comfort you and on your good days, you have nobody to share the excitement with! Joining communities can be a good fix here, providing you find a good one. This doesn't have to effect your trading, your strategy or anything else - but interaction could save you from the loneliness.
The solitary nature of trading can sometimes lead to feelings of isolation and loneliness. Without the support and camaraderie of others in a similar field, it can be challenging to share experiences, discuss strategies, or seek advice. Additionally, the pressure and stress of making high-stakes financial decisions can further contribute to a sense of isolation.
2) STRESS - Stress is a huge factor for a trader. Stress could also stem from the loneliness, stress when dealing with finance is an area where a lot of people suffer, traders and non traders alike. The issue is for traders, stress is often self inflicted.
Most new traders come to the market with a view of it's easy, fast paced, exciting and therefore have the perception of making it big.
If it was this easy, people wouldn't spend 7 years becoming doctors or lawyers. Instead they would follow the money! Come on, who wouldn't - Yachts n all.
It's this popular belief that usually drives traders into the stressful state which becomes the norm until they give up!
To counter the loneliness and try to make it big, traders (probably you) I know I did! look at indicators, try to take on as much info as possible! Which takes you down this path.
Indicators. there must be a holy grail, a silver bullet? 100% winning strategy? People waste so much time on retail indicators thinking they will be the one to find the edge. You would be better off having a trip to Vegas and playing the first slot machine you spot!
The next issue is - too much data or the attempt to obtain too much of it! I remember when my setup matched this below (if not more screens)
This is like trying to read 9 books at the same time whilst writing essays in 6 different languages. All of these factors will 100% add to your stress.
You might have anxiety when executing a trade, or feel the burden of stress whilst in a trade. Scared to see the numbers go red and too eager when they go green?! Yup been there, done that. So has every trader out there.
Stop feeling like this.
Creation of a strategy...
All you need to help combat these types of stresses, is find an edge. The edge could be very simple - from reading books, stepping away from the charts, viewing higher time frames, moving away from social media influencers. All the way through to mastering one instrument.
When you see indicators like the image above, what happens if two are in one direction and the rest in another? You start to argue with yourself, you miss good trades and you end up taking bad ones. This leads to stress and then you realise, yup your lonely!
What a cycle to be trapped in!
Now how about you flip the thinking here? Less charts to stare at, less indicators to confuse, more time to read, exercise or simply go play golf. Your edge does not need to be technical, fancy or shown on 48 screens.
I talked about this in the Tradingview live show the other evening.
Here's the link: www.tradingview.com
Sometimes less is more and this can combat the stress and golf is always a winner for loneliness.
Disclaimer
This idea does not constitute as financial advice. It is for educational purposes only, our principle trader has over 20 years’ experience in stocks, ETF’s, and Forex. Hence each trade setup might have different hold times, entry or exit conditions, and will vary from the post/idea shared here. You can use the information from this post to make your own trading plan for the instrument discussed. Trading carries a risk; a high percentage of retail traders lose money. Please keep this in mind when entering any trade. Stay safe.

Market Capitalization and Price Volatility in CryptocurrenciesIntroduction
The cryptocurrency market has grown substantially in recent years, not just in terms of its size, but also in terms of its complexity and the variety of investment options available.
One of the key aspects that investors consider when evaluating potential investments is the market capitalization of a cryptocurrency, which is calculated by multiplying the total supply of the cryptocurrency by its current price.
Another important aspect is price volatility, which refers to the degree of variation in the price of a financial instrument over time. The relationship between these two factors - market capitalization and price volatility - forms the basis of this article.
Understanding Market Capitalization and Price Volatility
Market capitalization provides an indication of the size and scale of a cryptocurrency, and it is a useful measure for comparing different cryptocurrencies.
Larger market-cap cryptocurrencies, like Bitcoin and Ethereum, have established a significant presence in the market and are generally considered more stable.
On the other hand, smaller market cap cryptocurrencies, often referred to as 'altcoins', have the potential for high returns but come with a higher risk.
Price volatility, on the other hand, is a measure of price fluctuations over a given period. High volatility means that a cryptocurrency's price can change rapidly in a short time, making it possible for investors to experience significant gains or losses. Cryptocurrencies are generally more volatile than traditional fiat currencies, which means that the potential for gains or losses can be high.
The Correlation Between Market Capitalization and Price Volatility
Existing literature and market analysis suggests that there is a negative correlation between market capitalization and price volatility in cryptocurrencies, meaning that cryptocurrencies with larger market caps tend to have lower volatility and vice versa. This makes intuitive sense, as larger market cap cryptocurrencies have a wider user base and more liquidity, which helps stabilize their prices.
For instance, Bitcoin, which has the largest market cap, has relatively lower volatility compared to smaller market cap cryptocurrencies. This lower volatility is due to the fact that Bitcoin, being the most established cryptocurrency, has a wider distribution and a large number of holders, which helps in maintaining its price stability.
Conversely, smaller market cap cryptocurrencies are more susceptible to price swings, often driven by speculation and sentiment rather than fundamental value. These cryptocurrencies can exhibit high volatility, leading to potential for large gains, but also high risk.
Implications for Investors and the Market
Understanding the relationship between market capitalization and price volatility is crucial for investors in the cryptocurrency market. It can help them tailor their investment strategies based on their risk tolerance. For instance, risk-averse investors might opt for larger market cap cryptocurrencies due to their lower volatility, while risk-tolerant investors might be attracted to smaller market cap cryptocurrencies due to their potential for high returns.
Furthermore, this relationship has implications for the stability and maturity of the cryptocurrency market as a whole. As the market matures and more capital flows into it, it is likely that overall volatility will decrease, making cryptocurrencies a more viable asset class for traditional investors.
Conclusion
The relationship between market capitalization and price volatility in cryptocurrencies is a key dynamic that has important implications for investors and the market as a whole. As the market continues to evolve and mature, it will be interesting to observe how this relationship changes and what that means for the future of cryptocurrency investing.
Trade with care.
If you like our content, please feel free to support our page with a like, comment & subscribe for future educational ideas and trading setups.

$BTCUSD SOPR, BFX Longs and Shorts, Greed, Liquidations.
This is one of the multi-chart evolving dashboards I use daily for crypto trading. This dashboard attempts to distill a broad scope of data and sentiment into glance value charts. The goal with such dashboards is to seek to stack probabilities to be on the right side of the percentages in every trade.
--
The top panel chart shows the SOPR (Spent Output Profit Ratio, (grey line, using the symbol $BTC_SOPR) overlay vs $BTCUSDT (Binance, in blue). The SOPR is a very simple indicator. It is the spent outputs expressed as a ratio and shown as an oscillator on the chart. The Bitcoin SOPR is the realised dollar value divided by the dollar value at creation of the output. Or simply: price sold divided by price paid.
SOPR showing under value 1 means that the on chain data has recorded a net realised loss for "spent" Bitcoin. SOPR showing over value 1 means net profit. Renato Shirakashi appears to be the inventor of SOPR for BTC, and he writes about SOPR: "In this analysis two important psychological turning points that significantly change the supply of bitcoin are going to be described by introducing a new oscillating indicator that signals when these major supply changes occur, using blockchain data." I interpret this reference to the psychology of "weak hands" getting flushed out of the market by selling at a loss as shown when SOPR sits below 1 for extended periods of time (bear), and when all the weak hands have left the market, we find a bottom.
Because I am an impatient learner, I needed further examples to understand fully. If someone sells you 1 Bitcoin at $50,000USD, that transaction is recorded on the blockchain. If you then sell it for $25,000USD, that is now a spent output which is obviously a negative 0.5 ratio, and would contribute to a SOPR lower than the value 1. Interestingly the SOPR tends to be very close to the value 1 nearly always. Which means that the aggregated data of all spent outputs is nowhere near as extreme as the example I gave (although I'm sure there are plenty of retail traders who bought the high and sold the bottom at a 50% loss).
If we rewind to extended periods of low points in the SOPR ratio, extended negative ratio periods coincide with low points. In the past 5 years the lowest ratio was around 0.88, which was December 2018, when the price of Bitcoin was heading lower than $4k USD. That particularly brutal bear market lasted 18 months and you can see that the SOPR was below value 1 for nearly the entire time, indicating that there was a long tail of weak hands realising losses the entire time.
---
Also present on the top chart is a brilliant little free indicator called Liq.Levels , wtf is all I can say, this a masterpiece of long/short liquidation data based on market maker behaviour in this case Binance's perpetual BTC/USDT leveraged futures (one of the most active retail leverage platforms). On this layout I have hidden all but the 25x liquidation points both short and long as it captures the widest spread and for the simplest visual as this is a glance-dashboard, on a single panel layout you can view the 50x and 100x which are tighter spreads. Liq.Levels also filters for a minimum of one million USD, so this is real value the market makers are getting out of bed for, essentially these levels are where the market maker really wants to push the price to. If you're new to leverage (don't do it! just buy at spot!), the reason they do this is to hunt the longs and the shorts and cause maximum liquidations (are you still trading with leverage?!).
---
The second panel is the famous Bitfinex Longs (green) and Shorts (red) . You can see currently the longs, since around the $39000 level went parabolic. The shorts are just tiny in comparison. The data from Bitfinex seems less erratic than those from other exchanges, so if you find looking at longs and shorts ratios useful, I'd suggest also looking at other websites to see the other major exchange long and short activity, liquidations, and ratios.
This info is used to monitor large moves by leveraged traders. While Bitfinex is not the best measure here (ideally you would want all major exchanges aggregated longs vs shorts, but I have not found such indicators on TV, only Bitfinex), you can check the data by comparing it to another exchange, for example Binance you can see that parabolic move the Longs made from the 11th of July to around the 14th of July (while the BTC price fell off a cliff from $30k to $20k), where the ratio of Longs vs Shorts on Binance also skewed heavily to the Long side.
This is another way to stack a probability. As the Longs level off and get flushed out (usually by mass liquidation!), this is another variable to find support or resistance. For example you can see the levelling off around 12 May 2022, Bitcoin's price found a short term bottom at $29k. Similarly and most recently you can see as the Longs levelled off from a hectic run up in the mid June 2022 selloff, the price found a short term bottom around $20k. You could say that recently or commonly this is a contrarian indicator, assuming that smart money is seeking to liquidate the maximum possible leveraged positions, so we can assume that generally these leveraged retail traders will largely make incorrect bets most of the time, hence historically as soon as Shorts leave the market, the price spikes up, and vice versa. So, another thing to watch.
---
Next we have a Crypto Fear & Greed Index , which as you can see nearly always oscillates in a tight rhythm with Bitcoin's price action. Above 75 (green dotted line) is extreme greed, below 25 (red dotted line) extreme fear. There are quite a few websites that attempt to measure crypto Fear & Greed, and even a variety of different indicators on TradingView, but this was the clearest visually I could find here. The inputs on this version according to the coder are stable coin flows (flight to safety), coin momentum (top 18 coin price relative to 30 day averages), and top 18 coin price high over the previous 90 days. So, it's interesting that despite this being at face value a rather complicated set of data with many inputs, that it just looks like a carbon copy of the Bitcoin chart. Bitcoin has a gravity that is inescapable for all things crypto right now.
The difference between looking at this indicator and simply looking at Bitcoin's chart is that it flattens out the action and has a set floor and a ceiling. You can see historically that the best buy times were when fear was at its "height" (where the yellow line is at its lowest). Another way to stack probabilities. At time of writing, is this a great time to buy? Fear appears to be leaving the market, we haven't had a commensurate price move up, so I'd be cautious. Like all these indicators, you can just overlay Bitcoin's price line and backtest the correlation in a few seconds. Buying when fear is at a maximum is usually easier said than done, though!
---
Lastly we have Liquidations by Volume , as per the coder this "shows actual liquidations on a per-candle basis by using the difference in volume between spot and futures markets." Blue line is futures volumes, yellow are spot volumes. The code for this indicator shows that it is the same BTCUSDT Perpetual Future's contract from Binance that we have in the Liq.Levels indicator, perfect.
Worth noting is that the community of coders at TradingView is a trader's dream. These sorts of customisable dashboards you can build are high value. Having worked for the largest international institutions I find many of these indicators are institutional grade and they have just a few hundred users sometimes, pretty crazy how early in the adoption curve we are with this. If you haven't experienced the "other side" of trading, compared to regular equities forex futures etc the TradingView tools and the crypto data and exchanges are just lightyears ahead.
Back to why look at liquidations? As institutions come into the market, and retail wallets on exchanges like Binance and many others continue to use leverage, the action in the derivative (in this case $BTCUSDTPERP) can and often does drive the price of the underlying. Market makers hunt the maximum liquidations, always. The market context is highly relevant here. During volatile periods it is a swinging contrarian indicator. If there has been massive green bars showing short liquidations pushing the price up, then we could be forming/hitting resistance levels and can see reversal/selloffs, and vice versa if there are massive red bars showing long liquidations pushing the price down, this can be hammering out support levels and we look to bounce. The longs and the shorts really do seem to be taking turns getting liquidated right now.
Also of relevance is the price action relative to the liquidations. Obviously if an institutional candle pushes the price up or down, there will be mass liquidations. But another scenario that occurs is when are light volumes on the derivatives such as $BTCUSDTPERP we have under the microscope here, but we have large Bitcoin price movements, then the reasons for the move can be understood differently, and we can use this and other contexts to draw conclusions such as for example a scenario where price goes up with light liquidations and derivative action, which could be interpreted as much stronger hands holding coins rather than simply margin calls.
---
Good luck!

The Laws of cryopto markets.Law #1
All markets are inherently Fractal. Markets have many patterns. Fractals are similar in different instruments, different timeframes, and even in different time periods. Whether you look at a monthly chart or a 1-minute chart, the same principles and patterns work everywhere. If you remove the ticker or symbol of an asset and the time frame from the chart, you will hardly be able to determine the chart of which instrument you are analyzing. All markets move according to the "Russian Matryoshka" principle: balances within balances, ranges within ranges, transitions from one pattern to another.
Law #2.
At a certain point in time, markets are either in balance or moving in a trend. Markets can only be in one of these two states.
So what is balance, or as I sometimes call it, range? Financial Markets have long been designed to create a "bargain." In a balance sheet, buyers and sellers determine some kind of value for a commodity or trading instrument. It is in the balance that buyers and sellers come to a common denominator or agree on the valuation of the commodity they are trading. In a trend, on the contrary, both buyers and sellers disagree on the price and move away from the previously agreed value of the commodity. The reason for this can be anything: supply and demand, news background, some rumors, fundamental changes or whatever. Something has caused the price to get out of a certain balance. The value of the goods has changed, and if it has risen, it means that the buyers have become much more aggressive than the sellers, or vice versa. More aggressive means that buyers, for whatever reason, are willing to pay more than sellers offer. These "transactions" and aggressive transitions move the world markets until both buyers and sellers agree on the value of the commodity again. Then the "flat"/balance starts again, then the trend, and then the stop and balance again.
It is very important to understand that getting out of a Grand Balance creates a big trend. Understanding this can bring you either big profits or big losses if you start trading against such a trend. Trends and balances move in the dynamics of the markets and the matryoshka structure. This is what creates the context of the market.
Law #3.
Price moves in a series of impulses and corrections. It never flies up in a rocket (except for dumps on crypto or low-liquid assets), and it never rocks down (dumps on crypto). The move starts with a directional move and then stops at a point called a swing high on an upward momentum. After that, the price begins to move in the opposite direction. This is called a correction or "balancing" if price corrects against the trend. Often price also corrects over time or horizontally when the momentum "cools down," creating a horizontal balance or rerun, but not giving any correction to keep traders out of the trap
Even if sometimes it seems that on a large timeframe price is moving in a straight line upward, when you approach the 15-minute timeframe, you can see that price is going impulses and corrections.
Law #4.
Price takes all information into account effectively, but not perfectly. This "law" is one of the most controversial in trading, and the least understood. As a rule, market participants cannot find a common denominator in explanation of this rule. On the one hand there are supporters of the hypothesis of the market rationality, according to which the price instantly includes all information, news and rumors. They say that the price instantly reflects everything that is happening in the world from details to global fundamental changes.
But if it were true, then it would be impossible to be a profitable trader in the market. From my experience I am willing to argue with this, and there are so many traders who are making huge money in the market contrary to the rationality of the markets. In reality, markets are actually rational, price does include all information very quickly, but market participants are quite far from being rational. Very often the emotional characteristics of market participants cause the price to move too high or too low in the trend direction contrary to the real price of a particular asset. Greed and fear (FOMO-fear of missing out) can often be to blame. Of course, sooner or later the price of the asset will come back to its real value, but the fact is that markets are not entirely rational. That is sometimes the best opportunity to raise good money in a trade against the "crowd."

Wealth Unleashed: Wedge Pattern Power - Hidden Gem Revealed!Introduction : Are you looking to skyrocket your trading profits? Look no further! Today, we will uncover the hidden gem of trading patterns: the Wedge Pattern. This powerful tool has the potential to transform your trading strategy and help you achieve financial success. Let's dive into the world of wedge patterns and explore how you can capitalize on their power.
What are Wedge Patterns?
Wedge patterns are popular among traders due to their high probability of forecasting trend reversals. These patterns appear when the price of an asset consolidates between converging support and resistance lines. There are two primary types of wedge patterns: the rising wedge and the falling wedge.
Rising Wedge:
In an upward trend, the rising wedge is considered a bearish pattern. It forms when the price consolidates between an upward-sloping support line and an upward-sloping resistance line that are converging. As the price approaches the apex of the wedge, the upward momentum weakens, signaling a potential trend reversal to the downside.
Falling Wedge:
Contrary to the rising wedge, the falling wedge is a bullish pattern. It appears in a downward trend when the price consolidates between a downward-sloping support line and a downward-sloping resistance line that are converging. As the price nears the apex of the wedge, the downward momentum loses strength, indicating a possible trend reversal to the upside.
Trading Strategies:
To capitalize on the power of wedge patterns, follow these steps:
✅Identify the pattern: Observe the chart for converging support and resistance lines to spot a rising or falling wedge pattern.
✅Confirmation: Wait for a breakout from the wedge pattern, either above the resistance line (for falling wedges) or below the support line (for rising wedges).
✅Entry point: Open a long position after a breakout above the resistance line in a falling wedge, or a short position after a breakout below the support line in a rising wedge.
✅Stop-loss and take-profit: Set your stop-loss order below the breakout level (for falling wedges) or above the breakout level (for rising wedges). Establish your take-profit target at a level that aligns with your risk-reward ratio and trading plan.
Conclusion:
The wedge pattern is a hidden gem that can potentially boost your trading profits when used correctly. By mastering the art of identifying and trading wedge patterns, you can strengthen your technical analysis skills and increase your chances of success in the market. Remember, no single tool guarantees success, so always use additional technical indicators and maintain a disciplined approach to risk management. Happy trading!
