Big secret - when to buy & sell bitcoin (you decide) - UPDATEDUpdate to previous post 31st January 2020. NOT ADVICE. DYOR.
Bitcoin (Cryptocurrency)


How To Find The Correlation Coefficient For Any Two AssetsThis chart shows Bitcoin (candlestick chart) and the Correlation Coefficient between Bitcoin and the S&P 500 (white graph).
You can find the Correlation Coefficient between any two assets in seconds -- it's easy. First, head to Indicators & Strategies and then search for Correlation Coefficient. When you find it, click it, and a box will appear asking you to type in the asset you want to compare. Press Enter and the chart will calculate the correlation immediately.
Correlation Coefficients are important because they can show you how two assets are moving together. For example, are they moving in lockstep or in opposite directions? A correlation of 1 means a perfect positive correlation and a correlation of -1 means a perfect negative correlation.
We hope this quick guide helps you with your analysis. Please press like if you enjoyed it and write in the comments for other tips or tricks.

How much profit did the Bitmex arbitrage make?For at least three years now I have been advocating for the Bitmex futures "Cash and Carry" trade which is an arbitrage of the quarterly futures contracts versus the spot price of Bitcoin. With this recent selloff and hedge opportunity I wanted to demonstrate once again how this trade played out and its benefits. I've been telling people to do this not only in period of high volatility but also as a general hedging strategy to "lock in" the VALUE of Bitcoin at any given time that there is an opportunity. I seriously do not think anyone but myself utilizes this strategy because when I explain it to your typical crypto trader they get confused and invariably ask "but how Lambo?" This won't yield sick gainz brah but it will protect your capital !
To recap; a Cash and Carry trade is where one trades a futures contract against its underlying where there is a spread between the two prices. This is an arbitrage trade. Ideally the futures contract will move towards the spot price as time reaches the settlement date. In modern normie markets the spread between futures and spot are too small due to their high liquidity, margin interest requirements, and plenty of other arbitrage traders capturing the minuscule profit potential. This trade still remains though on the Bitmex platform. Bitmex has quarterly futures contracts which can be held without paying the fees of the continuous contract. These will often trade at premiums or discounts to the spot price of BTC. The spread of premium or discount will be largely dependent on market sentiment at that time. When Bitcoin is bullish traders are betting the price to be higher at settlement and the quarterly futures will trade at a premium. The inverse is true in bearish conditions. You can visualize this spread by pasting in "(XBTH20-XBTUSD)/XBTUSD*100" without " " to Tradingview symbol; you can also substitute for other contracts by changing the first symbol.
So what happened in this recent selloff? The important thing here is that we are just trying to lock our BTC value at 0 delta to protect the value against such crashes. We do that by selling the futures contracts equivalent to our account value. Let's assume that when BTC was at around 10k a trader decided that it was time to lock in the USD value of their Bitcoin. Let's say they had 1 BTC in their account to keep it simple. On Februrary 9th the Daily bar closed at 10172 on XBTUSD. The March 27th quarterly futures contract (XBTH20) was trading at 10460. This meant that the quarterly futures were trading at a 2.8% premium to spot.
So the trader Sells -10172 contracts of XBTH20 @ 10460. We want to set the contract size to BTC spot price rather than the futures price to mitigate risk in the event of further premium expansion.
In the weeks that followed the market sells off. By March 12 the premium had inverted to a discount of -4%. We close the trade. At the end our BTC is worth over 57% less than it was at the start but we now own 2.4656 instead of 1. If we then calculate our account value in USD we have $10691. Though BTC is DOWN over half our total holdings value is UP by 5.1% !
Are we going to buy that Lambo this year with 5.1%? Probably not... but we have protected our assets and profited from this rare opportunity! A trader only ever uses 1x leverage to hold the position which means there is plenty of leverage available to trade other contracts while this one position is protecting account value.
A final note about arbitrage opportunities: they always go away . As I've written before about December 2017 bubble the opportunity was around 18%! More recently when BTC dropped from 6500 the premium captured was 8%. This time it was only 5-6%. Slowly this inefficiency is indeed going away. Still, at any given time the futures contracts are trading at a premium this is a virtually riskless trade . Even if one doesn't like taking this trade just watching the spread is still a very useful analysis tool to gauge market sentiment.

Where bitcoin could be heading before halvening NOT ADVICE DYOR
For support construct see earlier postings below
See postings 30 NOV 2019 & 1 DEC 19
Three red candles with corresponding lower histogram above zero. Have boxed volatility to first red bar in histogram. Caveat - only small sample tested.
Three green candles with corresponding rising histogram below zero. Have boxed volatility to first green bar in histogram. Close above range, $7933.4, favours bulls, and as critical support going forward. Caveat - only small sample tested.


How Donald Trump beat Bill Gates in a game of bitcoinBill Gates V Donald Trump update. See the connection with big oil and the dollar. NOT ADVICE. DYOR.
I declare the American President Donald Trump be the winner of this bet against Microsoft co-founder Bill Gates. NOT ADVICE. DYOR.

Bill Gates V Donald TrumpI declare the American President Donald Trump be the winner of this bet against Microsoft co-founder Bill Gates. NOT ADVICE. DYOR.

Began with near 50% drop from high last time judging by VIXStudy of VIX etc. and what could happen to bitcoin before halvening. Chart shows peak in VIX to MA cross. Just picked cross which had MA on close peaking afterwards. See what happened to bitcoin last time. Began with a near 50% drop from the previous month's high! NOT ADVICE. DYOR. (See previous posting on VIX and SPX for more info)

EN BTCUSD - All Time Logarithmic Scale Chart (Halving Cycle)IDEA UNDER CONSTRUCTION.
Further study:
www.youtube.com
finees1985.wordpress.com
BITSTAMP:BTCUSD

Trading by trends and important areas using the example of BTCCombined a teaching idea and a trading idea. Trading is relevant now. A pair of BTC/USD , a favorite pair of vanguards.
First, I will describe what is happening at the moment and how to trade, provided that you do not trade intraday. Then I will give training material for real use, and not fortune-telling on coffee grounds.
At the moment, a formation like a symmetrical triangle has formed from secondary trends, I wrote about its formation more than 8 months ago. When altcoins will start to be pumped up and under what conditions I also described was in this trading idea. As you can see, everything is going according to plan.
Also, an upward wedge has formed in an upward (bullish) secondary trend. In most cases, it breaks down. Perhaps they still reach the resistance of the downtrend symmetrical triangle (purple line), this would be reasonable for further growth.
An ascending wedge is formed when price growth slows and a narrowing figure forms. Prices can no longer rise further, but at the same time, they continue to very uncertainly update local highs. This suggests that the pressure of sellers (bears) is gradually increasing in the market. And the wedge is very likely to be broken down by sellers.
Imagine giving preference to more likely movements, but always have a backup plan. After all, no one knows the future, even the one who creates it. Therefore, in addition to working in a trend and with patterns, work with important areas of support, resistance, and intersection of trend lines. The more important the levels intersect with the trend ones, the more strongly they can affect the further price movement. In these important areas, either trend reversals and further strong breakouts along the trend always occur. I showed them on an example in the graph.
There should be a strategy and plan. At the same time, your strategy and plan should be plastic from market situations.
Think ahead what the crowd will do in certain situations and how it can be punished. Think about how you would do to earn, punish, and “honestly” deceive. Be flexible and smart, calculate in trading all your and other options for action in advance.
Remember - the crowd is always stupid, the crowd is always punished, if they give you money at the beginning, then only to believe in her genius and rightness, and then pick up many times more against her expectations! Think not from the position of a slave, but from the position of a slave owner.
The symmetrical triangle formation that I showed in my trading ideas more than 8 months ago, I saw in the TOP traders only at the end of November. Identify potential formation when the shape is not yet fully formed. Obviously belated observation. But this is how human psychology is built. It’s hard for people to think ahead, so they taught, they see only what they show. The blind man does not want to go without a guide, it’s more convenient.
Previously, media traders did not understand that according to the logic of things, to create the uncertainty of going to the "million dollars" or "$ 100", you need to draw a figure of uncertainty on a global scale, with equal working out up / down in a ratio of 50/50 - a symmetrical triangle is ideal . In any case, the crowd can be deceived on a large scale against its expectations. That figure of such enormous size! When breaking up / down, the triangle fulfills the TA along its width - a figure of this magnitude has a fantastic, shocking working out in any direction.
The faith of the majority imposed by the minority destroys the mountains and minor minority deposits.
If we consider that, according to the rules of TA, in which the majority of the crowd believes, but does not understand why it works / does not work in certain situations. If they believe, then they follow. If they follow, it means by faith - they buy / sell, place orders. Unconscious action - embodies the theory into reality, the main thing for the guide is to direct their faith in the right direction and shape their thinking.
Somewhere the rules of technical analysis work, and somewhere they work only because someone allows them to work. Playing along with the crowd in what she believes.
The ideal option is when they push the price into a corner, they will decide what to do depending on what the crowd will believe in.
Probably there will be massive FUD news, bad / good on all state and hamster fronts, naturally in order to inspire uncertainty. Uncertainty and the "opportunity to not have time" to buy / sell - a friend of the manipulator.
Give the crowd faith in the price movement that they want, give them a sweet illusion of their faith. Let them believe in their strength and genius. And then kill the faith at the most unexpected moment.
It is necessary to instill doubt. No one will take passengers ... Passengers must stay on the platform. And whoever gets knocked off by the most inadequate Stop-loss will first wait, doubt, bite their elbows - and then they will jump into a train that has already gone far.
In the game against the crowd, only time decides the question of when the average zeroing of the deposit in the average person will occur.
It is also necessary not to exclude the option that when they adjust the price to the resistance of the triangle (a downtrend), everyone will believe that, now everyone will push the price down from resistance - a breakdown of the formation will occur.
One must understand that everything is done against the faith of the majority. I often use this in my trading.
80% of cases allow the crowd to earn + 20%, only to then take away 80% from her.
Here is a trading idea with the potential formation of a symmetrical triangle.
The idea was published in June 2019.
BTC is the possible formation of a global triangle. Altpump
BTC / USD This formation looks like this on a global scale from the very beginning of the history of bitcoin.
The same trading idea was published more than 8 months ago in June 2019.
The main thing in this work is always to trade in a trend. You should never go against the trend.
On a bull trend it is better to always work on the bull side; on a bearish trend, on a bearish side. Always follow the trend!
A trend is called a visually detectable rise or fall in price.
Types of trend:
1) Rising (bullish) - the market is growing;
2) Downward (bearish) - the market is falling;
3) Flat (horizontal, lateral) - movement is observed in the horizontal range.
According to the Dow theory, there are 3 types of trends:
1) main.
2) secondary.
3) insignificant (small).
The main trend is a key market movement. To determine it, you need to open a larger timeframe on the chart, say, monthly or weekly. This global trend ultimately affects everything, including secondary and insignificant trends. According to the Dow theory, the global trend lasts 1-3 years, which, however, can change.
The main trend remains valid until there are clear indications of its completion. One such indication may be, for example, closing the price below the trend line.
A secondary trends , as a rule, goes against the main trend or acts as a correction to it. This is how the main trend can go up, and secondary trends - down.
According to the Dow theory, secondary trends last from 3 weeks to 3 months, and the rollback against the main trend lasts from 30 to 60% of its movement. Also, the secondary trend is usually much more volatile than the main one. All these values are conditional, depending on the characteristics of the trading instrument itself.
Minor trend (small) . In theory, this is a market movement lasting up to several weeks. As a rule, it represents a correction to a secondary trend. In reality, the duration of the trend depends on the trading instrument in question.
________________________________________13
A trend has three phases. According to the Dow theory, each trend has 3 key phases:
1) phase of accumulation (distribution).
2) the phase of public participation.
3) phase of panic (realization).
Read more about Dow theory, trend types, and phases in this tutorial:
TRAINING. Theories of the Dow. Types of trends. Phase TRON. Still a little)
Going against the trend is the same thing that falls under the locomotive and hoping that it will not transmit you, but will bounce off of you!
When working with a trend, it is very important to determine the correct trend. Understand which trend you are in and which particular trend you are trading. Each timeframe has its own trend. The market is fractal. Consists of small as big matryoshka.
Trading is the hard way to easy money. It is open to all, only not all will pass ... The more a person is fixated on the final result, and not on the action now, the less chance he has to go this way to the end. Most of these characters, which means the market will still be profitable.
To determine the main trend, a good weekly or monthly chart is suitable, secondary and insignificant - a daily and even smaller timeframe. These trends that are relevant for trading now on the BTC / USD pair I showed on the chart with important areas of trend reversal.
When working in a trend near important areas of a trend break, do not try to buy / sell at lows / highs, work in those price areas where there is liquidity. Sell at the very maximum and buy at the very minimum - leave the hamsters. When confirming a trend reversal, exit the position. Do not be greedy in the trade. Greed - begets poverty.
________________________________________18
Also under the article I attached 20 teaching ideas, many teaching ideas have material that you will never find in TA books. How it’s not customary to talk and show about it).
In almost all ideas, training was online "on a live schedule" in real trading. I did not show "skill" on old schedules.

Buying and selling the 50 & 200 MA made easyFirst mark matching crosses then switch to line break chart. Room for one mistake only i.e. whipsaw. NOT ADVICE. DYOR.

FLASHING RED!! BRACE! 🚑😲This is serious picture emerging right now. Have a look. I'm watching what's happening with Gold in relation to the Down Jones Transportation Index, and Bitcoin. This is all coronavirus related.
In tight summary, the smart money is moving into things that store real value - the kind that's unlikely to be affected by central banks.
Disclaimers : This is not advice or encouragement to trade securities. No predictions and no guarantees supplied. If you make decisions based on opinion expressed here and you lose your money, kindly sue yourself.

BTCUSD 4H MACD TREND FOLLOWING STRATEGY(Rules for A Buy Trade)
Step #1: Wait for the MACD lines to develop a higher high followed by a lower high swing point.
The first rule of thumb to recognize a swing high on the MACD indicator is to look at the price chart if the respective currency pair is doing a swing high the same as the MACD indicator does. A higher high is the highest swing price point on a chart and must be higher than all previous swing high points. While a lower high happens when the swing point is lower than the previous swing high point.
Step #2: Connect the MACD line swing points that you have identified in Step #1 with a trendline.
At this point, we really ignored the MACD histogram because much of the information contained by the histogram is already showing up by the moving averages. Look at the price action now and compare it to our MACD trendline we drew early. We can clearly notice that the MACD contains the price action much better and reflects the trend much clear.
But, at this point, we’re still not done with the MACD indicator, which brings us to the critical part of our MACD Trend Following Strategy.
Step #3: Wait for the MACD line to break above the trendline. (Entry at the market price as soon as the MACD line breaks above).
When the MACD line (the blue line) crosses the signal line (the orange line) it’s an early signal that a bullish trend might start. However, if trading would be that easy we would all be millionaires, right? And that’s the reason why our MACD Trend Following Strategy is so unique. We’re not only waiting for the MACD moving averages to cross over but we also have our other criteria for the price action to break aka the trend line we drew early.
This is a clever way to filter out the false MACD signals, but you have to be equipped with the right mindset and have patience until all the piece of the puzzle come together. If you were to trade just based on the MACD crossover over time you’ll lose money because that’s not a reliable strategy. But if you use the MACD indicator along with other criteria such what this strategy tells you to do, you will find great trade entries on a consistent basis.
Step #4: Use Protective Stop Loss Order. (Place the SL below the most recent swing low).
Now, that you already know how to enter a trade at this point you have to learn how to manage risk and where to place the SL. After all, a trader is basically a risk manager.
You want to place your stop loss below the most recent low, like in the figure below. But make sure you add a buffer of 5-10 pips away from the low, to protect yourself from possible false breakouts.
Basically, a good entry price means a smaller stop loss and ultimately it means you’ll lose a lot less comparing it with the profit potential, so a positive risk to reward ratio.
Step #5: Take Profit when the MACD crossover happens in the opposite direction of our entry.
Knowing when to take profit is as important as knowing when to enter a trade. However, we want to make sure we don’t use the same trading technique as for our entry order. When the MACD line (the blue line) produces signal line crossovers (the orange line) we want to close the position and take full profits.
Before taking profits, it’s important to wait for the candle close – either the 4h or the daily candle – depending on the time frame you trade so you make sure the MACD crossover actually happens.
Note** The above was an example of a buy trade using the MACD Trend Following Strategy. Use the exact same rules – but in reverse – for a sell trade.

"Bitcoin kissing this beauty" update showing greater accuracyReally hard with trading view to get great accuracy. Try it out yourselves. NOT ADVICE. DYOR.

Is Bitcoin Bearish or Bullish, $10k or $5k? Everything ExplainedWhen charting (TA), we look at multiple timeframes and each timeframe has its own meaning and tendencies.
Bitcoin (XBTUSD) can look bullish short-term, 1H timeframe while looking bearish long-term, weekly (W) timeframe, as an example.
Charts are always changing... This is something to keep in mind.
The 1H (short-term) chart can look bullish and strong at one point, but only a few hours later everything can change if a support level is broken.
It is important to pay attention to the timeframe.
Right now we are looking at Bitcoin (XBTUSD) again on the 1H timeframe and this chart is now bullish, compared to earlier to it was bearish... but why?
Prices are now trading above EMA10/50/100 and MA200 before prices were trading below those levels.
Trading volume is starting to increase before the trading volume was low...
This is how it all works... We translate what is coming from the charts.
Bitcoin right now is bullish short-term... Thanks a lot for your support.
Bitcoin Higher Low, Bounce In-Play | Next Target Mapped (Trade inside)
This is our full LONG Bitcoin (XBTUSD) Trade.
Remember to hit LIKE to see the full trade details...
Namaste.


Moving AveragesThe best (most interactive) MA/EMA's can be great confluence factors for picking high R areas of interest for taking or exiting positions. When more than one MA occupies a specific price point/zone (particularly higher MA's), there is a lot more liquidity due to the congruence of different strategy traders and bots taking positions around both (or more) of the MA's.
If you can read em, you can trade em.
*Also wtf is with this shitty triangle haha thing is taking so fucken long to resolve

DASHBTC LONG - Today's watchlist favorite Hey everyone,
After calling a setup on Dash that failed to trigger, the same setup is back a few days later.
Looking for more consolidation on lower timeframes and expect it to resume the uptrend soon.
Take care,
Vlad The Crypto Trader

THE HOOK TRADE ... OUTPLAYING A BULL TRAPThis is my favorite trade. It is simple, logic, sure and damn effective.
For this trade you have to identify 2 things.
A trend and a price equilibrium.
In this example we have three clear bullish impulse and 2 corrections.
After the top at 10480 there was a decreasing selling pressure over the following three candles (smaller candle bodies). The firth candle was positive and with same size as the third suggesting the formation of a price equilibrium over 4 days and a possible new higher low. The fifth candle confirmed that the trend was resumed and the buying pressure overcame the selling pressure.
As the price action resumed the trend and equilibrium was broken on the upper side, a break of the price under the equilibrium is a strongest predictor of trend inversion and short a position can be safely opened. Target is a full retracement equivalent to the price retracement from the top to the equilibrium.
Top to equilibrium = equilibrium to target
BIO


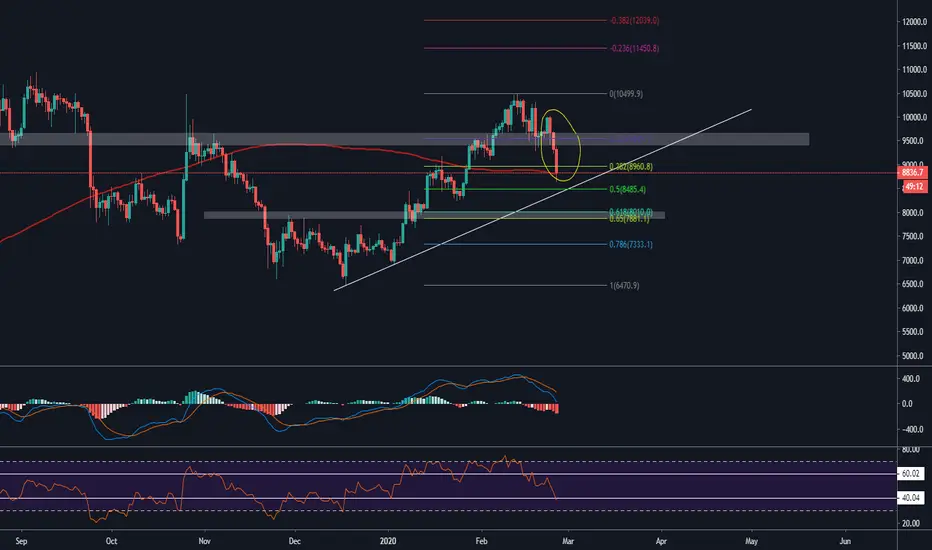
Bitcoin : Down we go!Hello all, we have seen a very violent drop today of bitcoin. Will this down trend moves continue?
Looking at the chart presented, we have seen a very violent drop for bitcoin . The price has dropped for more than 17% since it reached the interim swing high on February 13th, 2020. I want to give highlight to some levels and factors of bitcoin:
1. Red dynamic line is the 200 Moving average on daily based. we have seen that the price is now trending just slightly above this dynamic support. We have to be aware of this level. if it breaks, we'll see trend continuation to lower support zone
2. Support trend line has already formed since December 2019. We can assume this area as a potential support to catch any bounce.
3. The golden pocket zone however will always be a very crucial level for any asset. And the golden pocket zone is having an alignment with the $8000 region as the area of heavy price action. we could see this area as a potential bounce area.
We have seen 3 crucial supports that we should watch in middle term. But, how is the sentiment and the momentum in the market? I see some factors that will be good to identify current bias
1. MACD : For some reasons, MACD is actually very bearish with the ticking down histogram comparing the previous close and the moving average is curving down to reach the negative area.
2. RSI : it's entering below 40 zone which is potentially the bearish zone and whenever the RSI entered this zone in the past, there was a massive sell off in the market.
3. Price action : Since the price reached the interim swing high since February 13th , there were some bearish type of candles has formed. And with the last 3 days candle with a huge red, is showing us the the massive sell off is occuring now.
Looking at the above analysis, I feel like there could be a push toward the downside is likely for bitcoin. 3 areas of supports that I've mentioned above could be a nice place for bounce but, we must always assume it as a relief rally only. I see that in the long term, there is still far from the bottom, maybe there might be a possibility for making lower low in higher degree. For now, just be focus on the 3 areas mentioned above to catch a little potential bounce.