🔥✅HOW TO GET 70% WIN RATE USING VOLUME PROFILE🔥 Hi friends! Today we will talk about a very important trading tool that can give you 70% win rate if you will know how to use it as a pro trader. This tool is a volume profile.
📊 WHAT IS THE VOLUME PROFILE?
The volume profile is a real traded volume. Unlike the usual vertical volumes that show the amount of volume traded over a certain amount of time, the horizontal volume shows the volume traded over a certain price range.
The volume profile has 2 components:
🔥 value area (yellow areas), which is the biggest resistance/support for the price. There can be several value areas, but the largest value areas called HVN or High Volume Nodes.
🔥 liquidity gap (white area) is the area where the least volume is traded. Usually, the price "cuts" through these areas very quickly.
📊 HOW TO USE THE VOLUME PROFILE?
I want to show you how it works. If we want to understand the next price movement, we should identify the biggest value areas. So you see the most significant liquidity (value) areas and wait when the price tests it:
1. if the price breaks the value area and tests it as support , you can enter a trade because bulls are strong and the price should go higher.
🚩 The clear trade example on how to use HVN (value area) as support (+20% of clear move).
2. if the price test it as resistance , this means that bears are stronger and bulls haven`t enough power to push the price higher.
🚩 The clear trade example on how to use HVN (value area) as resistance (+26% of clear move).
So the value areas or HVN are a stop on the way of price movement in one direction or another. The better you determine where the price will go after testing this HVN (value area), the more profitable you will be.
🚩 If you use this approach on lower timeframes, you can get more trades. This is ideal if you are an intraday or swing trader.
Try using horizontal volumes yourself, and in the following ideas, I will tell you how I and other advanced traders use them.
✅ So this approach has 50-70% win rate, but if you want to increase it, you need to use additional filters.
Personally, I use the DOM and Footprint to identify the whales' orders and buy crypto with the big guys. These indicators can easily add 25-35% to your win rate. I make a lot of video lessons and articles about them, so enjoy and make money.
💻Friends, press the "boost"🚀 button, write comments and share with your friends - it will be the best THANK YOU.
P.S. Personally, I open an entry if the price shows it according to my strategy.
Always do your analysis before making a trade.
Bitcoin (Cryptocurrency)

📊How to use HORIZONTAL VOLUMES? Tutorial with examples!Horizontal Volume Indicator or Volume Profile is a simple indicator that helps to identify: value areas (support or resistance zones) and liquidity gaps. In this idea I will explain how to use the indicator and mark these areas to make trades and why it works.
Let's start at the beginning.
💹What are value areas (support and resistance zones)?
🔶The value zone is the price range at which the most trades are made. On the chart we can mark the value zones: 33600-41000, 46000-49500, 54600-58200. I also marked how these zones were support or resistance to price. The value zone becomes a support for price if the price, when it is tested, does not continue its downward movement. A value zone becomes a resistance if price does not continue to rise above that zone. The zone simply doesn't let the price go higher because there aren't enough buyers.
🔶Liquidity gaps are called that way because no trades were made in that zone and there is no liquidity for traders (buyers or sellers), and price, as we know, goes from liquidity to liquidity (from one zone to another). On the chart I have marked for you the liquidity gaps and we can see that the price can' t stay in these zones for a long time.
✅Why do horizontal volumes work? Price reacts to these zones for a simple reason. Many traders pay attention to these areas and put their limit orders to buy or sell or when the area is tested, so the price moves up or down. If there are more sellers than buyers, the price will go lower and lower ; if there are more buyers, the price goes higher and higher.
🚩How can I add this indicator to my chart?
3 steps to add the indicator to your chart:
1. open "prediction and measurement tools" at the left part of chart
2. choose the "Fixed Range Volume Profile"
3. choose the price range from some date till another date. I chose from Dec 10, 2021 till May 6, 2022.
So now you can see and mark all areas on your chart.
🏁This indicator helps to identify areas and can suggest stop points or price reversal, but it should be used with different methods. If the market is in a strong rising trend (UPTREND), it is unlikely to be stopped by a local zone of value, but a global zone may stop it. Also, the support zones can be good entry point. Be more tricky than the market and use different tools. You can use the indicator on different timeframes for scalping or swing trading and with different ALTCOINS. Also, pay attention to the volume indicator, trend lines and key levels that I show in my ideas.
💻Please write in the comments if you still have questions about Horizontal volumes! I`ll try to explain you additional tips 🎇
Press the "like"👍 button, write comments and share with your friends - it will be the best THANK YOU.
P.S. Personally, I open an entry if the price shows it according to my strategy.
Always do your analysis before making a trade.

🔥🚩POINT OF CONTROL: THE MOST USEFUL TOOL FOR TREND TRADER🔥 Hi friends! Point of control is a part of volume profile indicator and very useful tool to identify upcoming BTC or any other asset move. I will explain you how to use this tool in your trading and make a good profit in this idea.
💹 Horizontal Volume Indicator or Volume Profile is a simple indicator that helps to identify: value areas (support or resistance zones), points of control and liquidity gaps.
📊 HOW TO USE POINT OF CONTROL
Point of control (red line on the chart) is the place of the largest accumulation of liquidity. We can say that this is the place of "the biggest battle between bulls and bears":
🔥the point of control becomes a resistance in case of "bears' victory" and crypto start to fall
🔥the point of control becomes a support in case of "bulls' victory and crypto start to grow
🚩 When one of the sides wins the "battle", this is the best time to enter the trade in short or long.
✅ No matter how complicated this tool looks, it is very easy to use:
1. extend the volume profile indicator from the lows to the highs. The indicator automatically shows the largest accumulation of liquidity showing POC (red line).
2. wait until the price tests the POC as support or resistance . From time to time the price can consolidate directly on the POC, which indicates the "battle" of long and short traders.
Pay attention to the chart. I have selected for you 4 cases of using POC on the volume profile:
1. Bitcoin just touched the POC at $39,700 and bounced up 72%.
2. the price tested the POC as resistance at $61,100 after which the price fell by 45% from the absolute highs.
3. Bitcoin consolidated around the POC at $39,000 for some time. The price fell by 31%.
4. POC is at the price of $19,150 per Bitcoin. Now you have to expect the price to return to this level and carefully watch the price reaction on POC.
🔥If the POC is tested as resistance , then it is very likely that we will see the level of $13,000-14,000 for BTC.
🔥If the POC is tested successfully as support , then the price will be able to make higher highs and start a bullish trend for Bitcoin. I talked about this scenario in previous ideas.
🚩 HOW TO ADD VOLUME PROFILE INDICATOR WITH POC TO YOUR CHART?
3 steps to add the indicator to your chart:
1. open "prediction and measurement tools" at the left part of chart
2. choose the "Fixed Range Volume Profile"
3. choose the price range from some date till another date.
So now you can see all important value areas and point of control.
✅ Point of control help you to identify the power of bulls or bears on different timeframes and make the right trading decision in the most of cases. Personally, I use this tool effectively for swing trading and scalping as well.
Traders, do use this indicator and such tools as POC in your trading? What is your favorite idicator for trading? Let me know in the comments.
💻Friends, press the "boost"🚀 button, write comments and share with your friends - it will be the best THANK YOU.
P.S. Personally, I open an entry if the price shows it according to my strategy.
Always do your analysis before making a trade.

Criminal Activities in Crypto MarketThis year, crypto-related hacking has high activity. Since the beginning of October, approximately $718 million worth of cryptocurrency has been stolen, bringing the total for the year to over $3 billion. However, numbers are currently 65% lower than where they were at the end of July in 2021.
In addition, revenue from scams has roughly decreased in accordance with Bitcoin prices from January 2022. Not only is scam revenue declining, but the total number of individual transfers to schemes in 2022 is at its lowest point in the previous four years.
In addition, these figures imply that less individuals than ever are falling for Bitcoin frauds.
Crypto scams
● Investment scams: Pump-and-dump schemes are an example of investment fraud. A fraudster
will convince you to purchase an obscure cryptocurrency at a "cheap price" promising that the
asset´s value would soon soar. When you purchase, the price increases. However, later the con artist sells off their holdings at a higher valuation. That is causing the price to drop and leaving you and any other victims in the red.
● SIM- Swap scams: This is also one of the most recent types of crypto scams that exist today.
They take place when a con artist obtains a duplicate of your SIM card and has full access to
your phone´s data. As a result, the victim may not even be notified. The victim´s cryptocurrency
accounts may be already compromised and deleted.
● Fake Crypto Exchanges and Crypto Wallets:
Your social media accounts will show you websites that promote affordable Bitcoin with huge returns on the initial investment. When customers pay a hefty initial charge, they are routinely prompted to spend additional money. In addition, you´ll probably discover that your money is missing when you try to withdraw it.
● Upgrade scams: Scammers trying to persuade customers agreeing to fraudulent transactions or
giving over their private keys represent one of the most immediate concerns.
● Phishing scams: Although they have been around for a while, phishing schemes are still widely used. To get personal information such as the password to a cryptocurrency wallet, scammers send emails with nefarious links to a fraudulent site. It is troublesome to change the cryptocurrency key. Therefore, each key is exclusive to a wallet. As a result, a new wallet must be made in order to change this key.
Tips for avoiding scams
Investment scams are obvious once the provider claims there are huge returns on investment and there is no risk regarding your loss of money.
Never enter secure information from an email link to protect yourself against phishing schemes.
The individual has to go directly to the official website to verify it. Also, regarding the scams such as fake crypto exchanges and crypto wallets, stay with reliable exchanges and wallets with a substantial user history to avoid similar frauds.
In fact, you should assume a wallet´s website is a fraud and move on if it makes an attempt to look like a well-known company. Last, you can prevent SIM swap frauds by using strong passwords and security questions along with locking the phone with your service provider.
In a nutshell
Nobody enjoys a crypto bear market, but there is one positive aspect. Criminal cryptocurrency
activity has decreased slightly alongside that of respectable activity. However, it appears that
criminal activity is more robust to price declines. Compared to respectable quantities, which are
down 36% year over year, illicit volumes are only down 15%. The US dollar is the most often used currency for these kinds of fraudulent transactions.
Even though there are many scams existing in the crypto market, more users know how to spot possible scams right away because that is not something new and unseen. However, the numbers of illicit activity are still high. Yet with new security protocols, there is hope that fraud can be slowed down in overwhelming the cryptocurrency market. There is no denying that cryptocurrencies have been used in illegal behavior, but the same can happen with any type of money in existence.
The most important action users can take is to protect their private information as best as they can.

Paid in Cryptocurrency: The Salary Of The Future?With the introduction of cryptocurrencies into our lives, there have been changes in the economy and our habits. In this century everyone wants to access everything easily and quickly. Likewise, employees want to be paid in time without any effort. So, now we talk about the new idea of salary with cryptocurrencies. These days some brands have started to pay in cryptocurrencies. However, we should take a
look at positive and negative effects and also how and where we can find that kind of job.
First of all, I want to explain how and when cryptocurrencies started. At first it was a long time ago when they found the crypto.
Over years they developed the cryptocurrencies and in 2009 Bitcoin has joined our lives. After Bitcoin came out,
most people realized the importance of crypto.
Actually, it was a good idea to invest in Bitcoin because it was so expensive and you could double your money.
After Bitcoin, some altcoins have started. Ethereum, Dogecoin and many more altcoins are also quite famous.
In fact, a lot of people earn money thanks to cryptocurrencies. But you should be wise about it because it’s like gambling.
Therefore, you should be aware of the risks.
POSITIVE ASPECT OF BEING PAID IN CRYPTOCURRENCY
First and foremost, when receiving payment with cryptocurrency, it doesn’t include any tax. Also the transaction of crypto money is so easy. You can do it
from an application. Another positive aspect of being paid in cryptocurrency is that it can be converted into any currency internationally.
Moreover, for companies looking to hire more employees to work online, crypto can be a great way to pay staff evenly and then have them convert to their local currency.
NEGATIVE ASPECT OF BEING PAID IN CRYPTOCURRENCY
Like every good thing, crypto also has a lot of risks as I mentioned before. In particular, you can either earn good or lose for good, so it can be tricky in many cases. In fact, you can check data and do your research but in the end, you never
know for sure. There are lots of parameters that affect the market prices.
Sometimes that relies on other markets, or politics, or sectors, or even a person. By ‘a person’, you might have an idea of who we are talking about. Of course, it is no one other than, mighty Elon Musk.
In 2021, Elon Musk changed the whole market prices by just mentioning Bitcoin in one of his tweets. Something similar happened when he put the symbol of Bitcoin into the description part of his account. But of course, he is fully aware of his
actions. These actions may be a game to him but ethically, the situation he caused is not fair. In times like this, what is fair is not so important. This is because there is nothing to do to change what happened. Crypto-market can get affected by many different concepts. Because of all this, paying in crypto can be risky and should evaluate positive and negative aspects carefully.
HOW AND WHERE CAN YOU FIND A JOB PAYING IN CRYPTO?
If you want to find a job and receive payment with crypto money, there are a lot of websites and applications for that. For example, you can check out these; Bitcoiner Jobs, Proof of Talent, Crypto Jobs, AngelList. You need to apply them with your CV and you should explain why you are interested in this kind of job. Also you should highlight that you know all the risks. There are vacancies for social media managers, product managers, Graphics designer, Bitcoin Developer etc. So, if you are curious or just fond of trying something new, here is your chance!
I hope you found this post informative and beneficial. Feel free to leave a comment :)

Trading with 0 stress👉So you see a trading opportunity. It looks like a fair setup. You get confirmation to enter, but you hesitate. You're afraid of losing money, or you have some anxiety that keeps you from pulling the trigger. This is a problem that almost all traders face at some point in their trading career. I too have suffered from fear of losing money and this problem has led to other mistakes that have stopped me from executing my best trades. Today I share my process of what I did. To reduce my anxiety while trading and the actual steps I took to improve my trading execution.
❓ Do you think the color of the candle affects you while trading? Of course it does. Feel free to tell me if this sounds familiar in the comment section. You enter a long trade expecting the market to go up. You gain a few %, then the price turns against you and forms a red candle. And you start watching the movement, especially each candle pointing down. And you focus on the red color of the candle.
😱You get more and more anxious. When another red candle forms. This was a big problem for me in my early years. I closed my trades after a few minutes. When I saw more red candles below my entry point. The solution to overcome this is simple:
🧨 Change the color of the candles to one color. This way you will only track the price and its range.
Let me ask you, which of the texts on the screen is the one that is easier to read? The single colour or the multi-colour? There is a phenomenon in psychology called visual perception. Your brain is always looking for patterns in commerce. If you use multi-coloured candles, you reduce your ability to recognise patterns. Let me repeat that. Your brain is looking for patterns, and one of those patterns is similar colors. Colors affect your brain, your emotions, your feelings. Your psychology, potentially your trading ability. To trade best, you need to trade in a neutral, unbiased state of mind. I've bought in the past because of fast moving red or green candles, I've made bad trades, both on entry and exit. If you get anxious during an open trade, use candles of the same color. So try this simple tip to reduce your reaction to price movements. Change the colour to anything but not to red. Blue or green, yellow or white candles. Just stay away from red and give me a feedback in a week or so. I find myself calmer using a single color for the up and down candles. Maybe this little brainstorming session will help relieve some of the anxiety.
👉 Here's another situation. You see a long opportunity. The price is around the key level and you need to decide. You pull the trigger at, say, $50. You say to yourself, "Wait, I'll wait until... until the market drops a few cents. The market drops to $50.02, but you're still waiting. And then the market goes back up to $50.10 and... you say to yourself, I'm not getting in now. That's a worse price than five minutes ago. I'll wait until it goes down again. And of course the price never comes back. It goes up without you. And now you're frustrated because you anticipated the move, but your perfectionism... prevented you from pulling the trigger. Fear of losing money and perfectionism can lead to irrational behavior, overanalyzing, overthinking and slowly draining your mental energy.
🟢 One of the problems I personally struggled with was. That I wanted to be perfect in my trades. I was looking for the perfect opportunity. You know, when you enter and the price never goes against you, not even one %. Being a perfectionist in trading is stressful and always being on the edge doesn't help you make good trading decisions. In most cases, when you are waiting for the perfect entry, you realize you just missed a big move. Trying to time your entry precisely, at the entry point, is a foolish undertaking. Perfection can be your biggest enemy in trading and can cause you a lot of stress.
🟢 Here's how to reduce that anxiety. Use ranges instead of exact prices. As a day trader, you will not be able to track price movements every minute of the day. That's why you should use price ranges instead of exact prices. This gives you some flexibility. And of course you still need to be strict with yourself when executing your plan. Good traders are vigilant, yet patient. When a lineup they've been waiting for pops up, they grab it without hesitation. But until that time comes, they won't budge. The price fluctuations that lure other traders. They choose to reserve energy for what they are prepared for and ignore everything else. They don't chase the market, they let the market come to them. The opposite of this is forcing trades. You know the feeling when you wait for a trade, see some activity, and pull the trigger early. You force the trade. I did that almost every day.
🟢 Here's the solution. Stop using market orders and use limit orders instead. Basically let the market come to you. Once you have selected the assets you want and done your analysis, you need to determine the prices where you will buy and sell. Your goal is simply to buy and sell at the best possible prices, and use your research to identify reasonable prices in advance. Not only will this help you get a better deal, it will also help you avoid emotion-based trading. The simple solution to reducing stress and anxiety is to only act when the conditions are what you expect. Letting the market come to you is a difficult but valuable skill to learn. So forget market orders and use limit orders. This will reduce your emotional involvement and prevent you from making bad decisions.
🟢 If you want to reduce stress and anxiety while trading, you should switch to higher time frames. This will allow you the time needed to make informed decisions. I know you will find it difficult at first, but you will continue to struggle with anxiety and stress until you make the change. If you are feeling nervous and afraid of losing money, I highly recommend trying the higher time frames. Again, this transition to higher time frames is difficult and most traders are reluctant to switch. But you need to change your environment if you want better trading performance. If you trade in an environment like the 1-minute or the 5-minute chart, you risk the risk of market noise. True, higher time frames don't offer trading opportunities with as much speed, but the signals generated are more reliable and have a much higher chance of working. Better to trade a handful of good quality trades. Rather than trying with many poor quality trades. Daytrade trading is exciting, but it also requires you to monitor price movements for many hours. Most daytrade traders initially like the excitement and moving on lower time frames, but it's only a matter of time before they experience mental burnout, and once mental discipline is exhausted, greed, frustration, anger and impatience will bring bad trades and send you into a dangerous state of mind from which it is difficult to recover. So move into higher time frames. You'll only spend a fraction of the time in front of the charts, and you'll be at less risk of burnout. After a while, you'll find that it becomes much easier to work with a cool head while maintaining mental and emotional discipline.
🟢 How often do you enter trading? The setup looked great, then the price went straight away to your stop-loss before it got to your take profit level without you. Without profit, this is probably the most frustrating scenario many traders face on a daily basis. Because you fear losing money, you tend to use small stop losses. You don't want to make a mistake and try to keep your losses small, but keeping your levels too close to the entry candle is a recipe for having your account cut to pieces. A tight stop relies on you having very precise, near-perfect entries, and we've already talked about perfectionism in trading. If you repeatedly see your stops being hit regularly before the price turns in the original direction, it is very likely that you have placed your stops at levels that other traders use, especially if you trade on obvious price movement patterns. My advice is to start trading with a wider stop loss and a lower position size away from the entry. The position size you use should be small enough that neither a loss nor a gain will affect your mindset and ability to continue trading, only then will you really focus on proper execution.
🟢If you are trading the markets with your hard-earned money, but you don't know what your trading strategy is and you don't trust your market analysis skills. You probably shouldn't be trading with a live account. One of the biggest reasons why you are nervous and afraid when you trade is that you will lose your money because you don't trust your own trading skills. You may not have learned a trading strategy. You do not have a trading plan, you do not keep a trading diary. You are simply not prepared to take risks. Real money at risk in the markets. That is why you feel fear when you trade. Basically, trading anxiety comes from not knowing what you are doing. I have talked many times about the value of a trading log. The key is to use your trading log to keep track of when you are at your best and when you are at your worst when it comes to your trading and your emotions. I pay close attention in my trading diary to times when I make mental mistakes, such as not trading a good trade when I know I should. When I am afraid of losing money or avoiding a good trade, I look for triggers and patterns. Was I confused? Did I make that mistake in a particular market situation? Do I have certain feelings and emotions from previous trades? These are the intangible factors that you need to track in your trading log.
🟢 Most traders are fixated on short-term results. They make money by pressing a few buttons and don't pay attention to the process that makes it possible. They make mistakes, learn from them, and correct them over and over again. Everyone thinks about winning, but few think about the benefits of losing . In my experience, most wins are directly attributable to a big losing trade that I learned from making money in the past. As a trader it makes no sense if you don't understand why/why you can't repeat. Similarly, losing money is a valuable experience. If you understand why you lost. Paradoxically, you cannot understand why you win. Without first understanding how you could have lost in the same situation. So change the way you think about losses, because they will show you the direction of repeatable victories in the future.
If you've already lost, at least don't lose the lesson.
Take care my friend and have a good trade!

How many Crypto Currencies are there?You’d probably think there are around 100, 200 maybe 1,000 crypto currencies.
And that’s because the news only covers a handful, but I think you would be surprised at the actual number.
Right now, there are over 12,000 different crypto currency coins out there.
And they are increasing by 1,000 new crypto currencies every month.
The amazing thing is, unlike shares, these coins are very easy to create and regulate - YOURSELF.
You can even hire someone from Fiverr to make you a crypto-currency for less than $20.
I could even get a MATI Trader coin made if I wanted to.
But this isn’t good news in my opinion.
You see, most crypto currencies have very little purpose other than making money for their developers through investors buying and selling the coin.
So which cryptos do I trade?
For me it’s only down to two crypto currencies.
Bitcoin and Ethereum. The Father and the mother of the crypto market.
They are the biggest, most recognized and understood than any other crypto in circulation.
But the crypto winter is not over and the bottoms are not set yet.
There still needs to be a lot of fixing and regeneration of confidence before we see any upside with crypto…
I’m sitting on my hands right now, until we see a change in the trend.
BTC - Practical Descending Triangle Example! 🖋Hello TradingView Family / Fellow Traders. This is Richard, also known as theSignalyst.
I find BTC chart interesting as it is forming a textbook Descending Triangle, so I thought it would be a practical example to highlight it now.
📌 First, let's start with the definition of a Descending Triangle:
🗒 What is a Descending Triangle?
A descending triangle is a bearish chart pattern used in technical analysis that is created by drawing one trend line that connects a series of lower highs and a second horizontal trend line that connects a series of equal lows.
📉 Traditionally, a regular descending triangle pattern is considered to be a bearish chart pattern.
However, in my opinion, even thought a bearish continuation is more probable, all triangles are bilateral patterns. Means they can be broken either side.
📌 How to trade a Descending Triangle pattern?
🗒 Remember: A pattern would be an idea, until activated.
In our case, for the descending triangle pattern to get activated, we need an H4 candle close below the lower bound. (around 15500 in red)
In parallel, for the bulls to kick in, and invalidate the bearish scenario, we need an H4 candle close above the upper bound. (around 17100 in blue)
📌 Trade / Risk Management:
🗒 When the pattern is activated, you can enter immediately after the candle closes, or wait for it to retest the trendline first.
Regarding the stop loss, it goes above/below the last high/low from the other side.
Regarding the take profit, the project would be the biggest distance between the highs and lows inside the triangle.
Hope you find this post useful. Let me know if you have any questions.
Always follow your trading plan regarding entry, risk management, and trade management.
Good luck!
All Strategies Are Good; If Managed Properly!
~Rich

BTCUSD two possible scenario Hi, Bitcoin can follow one of this path. Please let me know your view..regards.
If you want to learn Market Structure advance strategy which is even more important than price action then do drop a message. Regards.

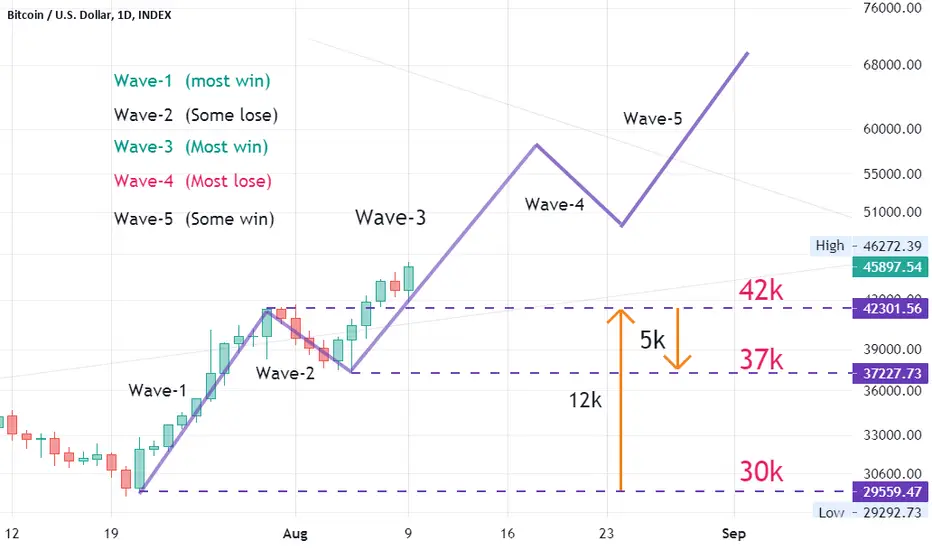
Bitcoin and Elliot playing in the waves of time!This chart by no means is a price prediction. It's a look into a possible future for bitcoin in the coming years based on Elliot wave theory. In this chart I am are assuming that Bitcoins next move is the start of wave 5 in Elliot wave theory. When ever it ends the theory states that a massive ABC correction will follow, which would kill the mania and be bitcoins first true BIG bear market. This correction ( crash ) would not only be devastating by price but also by time, as it would most likely last multiple years and be the longest bear market to date. It would physiologically kill the market, and it's this this bear market that would likely kill all the shit coins and show which projects will last for years to come. It's only a devastating crash like that would cleans the market of scams, that would then catapult all the survivors to the next level in the eventual impulse wave 3!
Time frame
My time frame for this to start is 2026 to 2029. It all depends on how long it takes for the first impulse wave of wave 5 takes.
How long will the bear market crash last?
The question that everyone would answered is the one question that no one can answer. It could be that some or most people might not see new highs for the rest of their natural lives... So 10 to 30 years... But I would say most likely 10 to 15 years would be in the cards.
What about adoption?
I believe that in this bear market is when the true adoption and the realization of the use and necessity of Bitcoin/blockchain/defi to the masses. This is where Bitcoin gains critical mass in my opinion, but it will take a long time. This is all hypothetical of course providing we haven't lost technology through war or any other interruptions.
This is my outlook for the next decade or so, but I might be getting ahead of my self.
Let me know what you think in the comment section down below.
Thanks for looking
*The only certainty is, that there is no certainty *

🔥✅HOW THE WHALES ROB YOU: 99% of beginners don't know about it!🔥 Hi friends! In this idea I will explain you a few methods how the whales (big players) take away your crypto and make money. If you want to be on the WHALES side and make money, you need to read this idea to the end.
Friends, push the "BOOST"🚀 button so in this way I understand that you enjoy such content and I will make more useful ideas for you. I know you like it!
🔥 So today we gonna talk about the capitulations and how whales robbed the beginners in trading. Also, at the end I show you ONE pattern that help you to avoid this and make money like the BIG player.
📊 Capitulation is the worst moment at the market for an trader, especially a beginner and the best time for a big player (a whale). Capitulation is a period of disappointment for the most players in the market and a massive sale of their own crypto because it has fallen in price or consolidate in narrow range for the long time.
🔥 There are 2 types of capitulation in total:
1. Price-based capitulation. It happens when the price of Bitcoin falls by 60-80% and the most traders start to sell their crypto because of fear to lose all deposit. Most likely, you have already heard about this type of capitulation.
2. Time-based capitulation. It happens during a long, exhausting consolidation and traders start think that it never end. This is happening now, but not many people know how it affects traders.
You can see the only ONE type of capitulation on chart. I marked just time-base capitulation because I'm sure that you already know about the price-based capitulation (usually, the global dump).
📊 HOW DO WHALES BUY THE BITCOINS?
Imagine that you are a big player who has 100-200 mln dollars. How can you buy such ammount of Bitcoin?
You do not have enough liquidity on the exchange to buy a sufficient amount of cryptocurrency with one order by simply pressing the "BUY" button. The max amount of BTC that you can buy for 1 order are about 5-7 mln dollars.
When you are buying for a larger amount of money, the price will just make a big shadow to fill your order and you can get an average entry point by +3-5% higher.
📊 Therefore, whales have several ways to buy crypto safely:
✅ buy Bitcoin from one or more large players (other whales, exchanges OTC, etc.)
✅ buy from a large number of small players on exchange during the consolidations
Both methods are great for a whale, but usually, if you buy such amount of Bitcoins from another whale, you can pay 1-2% fee , because you can get your Bitcoins immediately, instead of waiting for your buy order to be completed on the exchange.
🚩 Therefore, the best and cheapest way is to accumulate crypto from tired, exhausted retail traders who have no more strength to wait for cryptocurrency growth.
✅ Most often, they place limit orders at one price level or range and the price smoothly fills their limit orders. It is most convenient to do this on consolidation.
Below you see an example of whales accumulating Bitcoins NOW. The green circles show the number of Bitcoins that were bought by the whales in current $18,000-25,000 range.
It's clear example how the whales accumulate BTC during the consolidations. Of course, they have enough liquidity to BUY because the most of retailers bought BTC at $50,000-69,000 and now lost almost 70-80%. The retailers sold their crypto holdings in panic because want to save this last 20-30% of deposit.
The whales have another scenario . They sold at $50,000-69,000 to retail traders and now want to buy crypto at a 70-80% discount. That is how you should do to become the part of the whales too✅
📊 WHAT HELP YOU TO AVOID CAPITULATION, THIS ROBBERY AND GROW YOUR DEPOSIT?
I just want you to show 1 crypto pattern that help you to avoid from losing money and join the whales on the PUMPS. As you can see, after the red marked time-based capitulation the price of BTC make dump (or price-based capitulation). After this DUMP and green time-based capitulation starts the massive PUMP!
🔥 SCHEME: red time-based capituation (#1, 3 or 6) - DUMP - green time-based capituation (#2, 4, or 7) - PUMP 🔥
🚩 I show #5 for you, because this is also capitulation but not related to the previous pattern.
Now we see that the Bitcoin price is back in consolidation near #7. If we have correctly determined that #6 as a red capitulation and it was dump after it, then according to our pattern, a strong pump should begin very soon. Now you know only need to find the best entry poiny to your trade and make %%.
🚩 Our automated trading systems will tell us about upcoming PUMP also and we will be able to earn 200-600% from this growth, as it has always been.
So traders, today you have learned:
🔥 what are the types of capitulation
🔥 how whales buy Bitcoin and now you know how to act in the most dangerous moments for beginners. Now whales will not rob you for sure
🔥 a new pattern that you can use in your own trading and understand the global trend of the crypto market
💻Friends, press the "boost"🚀 button, write comments and share with your friends - it will be the best THANK YOU.
P.S. Personally, I open an entry if the price shows it according to my strategy.
Always do your analysis before making a trade.

FOMO, What is FOMO? Bitcoin exampleFOMO, What is FOMO?
Fear of missing out (FOMO) is the feeling of apprehension that one is either not in the know or missing out on information, events, experiences, or life decisions that could make one's life better. FOMO is also associated with a fear of regret, which may lead to concerns that one might miss an opportunity for social interaction, a novel experience, a memorable event, or a profitable investment. It is characterized by a desire to stay continually connected with what others are doing, and can be described as the fear that deciding not to participate is the wrong choice. FOMO could result from not knowing about a conversation, missing a TV show, not attending a wedding or party, or hearing that others have discovered a new restaurant. FOMO in recent years has been attributed to a number of negative psychological and behavioral symptoms. - WIKIPEDIA source: en.wikipedia.org
FOMO is something every trader must guard against. It is necessary to control emotions and not be taken advantage of by them.

GOVERNMENT BONDS YIELD. INVERTED CURVEWhat are GOVERNMENT BONDS YIELD?
Bonds are Fixed Income instruments that allow investors to anticipate the flow of funds they will receive.
What does an inverted yield curve mean?
Put simply, this means that short-term US debt is more profitable than long-term debt. Economic theory says that in a “normal” situation, long-term lending should be more profitable than short-term lending.
An inverted yield curve occurs when the yield on short-term bonds (US03MY, US06MY, US01Y) is greater than the yield on longer-term bonds (US30Y, US20Y) .
This is bad for the economy and worse if it is the United States because it means that they are relying on the economy in the short term since the "normal" thing is that long-term bonds give better yields.
Some economists and analysts see in this situation an indicator that a next economic crisis is coming, either in the form of a slowdown in GDP or even a recession.

What I’m Trying to Tell You
How Do You Know You Have The Right Idea?
Take a trip with me back in time.
(Dec 2018 - Apr 2019):
What do you expect from Bitcoin? (bullish? Bearish?)
1- if Bullish, you are on the Right side of the market.
2- if bearish, you are on the wrong side of the market ,means: you are new here!

Trading FlowchartHello, dear TradingView members.
This educational idea is a Trading Flowchart.
It starts with simply explaining the main steps to make before trading and opening positions and how to identify our situation to gain better results.
Before we start to trade, we should identify the trend. What is a trend?
A trend is a direction in which an asset's price changes over time.
Financial market traders identify market trends with the help of technical analysis. Technical analysis is a framework that identifies market trends as predictable price trends within a market (when the price reaches a support or resistance level).
Since future prices are unknown at any given time, a trend can only be determined in hindsight (vs. forward). However, this shortcoming does not stop people from predicting future trends.
The terms "bull market" and "bear market" represent increasing (rising) and decreasing (descending) market trends, respectively.
Peak and bottom:
In the price chart, the bottoms are the points where the demand pressure exceeds the supply, and the prices start to rise after a period of decline. On the contrary, the peaks are the points where the supply pressure exceeds the demand, and the prices start to decrease after an increase.
There are three types of trends in general:
Uptrend (Rising trend)
Sideways trend
Downtrend (Declining trend)
Uptrend (Rising trend):
When the price of a symbol or asset increases generally, the price trend is said to be bullish, bullish, bullish, or bearish. An increasing trend does not mean that the prices always have an upward movement; the price may sometimes go up and sometimes go down, but the result of this fluctuation is the price increase. The rising trend in the price chart can be recognized by looking at rising floors (when the new price floor is higher than the previous floor).
Sideways trend:
A lateral trend line is formed when the market remains stable, i.e., the price does not reach the highest or lowest price point. Many professional traders do not pay much attention to lateral trends. However, lateral trends play an essential role in scalping trades.
Downtrend (Declining trend):
When the price of a symbol or asset declines generally, its price trend is bearish, bearish, bearish, or bearish. A downward trend, like an upward trend, does not mean that the prices will always go down, but it means that the price may sometimes go down and sometimes go up, but the result of this fluctuation is a price reduction. A downward trend in the price chart can be recognized by looking at falling peaks (when the new price peak is lower than the previous peak).
One way an analyst can see a trend line is by plotting trend lines. A trend line is a straight line that connects two or more price points. This line continues on the chart as a support or resistance line.
An uptrend line is a straight line drawn to the right and up, connecting two or more low points. The second low point in drawing the upward trend line must be higher than the starting point. Uptrend lines support and show that even as prices rise, demand is more significant than supply. As long as prices remain above the trendline, the uptrend is considered unchanged. A break below the uptrend line indicates that a change in our trend may occur.
A downtrend line is a straight line drawn to the right and down that connects two or more high points. The height of the second point must be lower than the first point so that the line has a downward slope. Downtrend lines act as resistance and show that supply is greater than demand even as the price declines. As long as prices remain below the trendline, the downtrend is considered intact. A break above the downtrend line indicates that a change in trend may occur.
Familiarity with trend analysis
Trend line analysis is a technique used in technical analysis. Trend analysis seeks to predict the price of a currency in more distant intervals with the help of data obtained by trends. Trend analysis uses historical data like price movement and trading volume to predict long-term trends in market sentiment. Trend analysis tries to predict a trend, such as an uptrend in the market, and follow that trend until the data indicates a trend reversal.
Trend line analysis is essential because trends' movement ultimately leads to investors' profits. Examining a trend with the help of historical data of the desired currency predicts the future price of that currency for traders.
Trading strategies with trend lines
Now that we understand the meaning of trend lines and their types let's look at the strategies many traders use to identify trends and learn when it's the best time to open positions.
To try to make better predictions on how the market will behave, so we can trade safer, we can use indicators.
What are indicators?
In technical analysis, a technical indicator is a mathematical calculator based on price history, volume, or (in the case of a futures contract) options contract information related to the timing of the contracts, which aims to predict financial market trends. Technical indicators are the central part of technical analysis and are usually designed as a chart pattern to predict market trends. Indicators are generally placed on price chart data to show where the price is headed or whether the price is in an oversold or overbought state.
Many technical indicators have been developed, and new types have been invented by traders to obtain better results. New indicators are often simulated on historical price and volume data to see how effective they have been in predicting future events.
Here are a few examples of those indicators:
The Relative Strength Index (RSI):
The Relative Strength Index (RSI) is a strategy that helps identify currency price movements and buy and sell signals. RSI determines the positive and negative trend of the stock price by observing the average profit and loss in a certain period. The RSI is a percentage ranging from zero to 100 on a scale.
Here is a complete educational idea of how RSI works:
Fibonacci Retracement:
Fibonacci Retracement is a method of using the Fibonacci tool in the chart of a financial asset, which is used to determine the amount of price correction and find possible return points (support and resistance) of that asset, starting from the endpoint to the particular initial.
Here is a complete educational idea of how Fibonacci Retracement works:
There are many more indicators we can use to get a better understanding of the market. For example, The Elliot Waves, Ichimuko Clouds, MACD, and The Bollinger Bands:
I hope this flowchart gives you a better perspective on how to trade safer.
Have you ever used this flowchart accurately? What do you think the pros and cons are?
Do you think I missed something?
Let us know your ideas.
Good luck.

Sharp Correction - Sideways Correction
Sideways correction:
is the most difficult of the Elliott wave patterns to forecast (a priori).
why?
because:
1- prices reverse higher, many see as a resumption of the now long-gone bull market.
2- time-consuming!
Sideways correction = 38.2% of the previous "impulse" wave.
E.g. (Wave X = 38.2% of wave 5)
Sideways correction= Wave X.
Sharp corrections:
they are always fast and furious.
Sharp correction = either 50% of the previous wave or 61.8% of the previous wave.
E.g. (Wave 4 = 61.8% of wave 3)
Sharp corrections = Wave 4, wave W and Wave Y

Elliot Analysis on Bitcoin with Tutorial LessonsHi Traders, Hope you Doing Well.
Here we have an analytical and educational article on the future of Bitcoin and also the CryptoCurrencies Trend.
At first, let's have a closer look at BTCUSD Analysis to find what the plan in Greater View. in general, we are in a 5-wave downward trend, which is forming internal micro-waves from the fifth wave right now (on 2-5 is going to be complete to start the next aggressive wave of 3-5)
READ THIS PART TWICE:
HOW TO FIND THE TREND?
** To identify the main direction of the trends, you can easily confirm the movement scenario by observing the candles and their strength in both directions, because falling trends are formed with large candles and with strong bodies, and they cause a large fall in a limited number of candles as shown in the chart with a red circle and in contrast to the current corrective or bullish trends with the number of high candles and small candles and the return of any rise, which can easily confirm the scenario of a corrective wave as shown in the chart with an orange circle.
HOW TO FIND THE TARGETS ?
So now, we are in the middle of correction and This corrective trend can pass up to the range of 50% to 61.8% of its previous corrective wave, it should be a great chance to have a shot at this level (of course if the scenario gets approved by the price)! and this section is match with another level, which will also reach the range of the 2-4 trend line of the previous waves. This marked Fibonacci range is a golden point to confirm the continuation of the bearish trend or the reversal of an uptrend. so we have to watch it carefully.
If the downward scenario is confirmed, the next drop can go lower than the previous floor in September and June, and we will probably have a price reduction down to the price range of 13,000-14,000 dollars, considering the impact of Bitcoin on other cryptocurrencies such as ETH and MATIC which I'll post the technical analysis later today, so BTC can bring down the entire market to lower levels with its price correction movement.
But since this downward trend will be the last possible decrease in this bear market and maybe there won't be any other lower lows than this one so this downward trend can happen very quickly and even faster than what you expect from it, so it should be accompanied by the necessary reactions to purchase assets at low prices in order to hold, To benefit from the next bull run.
SO, WHERE TO BUY
So We have Put our Orders on 13,800 $ & 11,900 $ to maybe if the price gets there we can hunt our Bitcoins,
And Also about the ETH, we had set our orders on 870 $ which can be the same as the last Low for the 1st step.

Elliott Wave pattern (in simplest form)
Dear traders:
It is the result of my efforts to offer a simple presentation.
Elliott Wave pattern:
Impulse Rule s:
Wave 1:
Wave 1 must be an Impulse or a Leading Diagonal.
Wave 2:
Wave 2 may be any corrective pattern except a Triangle.
Wave 2 must retrace Wave 1 by a minimum of 20%.
The maximum time for Wave 2 is nine times Wave 1.
Wave 3
Wave 3 must be an Impulse.
Wave 3 cannot be less than 1/3 of Wave 1 by price.
Wave 3 cannot be more than 7 times Wave 1 by price.
Wave 4
Wave 4 can be any corrective pattern.
Waves 1, 2, and 4 cannot overlap except by 15% of Wave 2 with leveraged securities.
Wave 5:
Wave 5 must be an Impulse or an Ending Diagonal.
Wave 5 must move by price more than 70% of Wave 4.
Reference: www.wavemagician.com
🔥THE VOLUME PROFILE: HOW TO IDENTIFY THE BOTTOM ON BTC?Hi friends! Today i explain you the method that gives you another confirmation that the bottom of BTC is already reached. You will be well prepared for the next BTC bullrun using this method.
📊 What is volume profile?
Volume profile is the indicator that show us how many trades (volume) were made at some price. If the common volume indicator show us how many trades were made through the time, the volume profile show us how many trades were made at some price (10-12k, 58-60k etc.).
It help to identify the largest support and resistance areas, as well as liquidity gaps where the price PUMP/DUMP🔥 the most. Here is the educational idea with detailed explanation and instruction to the volume profile!
📊 How to identify the bottom of Bitcoin using Volume Profile?
This is what we need:
1. volume profile from the ATH to the bottom
2. point of control or POC
Point of control or POC is the area where the most trades were made. We marked it as the yellow line at the volume profile.
3. BTC dump for >-50%
If the price fell by 50% from the place where the most margin trades on Bitcoins were opened, it means that most marginal traders even with x1 leverage were liquidated.
🚩 Traders with x10 leverage were liquidated at a 10% drop, with x20 leverage were liquidated at a 5% drop.
✅ As you can see it was in 2015, 2018 and it`s happening now. After the 4-6 months consolidations (yellow areas) the small bullruns begin. Will it happen this time? Write your thoughts in the comments.
📊 Why are liquidations important for the growth of crypto?
This way the market becomes "healthier" and is cleared of weak hands. At this time, whales can accumulate a large position in Bitcoin or in another crypto. Liquidity at the bottom allows you to buy 10,000-20,000 Bitcoins. For example, over the past week, 60,000 Bitcoins were withdrawn from exchanges.
🏁 How to open the Volume profile?
1. Look at the left side tools in the TradingView chart
2. Choose the "Prediction and Measurment Tools"
3. Tap on "Fixed range Volume Profile"
That's it.
✅ Traders, every strategy has it's win rate. This one have the 100% win rate. If some patterns work very good for the couple of cycles, it can be changed with the times and market sentiment. So be carefully. Now the world economy has a not the best market conditions, but we get a lot of positive signals. Take a look at the Greenwhich indicator which also already confirm the bottom. Previously it help to sell BTC at 60-63k!
💻Friends, press the "boost"🚀 button, write comments and share with your friends - it will be the best THANK YOU.
P.S. Personally, I open an entry if the price shows it according to my strategy.
Always do your analysis before making a trade

Identifying the Bull (bear) Flag (In plain English)
Bull Flag Pattern (Bear Flag):
It is a continuation pattern which breaks in direction of the preceding move (they are both continuation patterns).
Follow these steps to identify the bull (or bear) flag pattern:
Step 1 (Price Action)
a. Pole: the prevailing uptrend,
b. Flag: a downward sloping consolidation.
c. breakout.
Step 2 (Volume)
As you know, it’s "wise" to always use volume.
Two distinct parts (reliable pattern):
1- high volume ; a near vertical flag pole.
2- low volume: a parallel consolidation comprised of 4 points.

🔥The LAST hope for crypto: why DXY may pump BTC soon❓Hi friends! This educational idea about the dollar index and entire crypto market will be really usefull for the beginners and the experienced traders also.
I`ll explain you several fundamental and technical reasons why and when BTC ans other crpyto will start rise. You can also use it in your trading to identify the global trend and open more succesfull trades.
As far as you may know, ✅the stronger the dollar index (DXY) the weaker all global assets and vice versa. This means that when the index rises, most stocks, cryptocurrencies fall. When the index falls the most assets grow very fast, especially such volatile ones as 🔥crypto: Bitcoin, altcoins
and 🔥shares of technology companies: Tesla, Meta, Apple, etc.
But when actually BTC and other crypto will start it's rise and you can open your best long trades❓ I explain you this in the both chapters about fundamental and technical analysis.
✅ Fundamental analysis
Now the dollar index is strengthening amid the Fed rate hike. This means that we have to wait until the trend reverses and the dollar index starts to fall. After that BTC and altcoins might start it`s new BULL MARKET.
📊 When the dollar index (DXY) starts to fall? The dollar has strengthened significantly against other currencies in the world (pound, euro etc.). This is caused by the latest rate hike to 3.25% and expectations for an increase to 4.4-4.75% by the end of 2022.
The stats for traders who want to understand how the growth of dollar index (DXY) affects other assets and currencies:
🚩The Euro is at 20 year lows.
🚩The Yen is at 24 year lows.
🚩The Pound is at 37 year lows.
📊 Do not be surprised that Bitcoin fell so much🔥, because according to the latest data, even the institutionals (big players) also scared and opened the biggest hedge positions since 2008.
🚩 It can be assumed that from the end of 2022 or early 2023 we can see a global reversal of ALL markets, including crypto depends on FEDs rate hicking end.
✅ Technical analysis
📊 14 year channel on DXY
Pay attention to point #4 on the dollar index chart. This is where the global uptrend for DXY and global downtrend for BTC began. The strongest dependence!
📊 When to open a long trade on Bitcoin❓
The end of the rate hike by the end of 2022 coincides with the technical analysis on the dollar index chart. The index is now at point #5, which is the upper boundary of the channel and the srongest resistance for the dollar index.
It is worth adding that this is not just a channel on the 5 min chart, which globally has no significance. This is a huge 14 year channel (‼️) on the weekly chart, which the price will test for the 5th time! This is a powerful signal for a reversal and resistance for the price.
🚩 The higher the timeframe, the more traders see it and, accordingly, the greater the price reaction on it. Montly>Weekly>Daily>4h>1h>...
🔥We can expect the index to fall from point #5 or at least partially consolidate at these levels before falling, as it was back in 2017 (or point #3). This can pull the price assest including BTC and altcoin to the new ATH.
📊 BTC global bottoms.
In addition, the reversal of the dollar index coincides with the formation of Bitcoin's global bottom. Bitcoin began 3/4 of its bull markets with consolidation at the bottom, which is happening now.
🚩 Of course, local manipulations with the collection of liquidity below $17,000 are very likely, but even now you can start to look for a good entry point in the trend reversal. For example, it may be the pattern of higher lows and higher highs, which is characteristic of a bullish trend.
✅ I use much more advanced trading systems to identify the best entry points and open trades either short or long, about which I write my ideas on TradingView, but this pattern will definitely help both beginner and experienced trader to earn more.
Traders, will you use this analysis in your trading❓ When exactly do you expect the global bottom on Bitcoin❓ Let's discuss it in the comments.
💻Friends, press the "boost"🚀 button, write comments and share with your friends - it will be the best THANK YOU.
P.S. Personally, I open an entry if the price shows it according to my strategy.
Always do your analysis before making a trade.

Parabolic SARHello, Let us talk about 'Parabolic SAR.'
On this chart: We will read about who developed it, how it works, and how it helps us.
Those who read the book called 'New Concepts in Technical Trading Systems' know that Parabolic SAR was developed by J. Welles Wilder Jr. and published in 1978.
Who is J. Welles Wilder?
He is the creator of several technical indicators that are currently the leading indicators in technical analysis software. These indicators include the Average True Range, the RSI, the Average Directional Index, and the Parabolic SAR.
Let us get to Parabolic SAR:
It stands for Parabolic Stop And Reverse.
In technical analysis of the stock market, Welles Wilder designed Parabolic SAR to find potential changes in the pricing of traded goods such as stocks or currency exchanges such as Forex. It is a trend-track indicator (trend or price tracker) and can be used to determine the break-even point or entry or exit points based on prices that occur during a strong trend in a parabolic curve.
In preceding research based on 17 years worth of data, the parabolic SAR showed a 95% success level.
The indicator appears as a set of points located above or below the price bars in the chart. The point below the price is considered as an uptrend. Conversely, a higher price indicates that bears are in control and likely to remain down. When the points rotate, it indicates that a potential change in price direction occurs. For example, if the points are higher than the price when they go lower, it can increase a higher price. As stock prices rise, make the points, first slowly, then rapidly, and accelerating. SAR starts to move faster as the trend progresses, and the points get priced soon.
When the position of the points moves from one side of the asset price to the other, it produces a parabolic indicator of buy or sell signals. For example, a buy signal occurs when points move from the top to below the price, while a sell signal occurs when points move from the bottom to the top of the price.
The formula of calculation:
Uptrend: PSAR = Prior PSAR + Prior AF (Prior EP - Prior PSAR)
Downtrend: PSAR = Prior PSAR - Prior AF (Prior PSAR - Prior EP)
EP: Extreme Point in a trend
AF: Acceleration Factor (with a default value of 0.02)
How accurate is it?
As we said before, the parabolic SAR showed a 95% success level.
The main advantage of this indicator is that during a strong trend, the indicator indicates that traders should maintain their position.
This indicator also shows the output when there is a move against the trend, which indicates a reverse.
The downside is that it does not provide good trading signals in the side market conditions. The indicator constantly moves up and down the price without a clear trend.
Traders should only trade in the dominant trend direction and avoid trading without a trend. Also, using other indicators such as moving average and parabolic SAR can help prevent such losses.
Suppose you are interested in using this great indicator. In that case, you can go on your TradingView chart and the dashboard, click on 'Indicators & Strategies' and search for Parabolic SAR and find the best one suited for you.
Have you ever used this indicator? What do you think the pros and cons are?
Let us know your ideas.
Good luck.

Need something to learn? ✅Hello,
Let's stop reading the charts for a while and instead learn how to read them.
There are many indicators and strategies which we can use to get better readings and understand the market better.
Under this post, please leave comments and tell us which indicators or strategies you want to know about more.
Which ones are more helpful? Which ones aren't accurate at all?
Let us know the title, and we will publish an educational idea about it.
Thank you.
