GBPUSD: Rallies Are Getting Sold, & Dollar Still Has Upper HandEvery time GBPUSD tries to lift its head, it seems to run straight into supply. Zooming out, this chart feels like a classic distribution phase after a strong first-half rally. Fundamentally, that makes sense. Sterling has lost its earlier policy edge, while the dollar continues to benefit from re

The best trades require research, then commitment.
Get started for free$0 forever, no credit card needed

Scott "Kidd" PoteetThe unlikely astronaut

Where the world does markets
Join 100 million traders and investors taking the future into their own hands.

Velocity Of Money Rolling Over Again!The Real Interpretation
This chart is telling one story:
Money supply growth has massively outpaced real output for decades.
It lines up perfectly with:
Falling real productivity
Stagnant wages
Declining borrower quality
Rising debt-to-GDP
Asset inflation decoupling from fundamentals
T

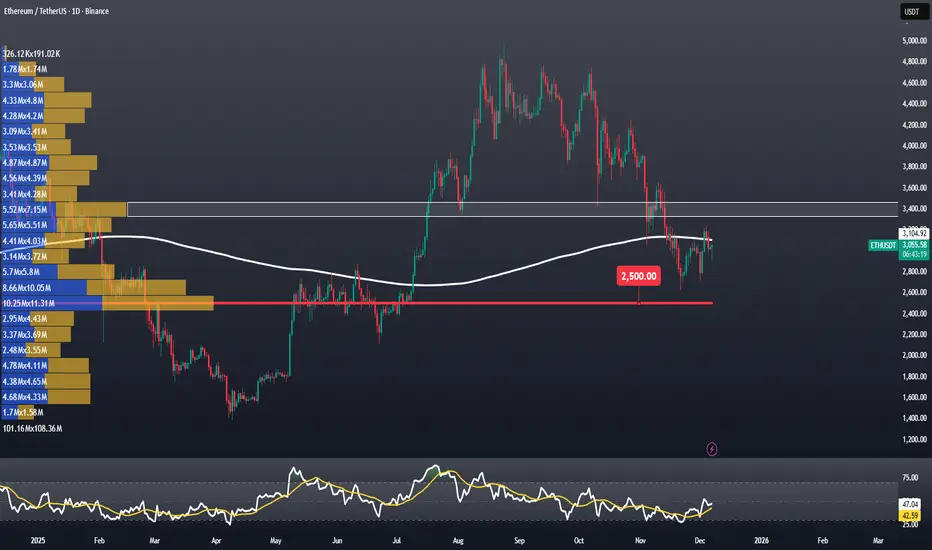
Why Does Ethereum Need a Weekly Close Above $3,100?Why Does Ethereum Need a Weekly Close Above $3,100?
Ethereum is currently trading around $3,035, while the SMA365 sits near $3,100. A weekly close above this level would give ETH investors some breathing room. If ETH can secure a close above the SMA365, we could expect a relief rally toward $3,689,
GOLD 1H CHART ROUTE MAP UPDATE & TRADING PLAN FOR THE WEEKHey Everyone,
Please see our 1h chart levels and targets for the coming week, which is still active and in play.
We are seeing price play between two weighted levels with a gap above at 4221 and a gap below at 4169, as support. We will need to see ema5 cross and lock on either weighted level to de

IBEX 35 Hits Historic LevelIBEX 35 Hits Historic Levels, Facing the Challenge of Winning Back Retail Investors
Ion Jauregui – Analyst at ActivTrades
01/12/2025
The IBEX 35 has officially returned to territory unseen since 2007. The Spanish benchmark is trading at historic highs and has established itself in 2025 as the b

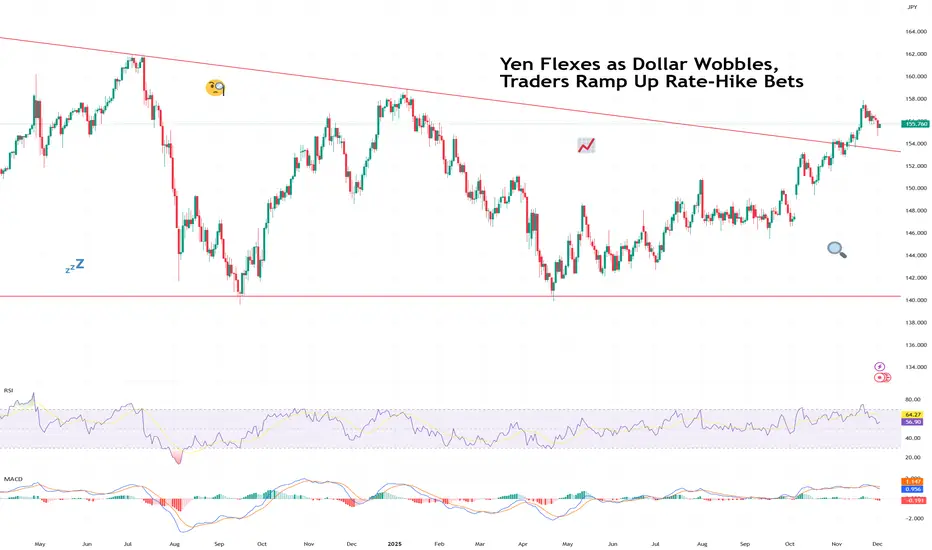
Yen Flexes as Dollar Wobbles, Traders Ramp Up Rate-Hike BetsThe yen came into Monday looking calm… and then proceeded to bench-press the dollar.
The FX:USDJPY pair slid under ¥155, hitting a session low of ¥154.65, after BoJ Governor Kazuo Ueda dropped one of the most powerful phrases in global FX:
“We will weigh the pros and cons of tightening.”
In Tok
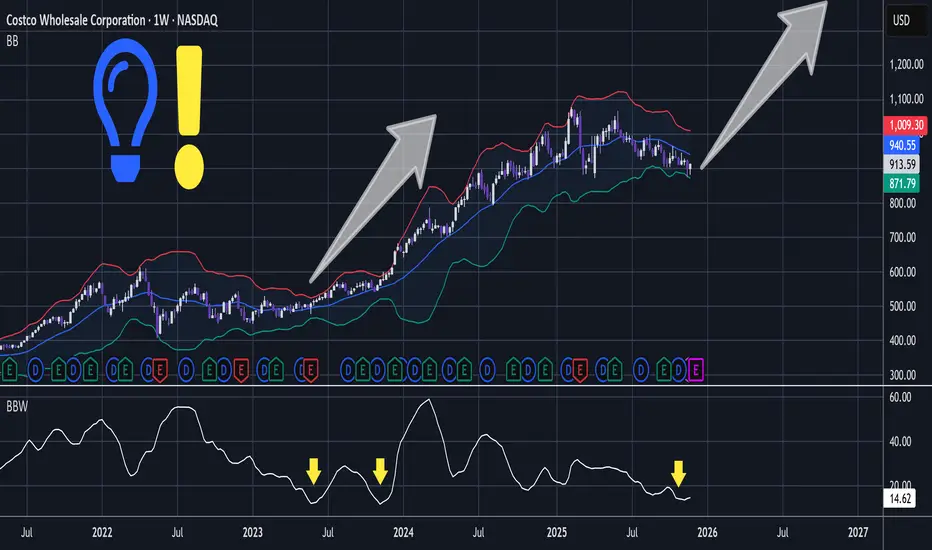
COST - Retail Powerhouse In Ideal HTF PositionShallow compressive action has printed contracting Bollinger Bands.
Notice that the BBW - Bollinger Band Width is similar to the previous correction before breakout.
In lower time frame the significantly sized slump has whipsawed through support and wedge trendline to become a bullish engulf:
T
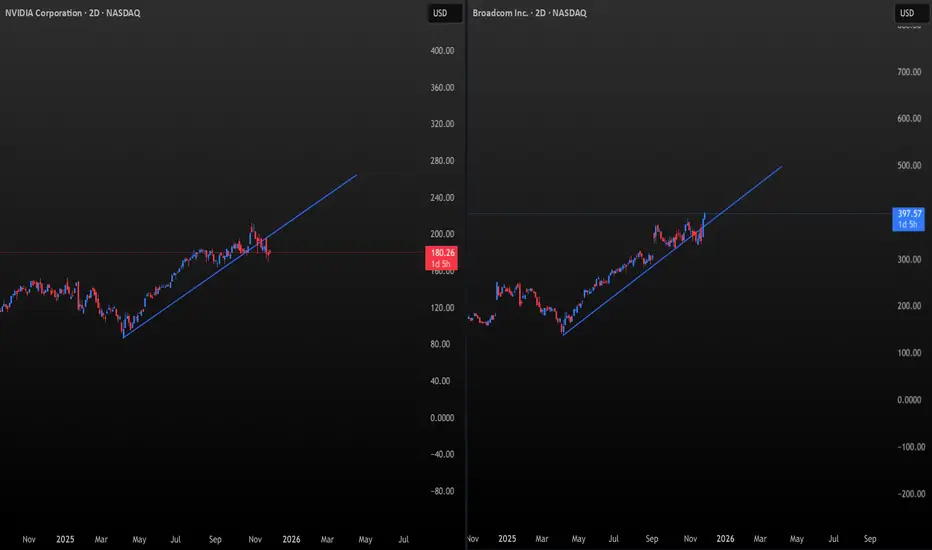
NVDA vs AVGO: The Battle for the AI Throne Has Begun⚡A New Leader Emerges in the Semiconductors
For years, NVDA was the undisputed titan — the gravitational center of the semiconductor universe.
But now, the geometry tells a different story.
THE CHARTS 📐
Both charts use the same natural scaling:
1° of time = $1 of price per unit.
And here’s the
SPX to Money Supply WARNING!If the charts aren’t showing bubble setups, I’m not going to invent them. I post what the data shows. So please don’t shoot the messenger when I say GTFO & STFO.
And just to keep the facts straight:
Brokerage, stock, and crypto accounts are not part of M2.
Why does M2 matter?
It’s the actual spe

Stocks Stage Comeback in Time for Thanksgiving. What's Behind ItIt’s Thanksgiving, and you know what that means. “Hey, sweety, why don't you come here and let us know how your high-beta stocks are doing. Here’s our little investor.”
And for once, the answer isn’t followed by a sigh. Stock traders are heading into the holiday with something they haven’t had in

See all editors' picks ideas
Match Finder [theUltimator5]Match Finder is the dating app of indicators. It takes your current ticker and finds the most compatible match over a recent time period. The match may not be Mr. right, but it is Mr. right now. It doesn't forecast future connection, but it tells you current compatibility for today.
Jokes aside,

Trend Line Methods (TLM)Trend Line Methods (TLM)
Overview
Trend Line Methods (TLM) is a visual study designed to help traders explore trend structure using two complementary, auto-drawn trend channels. The script focuses on how price interacts with rising or falling boundaries over time. It does not generate trade sign

Breakouts & Pullbacks [Trendoscope®]🎲 Breakouts & Pullbacks - All-Time High Breakout Analyzer
Probability-Based Post-Breakout Behavior Statistics | Real-Time Pullback & Runup Tracker
A professional-grade Pine Script v6 indicator designed specifically for analyzing the historical and real-time behavior of price after strong All-Ti

Count█ OVERVIEW
A library of functions for counting the number of times (frequency) that elements occur in an array or matrix.
█ USAGE
Import the Count library.
import joebaus/count/1 as c
Create an array or matrix that is a `float`, `int`, `string`, or `bool` type to count elements from, t

Holographic Market Microstructure | AlphaNattHolographic Market Microstructure | AlphaNatt
A multidimensional, holographically-rendered framework designed to expose the invisible forces shaping every candle — liquidity voids, smart money footprints, order flow imbalances, and structural evolution — in real time.
---
📘 Overview
The Hol

PriceFormatLibrary for automatically converting price values to formatted strings
matching the same format that TradingView uses to display open/high/low/close prices on the chart.
█ OVERVIEW
This library is intended for Pine Coders who are authors of scripts that display numbers onto a user's charts. T

LogNormalLibrary "LogNormal"
A collection of functions used to model skewed distributions as log-normal.
Prices are commonly modeled using log-normal distributions (ie. Black-Scholes) because they exhibit multiplicative changes with long tails; skewed exponential growth and high variance. This approach i

Range Oscillator (Zeiierman)█ Overview
Range Oscillator (Zeiierman) is a dynamic market oscillator designed to visualize how far the price is trading relative to its equilibrium range. Instead of relying on traditional overbought/oversold thresholds, it uses adaptive range detection and heatmap coloring to reveal where pri

Volume Surprise [LuxAlgo]The Volume Surprise tool displays the trading volume alongside the expected volume at that time, allowing users to spot unexpected trading activity on the chart easily.
The tool includes an extrapolation of the estimated volume for future periods, allowing forecasting future trading activity.
🔶 U

Smooth Theil-SenI wanted to build a Theil-Sen estimator that could run on more than one bar and produce smoother output than the standard implementation. Theil-Sen regression is a non-parametric method that calculates the median slope between all pairs of points in your dataset, which makes it extremely robust to o

See all indicators and strategies
Community trends
I don't own enough!I don't own enough of NYSE:ZETA even with my massive 15-20% holding across my investment portfolios and leaps galore.
The fundamentals scream buy anything under $25-$30, while the stock sits at sub-$20.
P/S less than 3, DCF model spitting out massive Margin of Safety based on conservative projec


$LEU pullback to A-VWAPCentrus Energy has pulled back to the tariff low anchored VWAP after a huge run up. Price has already started to see a rebound after posting a weekly doji candle at this area while also tagging its previous high.
The AI energy narrative has been strong as people continue to realize the true bottlen

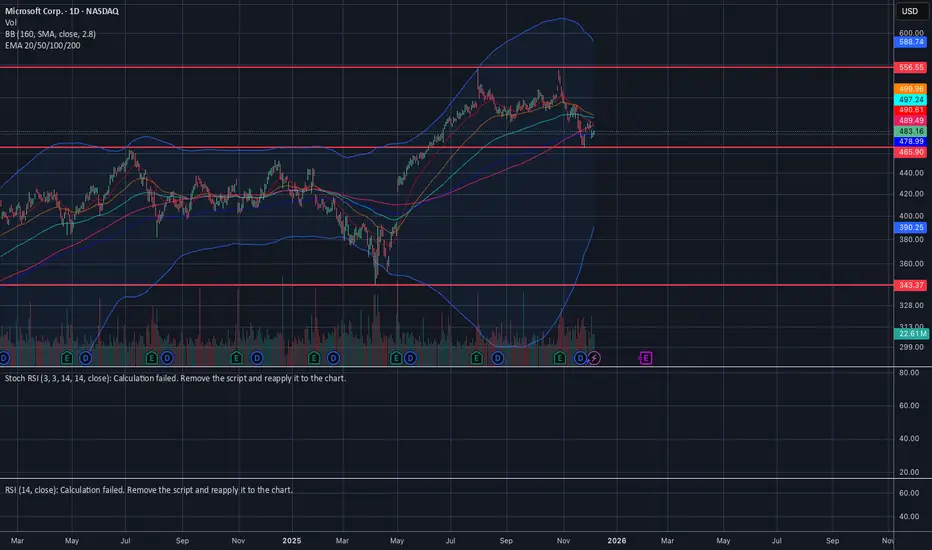
$MSFT establishing HTF support at 200 day MATagged 200 day MA and bounced. Slight retest already happened. If the daily doesn't form a bear flag then it could easily target the gap at 495.
Options flow supports exactly that with call flow for the next two weeks expirations targeting 495 and 500
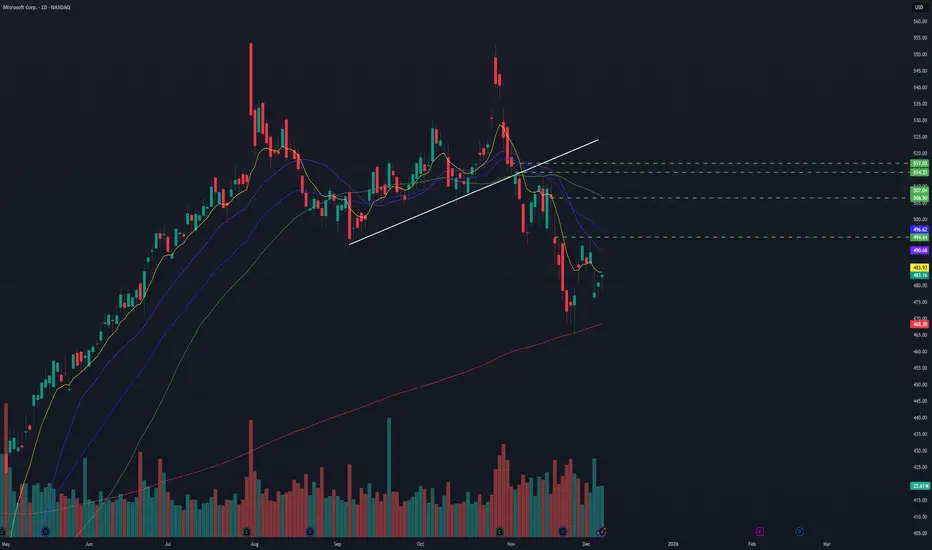
$MSFT Horizontal consolidation If the current context remain, I would see NASDAQ:MSFT doing horizontal consolidation between range $467-$556
AMZN : What’s Taking Shape?Amazon’s recent recovery has developed into an interesting emerging structure. After the sharp drop and strong rebound, price is now building a potential continuation pattern. Momentum suggests the market may still be preparing for another upward leg once this consolidation phase completes. With the

A 76% Probability Structure Hidden in AEEA 76% Probability Structure Hidden in NYSE:AEE
🌪️ THE MARKET HAS A STRUCTURE. IT'S CALLED A CHART PATTERN.
Traders fail because they trade the Noise. They buy on hope, sell on panic, and stare at candles lost in the chaos.
Our mission is to reveal the structure. We analyze thousands of ch

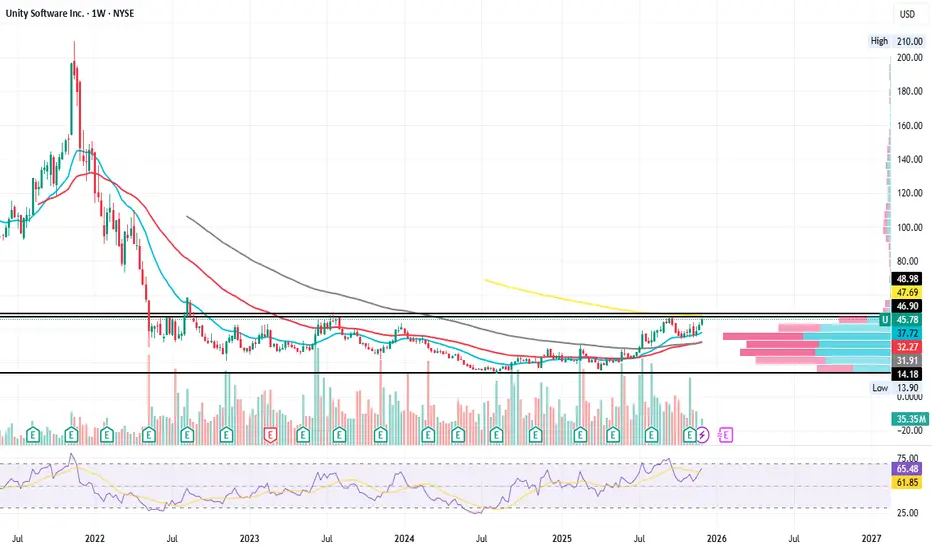
$U (Unity) from Accumulation to the Moon$U (Unity) has entered an accumulation channel and is now testing the channel's highs. The 200dEMA is a resistance, which, once broken, will allow prices to emerge and head towards new highs. I am obviously LONG.
American Airlines (NASDAQ: $AAL) Tracks Spirit Bankruptcy MovesAmerican Airlines Group Inc. (NASDAQ: AAL) traded at $14.81 on December 5, gaining 3.35% as the airline enters the latest stage of Spirit Airlines’ ongoing bankruptcy. A new court filing shows American Airlines has formally submitted a notice of appearance in the Spirit Aviation bankruptcy case, req

NVDA – TA for Dec 8–12Compression Under Resistance, Demand Below (Full TA + GEX Insight)
NVDA is entering the week sitting right beneath an important resistance band while holding onto a broader ascending structure. The stock is consolidating after a strong run, and the market is now deciding whether this pause leads to

See all stocks ideas
Today
HOFTHooker Furnishings Corporation
Actual
—
Estimate
−0.14
USD
Today
USAUU.S. Gold Corp.
Actual
—
Estimate
−0.13
USD
Today
BNEDBarnes & Noble Education, Inc
Actual
—
Estimate
—
Today
YEXTYext, Inc.
Actual
—
Estimate
0.13
USD
Today
NTRBNutriband Inc.
Actual
—
Estimate
−2.13
USD
Today
TBHCThe Brand House Collective, Inc
Actual
—
Estimate
−0.42
USD
Today
PLCEChildren's Place, Inc. (The)
Actual
—
Estimate
0.70
USD
Today
FIZZNational Beverage Corp.
Actual
—
Estimate
0.51
USD
See more events
Today
HWEPHW ELECTRO Co. Ltd.
Exchange
NASDAQ
Offer price
—
Tomorrow
J
JMGJM Group Ltd.
Exchange
AMEX
Offer price
4.00 - 5.00
USD
Dec 10
CDNLCardinal Infrastructure Group Inc.
Exchange
NASDAQ
Offer price
20.00 - 22.00
USD
Dec 11
LMRILumexa Imaging Holdings Inc.
Exchange
NASDAQ
Offer price
17.00 - 25.00
USD
Dec 12
S
SFDXSFIDA X Inc.
Exchange
NASDAQ
Offer price
5.00 - 6.00
USD
Dec 12
W
WLTHWealthfront Corp.
Exchange
NASDAQ
Offer price
12.00 - 14.00
USD
Dec 15
ELCGELC Group Holdings Ltd.
Exchange
NASDAQ
Offer price
4.00 - 6.00
USD
Dec 15
DTDTDt House Ltd.
Exchange
NASDAQ
Offer price
4.00 - 5.00
USD
See more events
Community trends
Ethereum Hits Demand Zone – Smart Money Reaction Begins1. Major Breakdown Completed
ETH formed a sharp sell-off leg, moving along the long diagonal trendline you drew.
This indicates strong downside momentum that has now reached exhaustion near the bottom zone.
2. Price Tapped a Key Demand Zone
The lower green/grey area marks a high-volume demand blo

Bitcoin Roadmap | Short-termBitcoin( BINANCE:BTCUSDT ) began to decline from the resistance zone($95,020-$94,840) exactly as expected in my previous idea , successfully reaching all targets.
At the moment, Bitcoin was able to break the support zone($90,650-$90,000). It seems that the pullback to the broken support zone($90,6

BTCUSDT: Failed Recovery Opens Path to 87,000 SupportHello everyone, here is my breakdown of the current BTCUSDT setup.
Market Analysis
BTCUSDT is trading inside a broader ascending channel, but the recent price action shows clear signs of weakness near the upper structure. Price previously attempted a breakout above the 90,000 Resistance Zone, how

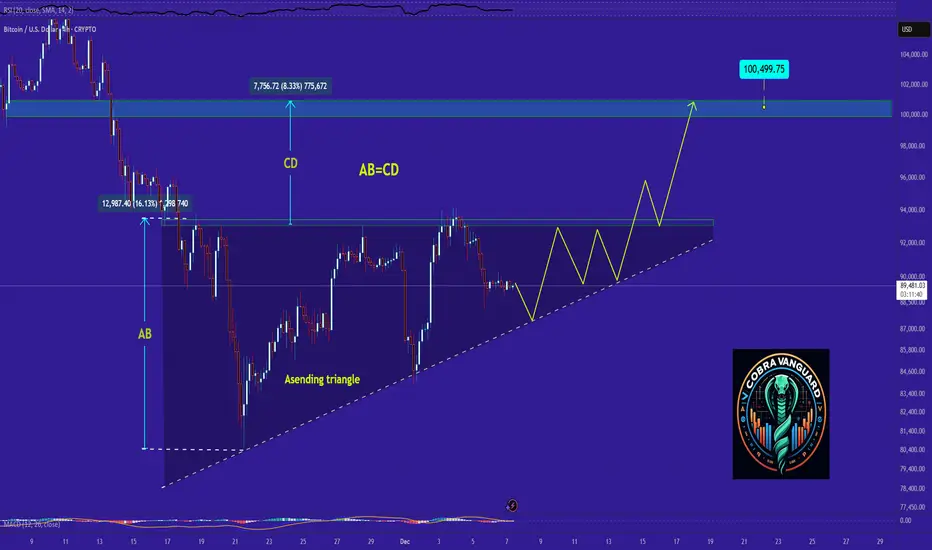
I think the only one Liking my post is me!The price on the 4h timeframe is within an ascending triangle, which can be promising. If the price breaks this pattern with bullish candles, it could easily rise by the distance of AB=CD.
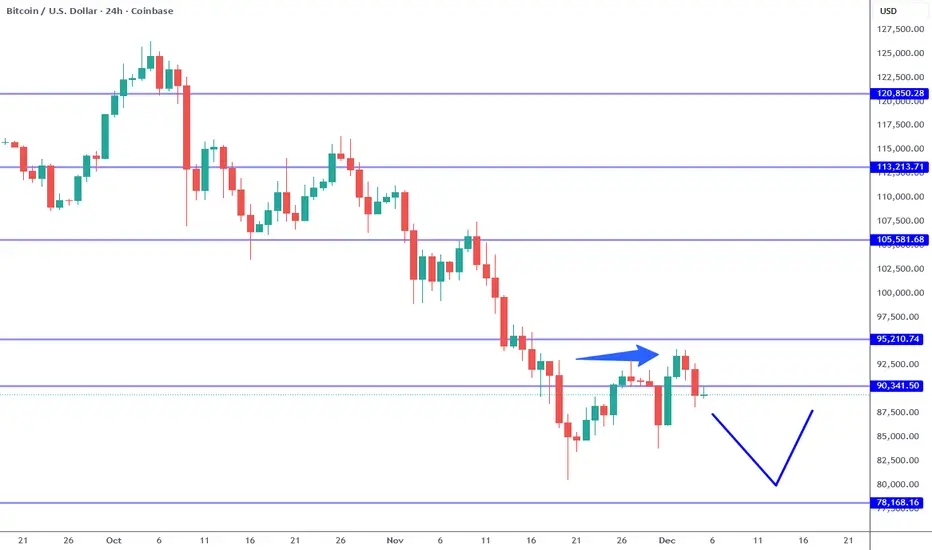
Bitcoin Setting Up For New Low.Bitcoin short term trend is STILL bearish. The 95K resistance defines the structure which implies a lower low is likely to follow in the near future. There is also a failed high off the 93,500 area which suggests further weakness as well (see arrow). IF the 88K area breaks again (trend line break),
LTC can break the descending channel 33% gain toward 110$ Hi,
The support and resistances on the chart are based on the previous data and weekly candlesticks,
BINANCE:LTCUSDT nis in the descending channel now and close to the resistance side if it holds this position and these last support the potential of 33% gain is logical toward 110$.
and breakout o

ADAUSDT → Correction (hunt for liquidity) before the fall BINANCE:ADAUSDT is pausing in the 0.41 area and entering a correction phase, during which it may test the zone of interest in a bearish market.
Bitcoin failed to overcome resistance at 92K, with economic data intensifying bearish pressure, resulting in another decline. The market is stagnant w

BUY OPPORTUNITY IN BTCThis could be a perfect entry if the price respects the support line that match the level of fib offering a good R: R

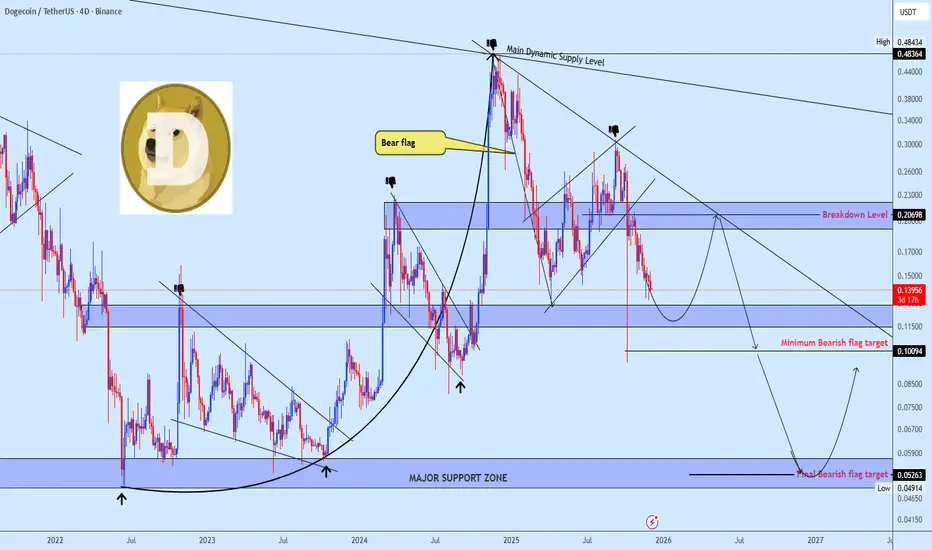
Relief Rally Expected Before Next Leg Down on DOGEUSDTDOGEUSDT has initiated a clean corrective structure following the creation of a bearish flag. The breakdown from the flag triggered a strong downward leg, confirming the shift in momentum and validating the continuation pattern. At the moment, the market is trading below the breakout zone, and furth
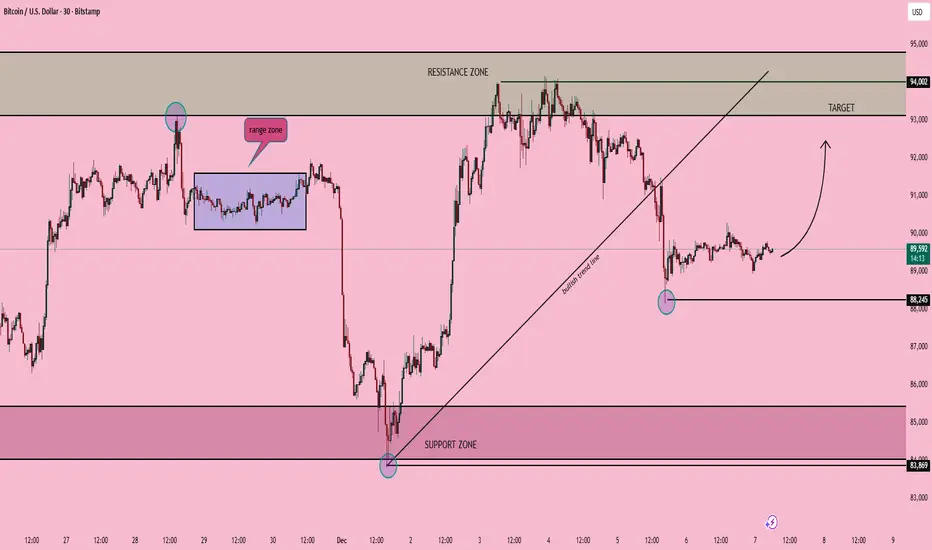
BTC/USD – Support Retest & Possible Recovery PathBITSTAMP:BTCUSD
If Bitcoin maintains support above 88,245, bullish recovery toward the previous 93,500–94,000 resistance zone becomes probable. This zone remains the main area where sellers previously controlled price, so a breakout confirmation is required for further continuation.
A breakdown be
See all crypto ideas
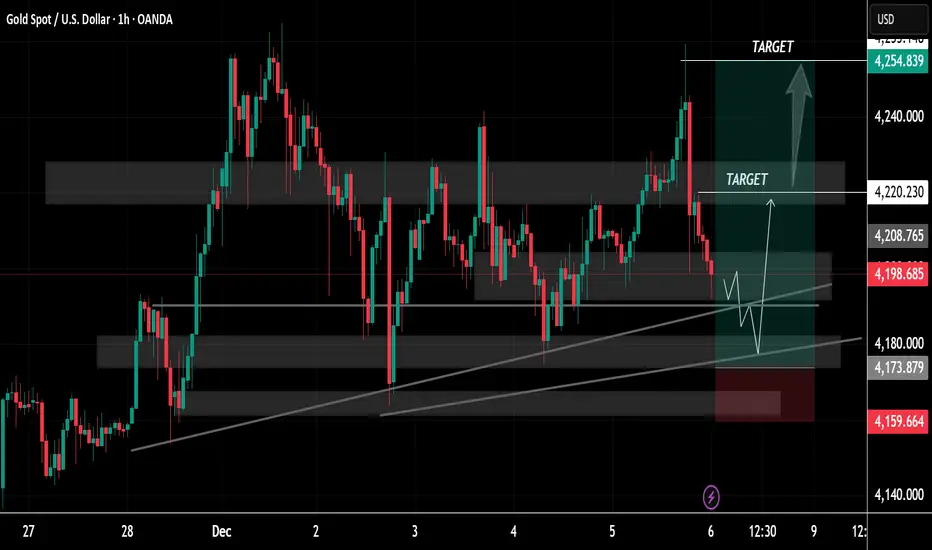
GOLD 1H CHART ROUTE MAP UPDATE & TRADING PLAN FOR THE WEEKHey Everyone,
Please see our 1h chart levels and targets for the coming week, which is still active and in play.
We are seeing price play between two weighted levels with a gap above at 4221 and a gap below at 4169, as support. We will need to see ema5 cross and lock on either weighted level to de
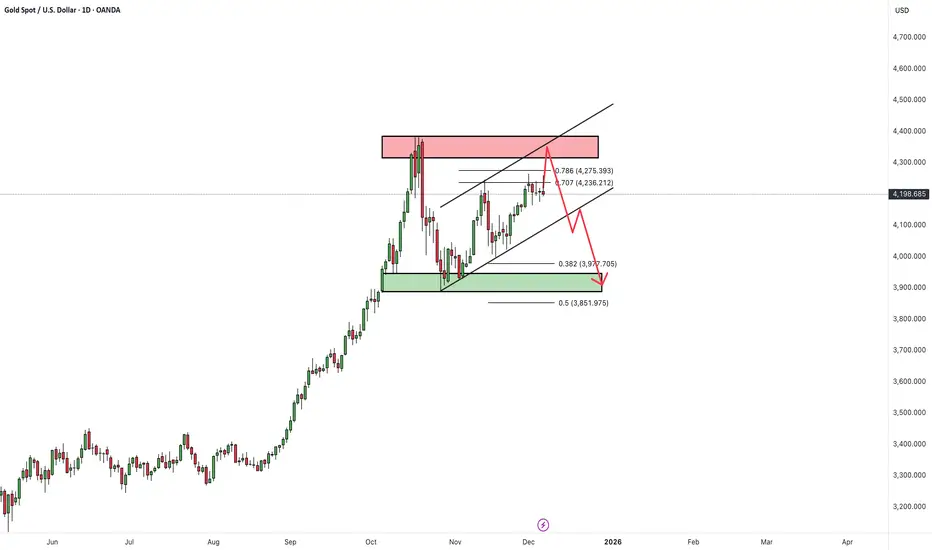
XAUUSDHello Traders! 👋
What are your thoughts on GOLD?
Gold continues to trade within a short-term ascending channel and is now approaching the upper boundary, which aligns with a major resistance zone formed by the previous swing high. This creates a strong confluence area where sellers may become acti
XAUUSD Bullish Trend in Play — Path Open Toward 4,300 TargetHello traders! Here’s my technical outlook on XAU/USD (Gold) based on the current market structure. Gold remains in a broader bullish trend, supported by a clearly defined rising Trend Line that has guided price action since the beginning of the impulsive move. After the initial breakout from the Su

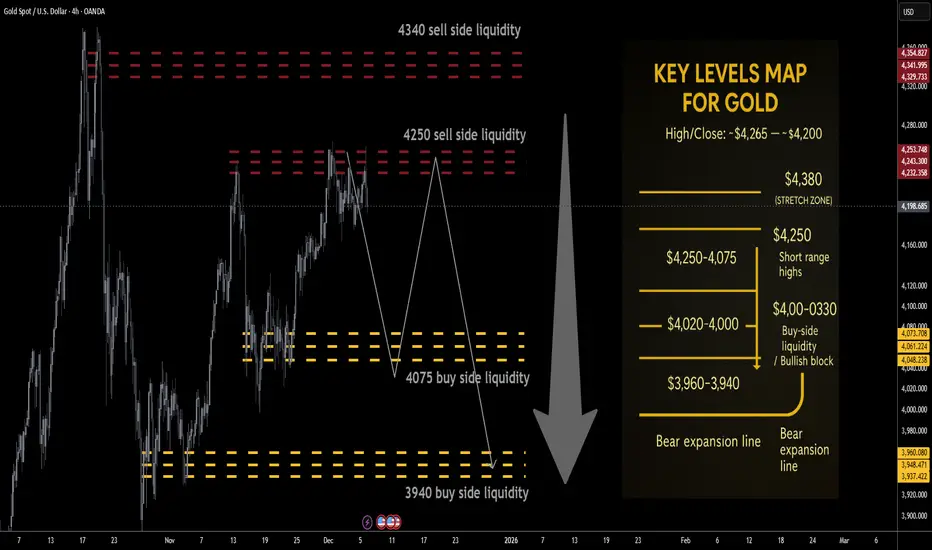
Gold next week Key S/R Levels and Outlook for Traders🔥 GOLD WEEKLY SNAPSHOT — BY PROJECTSYNDICATE
🏆 Swing High / Swing Low
$4,265 → ~$4,164 — clean rejection from the 4,26x breakout zone with a long upper wick, but weekly close still near $4,200, keeping price pinned in the upper part of the broader $4k range.
📈 Trend
Higher-timeframe: Structur
Elite | XAUUSD (30m) – Liquidity Play Within Trend StructureOANDA:XAUUSD
Price continues to respect bullish structure while ranging between sell-side liquidity below and buy-side liquidity above. Currently trading near trend support, approaching an institutional buy zone (4,170-4,182) where strong displacement has reacted previously.
If price sweeps sell-

Selena | XAUUSD 30m –Fresh Demand Inside Channel Monday OutlookPEPPERSTONE:XAUUSD
The left-hand range zone provided accumulation before price broke out and built this bullish structure. Each major dip into the rising trendline has produced strong upside continuations. The latest move created a new swing high and then a controlled, corrective decline inside a

Gold Price Update – Clean & Clear Explanation✅ Gold where the market has been moving inside repeated zones of support and resistance. You can clearly see that price has been bouncing between these grey areas, which act like barriers that stop the market from moving too far in one direction without a reaction.
🤙At the right side of the chart,
THE KOG REPORTTHE KOG REPORT:
In last week’s KOG Report we said we would look for the price to tap into the lower level where we wanted a bounce to then target the red box above. We managed to get that long into the defence level for it to give us a nice tap and bounce again giving the short and following the

XAUUSD (Gold) Next Buying Move Analysis Quick Analysis (XAUUSD / Gold)
Price recently pulled back into a marked support zone (the blue highlighted area).
The chart suggests bullish continuation, with two possible upward paths drawn.
As long as price stays above the support zone, the idea points toward a move up toward the marked targe

Lingrid | GOLD Weekly Analysis: Calm Before the Fed-Driven StormOANDA:XAUUSD price action this week has been a masterclass in consolidation, trading in a tight, choppy range just around $4,200 technical level. This sideways movement is not a sign of weakness but rather a necessary pause after the recent parabolic rally, allowing traders to digest gains and buil

See all futures ideas
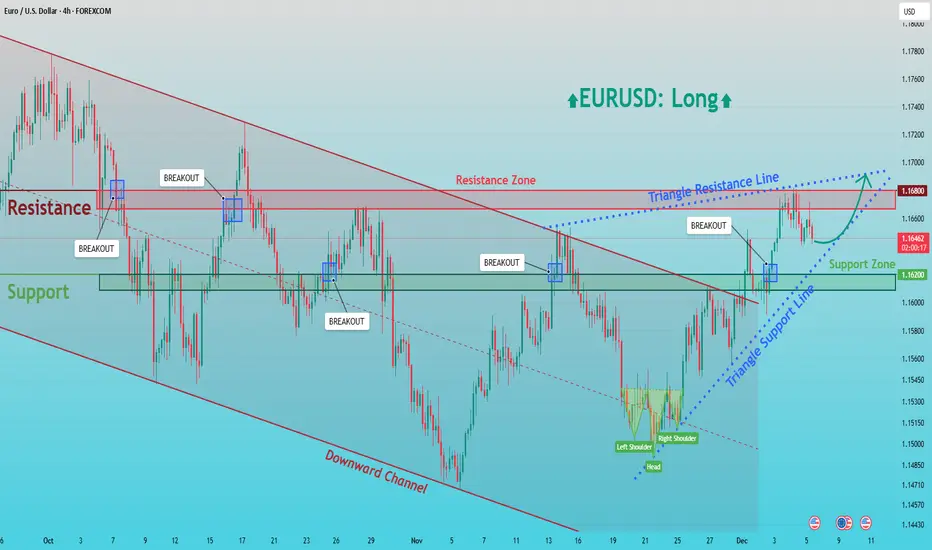
EURUSD: Buyers Push Toward the 1.1680 Triangle Resistance BreakHello everyone, here is my breakdown of the current EURUSD setup.
Market Analysis
EURUSD is transitioning out of a prolonged bearish phase that previously unfolded inside a well-defined downward channel. After forming a major swing low in early November, the pair initiated a recovery and graduall
EURCHF Targets 0.9435 and 0.9550 After Bullish ReversalEURCHF Targets 0.9435 and 0.9550 After Bullish Reversal
EURCHF has finally broken out of the falling channel that has been developing for months, signaling a potential shift in momentum.
After finding strong support at the lower boundary, buyers stepped in aggressively, pushing the price toward

USD/JPY - Interest Rate Ahead! (08.12.2025) 📝 Description FX:USDJPY
USD/JPY continues to respect the Bearish Channel Pattern, with price rejecting the upper boundary and failing to break the resistance zone. Combined with strong fundamentals—expected Fed rate cut and potential BoJ tightening—the setup favors downside movement.
A break and

EURUSD: Quasimodo Formation Signals Downside ContinuationHi!
EURUSD recently completed a clear Quasimodo (QM) reversal structure within the 1.1670–1.1680 supply zone. After forming the higher high and then breaking the previous higher low, bearish intent became evident. Price reacted strongly from the QML area, confirming the validity of the pattern.
Fo

AUDUSD POTENTIAL SHORT OPPORTUNITYHello Everyone!
How are you all?
AudUsd is a pair to watch this week, because it is shaping up very nicely for a bearish trend continuation that we can capitalize on.
So, I will be looking for a sell continuation because of the following reasons:
1. The H4 structure is bearish.
2. The price ha

EURUSD: Buying the Dip on Central Bank Divergence⚡ Macro Thesis: Monetary Divergence underway.
Fed (Dovish): Market convinced of a rate cut in December.
ECB (Neutral/Hawkish): Lagarde signals there is no rush to cut further given that service inflation remains sticky. This narrowing of the interest rate spread favors the euro against the dollar

EURUSD Short: Supply Holds — Pullback to 1.1610 in FocusHello, traders! The price action on EURUSD is unfolding within a well-defined technical structure shaped by an ascending Trend Line, with the market transitioning from consolidation into a corrective pullback. After a prolonged bullish advance, the pair formed a Head and Shoulders pattern near the u

USD/JPY) Bearish trend analysis Read The captionSMC Trading point update
Technical analysis of USD/JPY – 1H SMC Outlook
1. Market Context – Bearish Framework
Price is trading inside a descending channel, creating:
Lower highs
Lower lows
This indicates a macro bearish trend and a high probability that rallies into premium areas will be so

EURUSD I Monthly CLS - Model 2 Continuation Hi friends, new range created. As always we are looking for the manipulation in to the key level around the range. Don't forget confirmation switch from manipulation phase to the distribution phase to make the setup valid. Stay patient and enter only after change in order flow. If price reaches 50%

EURUSD Uptrend Structure Intact — Path Toward 1.1700 ResistanceHello traders! I want to share my view on the current EURUSD setup. After a corrective decline, the pair formed a solid local bottom around the Support Level near 1.16200–1.16400, where buyers stepped in and stopped the downward momentum. As shown on the chart, price is now trading inside a clear as

See all forex ideas
| - | - | - | - | - | - | - | ||
| - | - | - | - | - | - | - | ||
| - | - | - | - | - | - | - | ||
| - | - | - | - | - | - | - | ||
| - | - | - | - | - | - | - | ||
| - | - | - | - | - | - | - | ||
| - | - | - | - | - | - | - | ||
| - | - | - | - | - | - | - |
Trade directly on the supercharts through our supported, fully-verified and user-reviewed brokers.


