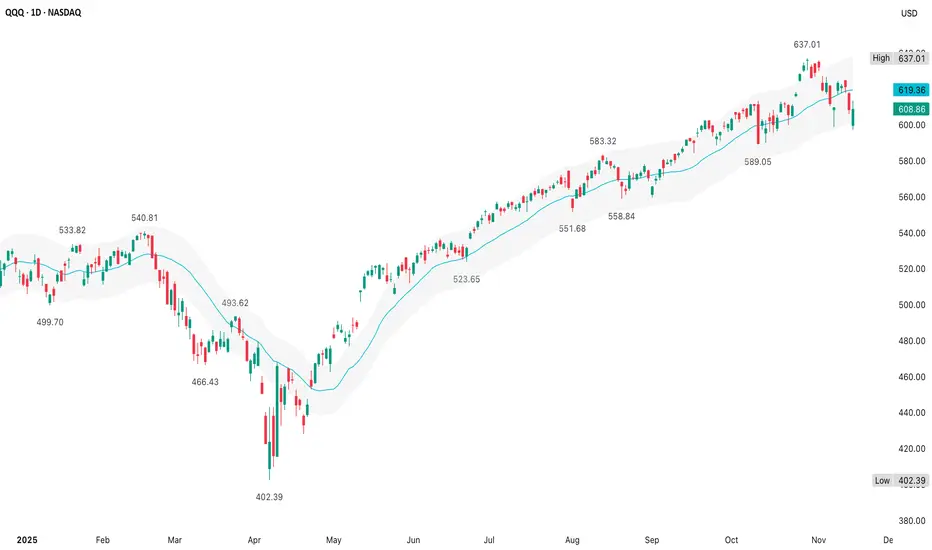
QQQ (14 November)The +/- 3% envelope with the 20d MA works well for mean-reversion strategies since it clearly shows inflection points where price may snap back toward the average
How far is price from its 20d MA & is price near extremes of the 3% bands?
Bollinger Bands adjust dynamically with volatility
Price

The best trades require research, then commitment.
Get started for free$0 forever, no credit card needed

Scott "Kidd" PoteetThe unlikely astronaut

Where the world does markets
Join 100 million traders and investors taking the future into their own hands.
Technical analysis of bitcoin key levels and wedge chart pattern1. Trend Structure
The descending trendline (Resistance line) at the top of the chart remains valid.
The price has repeatedly faced rejection at this level, indicating that the medium-term downtrend is still intact.
2. Key Price Levels and Indicators
50-week EMA
The price has recently

Bitcoin FOMOThe technical levels I am watching in the near term are:
Upside Resistance:
104800
117,500
All Time High
Downside Support
87,700
84,100
Throughout this bull cycle, starting from the low in November 2022, following the January 2023 Ichimoku breakout that truly triggered the bull tre

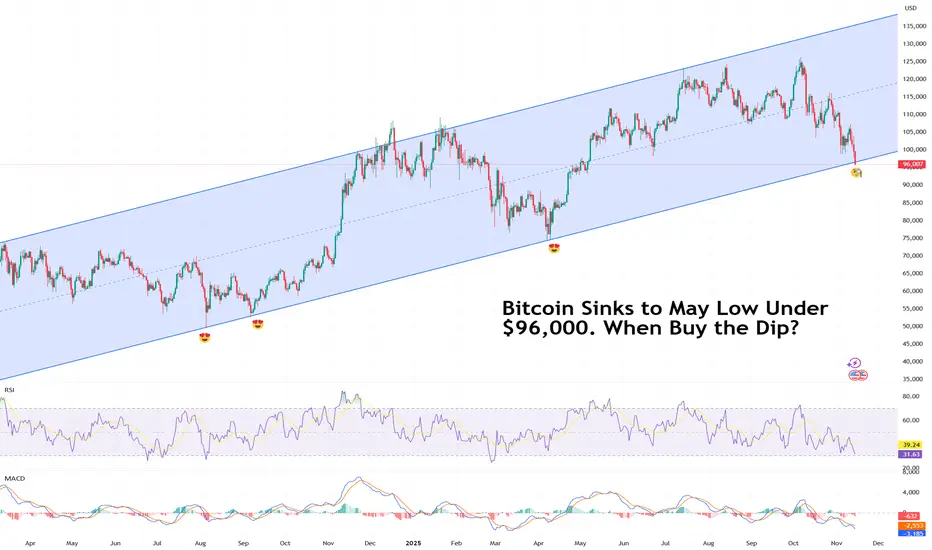
Bitcoin Sinks to May Low Under $96,000. When Buy the Dip?Because sometimes the dip just keeps on dipping.
Bitcoin BITSTAMP:BTCUSD can’t seem to catch a break. The flagship crypto slid below $96,000 on Friday, a level last seen in May, and traders aren’t exactly rushing to buy the dip.
The decline caps a tough few weeks for the OG coin, now lower by
When Arctic Storm Meets Government ShutdownNYMEX: Micro Henry Hub Natural Gas Futures ( NYMEX:MNG1! )
A “Perfect Storm” is brewing by weather catastrophe and man-made events.
On Thursday, November 6th, forecaster Atmospheric G2 said that it predicted colder than normal weather over the Eastern US for November 11-15. Driven by the expectati

ASTS 4H: space internet or orbital dream?AST SpaceMobile (ASTS) is consolidating above the $61–69 zone, right near the 0.618 Fibonacci level of its last major rally. On the 4H chart, momentum shows early reversal signs: falling volume on pullbacks, stochastic turning up, and buyers defending local lows. The bullish setup holds as long as p

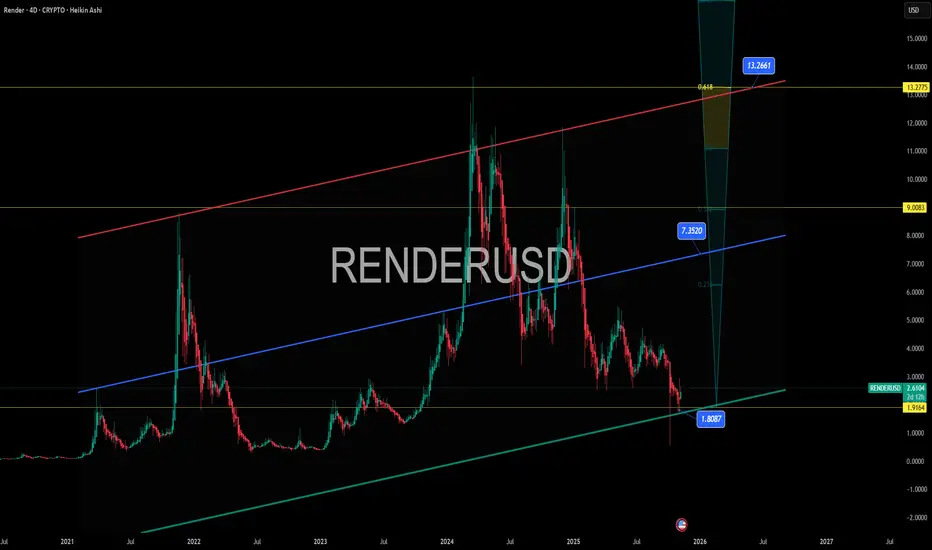
RENDER – Nvidia’s Favorite GPU Coin Testing Demand Zone RENDER – Nvidia’s Favorite GPU Coin Testing Demand Zone 🔍🎯
Render just kissed the $1.91–$2.00 demand zone — the base of the macro channel and a textbook long-term retest level.
This is not just any altcoin. Render powers the Las Vegas Virtual Dome and is the only crypto Nvidia has ever name-drop
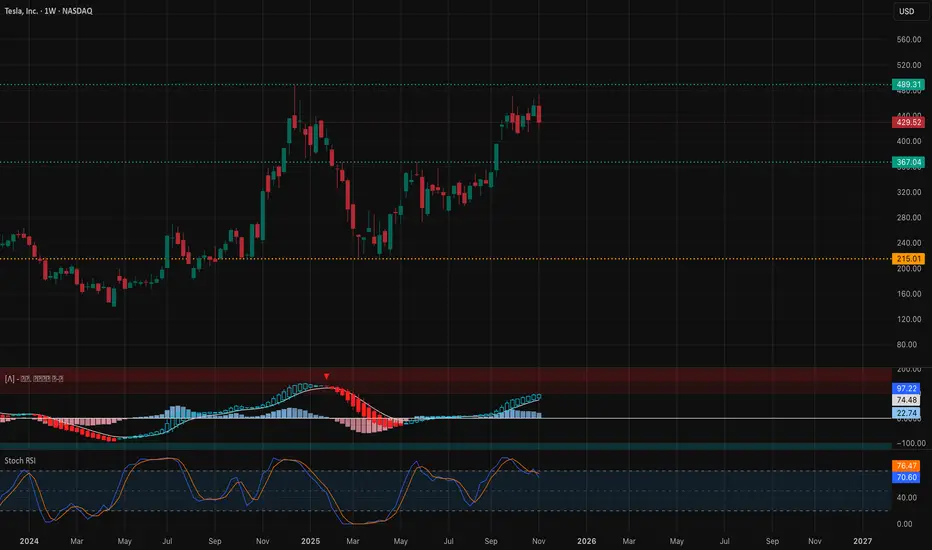
TSLA Setting Up for a Big Move This Week (Nov 10–14)Here’s the full multi-timeframe outlook for TSLA based on SMC structure, channels, BOS/CHoCH shifts, momentum, and the GEX map. Each section is separated so you can attach the matching chart under it.
1. Weekly Timeframe (1W)
Macro Structure
TSLA is still holding its bigger weekly breakout after cl
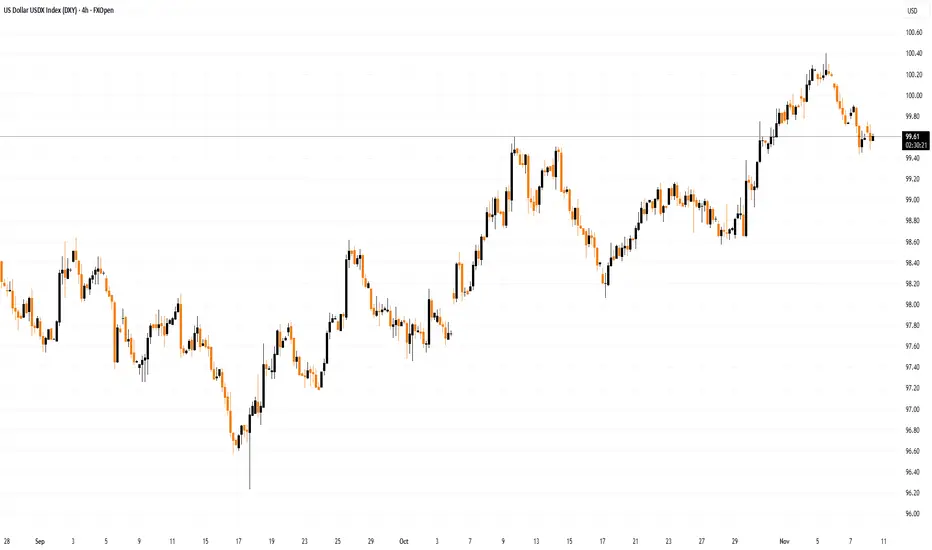
Dollar Index Pulls Back from a Key HighDollar Index Pulls Back from a Key High
As the Dollar Index (DXY) chart shows, the index is currently trading below its 5 November high, which formed after a false bullish breakout (marked by an arrow) above the 1 August peak — a scenario previously outlined in the post “The Dollar Index Near a Ke
US 500 - Has All the Good News Been Priced?After a volatile and nervy 5 days for US stock indices the week ended on a slightly more stable and positive footing.
In relation to the US 500 index this volatility saw it open on Monday November 3rd around 6885, trade down to a low of 6633 early on Friday November 7th, before rallying by over

See all editors' picks ideas
PriceFormatLibrary for automatically converting price values to formatted strings
matching the same format that TradingView uses to display open/high/low/close prices on the chart.
█ OVERVIEW
This library is intended for Pine Coders who are authors of scripts that display numbers onto a user's charts. T

LogNormalLibrary "LogNormal"
A collection of functions used to model skewed distributions as log-normal.
Prices are commonly modeled using log-normal distributions (ie. Black-Scholes) because they exhibit multiplicative changes with long tails; skewed exponential growth and high variance. This approach i

Range Oscillator (Zeiierman)█ Overview
Range Oscillator (Zeiierman) is a dynamic market oscillator designed to visualize how far the price is trading relative to its equilibrium range. Instead of relying on traditional overbought/oversold thresholds, it uses adaptive range detection and heatmap coloring to reveal where pri

Volume Surprise [LuxAlgo]The Volume Surprise tool displays the trading volume alongside the expected volume at that time, allowing users to spot unexpected trading activity on the chart easily.
The tool includes an extrapolation of the estimated volume for future periods, allowing forecasting future trading activity.
🔶 U

Smooth Theil-SenI wanted to build a Theil-Sen estimator that could run on more than one bar and produce smoother output than the standard implementation. Theil-Sen regression is a non-parametric method that calculates the median slope between all pairs of points in your dataset, which makes it extremely robust to o

Fair Value Gaps by DGTFair Value Gaps
A refined, multi-timeframe Fair Value Gap (FVG) detection tool that brings institutional imbalance zones to life directly on your chart.
Designed for precision, it visualizes how price delivers into inefficiencies across chart, higher, and lower (intrabar) timeframes — offering a fl

TASC 2025.11 The Points and Line Chart█ OVERVIEW
This script implements the Points and Line Chart described by Mohamed Ashraf Mahfouz and Mohamed Meregy in the November 2025 edition of the TASC Traders' Tips , "Efficient Display of Irregular Time Series”. This novel chart type interprets regular time series chart data to create an ir

Simplified Percentile ClusteringSimplified Percentile Clustering (SPC) is a clustering system for trend regime analysis.
Instead of relying on heavy iterative algorithms such as k-means, SPC takes a deterministic approach: it uses percentiles and running averages to form cluster centers directly from the data, producing smoo

Adaptive Volume Delta Map---
📊 Adaptive Volume Delta Map (AVDM)
What is Adaptive Volume Delta Map (AVDM)?
The Adaptive Volume Delta Map (AVDM) is a smart, multi-timeframe indicator that visualizes buy and sell volume imbalances directly on the chart.
It adapts automatically to the best available data resolution

Dynamic Equity Allocation Model"Cash is Trash"? Not Always. Here's Why Science Beats Guesswork.
Every retail trader knows the frustration: you draw support and resistance lines, you spot patterns, you follow market gurus on social media—and still, when the next bear market hits, your portfolio bleeds red. Meanwhile, institution

See all indicators and strategies
Community trends
MicroStrategy - The red channel of doom returns - November 2025Ah, MicroStrategy…. the stock that’s half software company, half Bitcoin cult. Every time you think it’s about to behave like a normal tech firm, Michael Saylor pops up with a grin, another billion dollars of debt, and the conviction of a man who’s never heard the words “margin call.”
And here we ar

SMCIWe are touching the long-term bullish trendline, below there is another very long-term bullish trendline with two open gaps, but in my opinion there is a greater probability of closing the gaps above towards 51 dollars.

CIFR / WeeklyNASDAQ:CIFR — Quantum Model Projection
Cipher has risen by 1,272%📈 since early April, establishing one of the strongest momentum profiles in its sector, recording its all-time high slightly above the apex of the resistance equivalence lines — a key technical convergence zone within the market str

Nvidia’s Pre-Earnings Harmonic Setup - Do Technicals Work?Coming off our recent conversation about technicals vs. fundamentals—and a great question from you guys about whether technicals work the same in every market—I wanted to take a minute to clear something up: Yes, technicals absolutely work across all markets. The same historical patterns have been r

MSTR - Ripping Short Squeeze Could Be In The PipelineHas looked terrible for quite some time now.
And although it may not ever make another high, I think it may be time for a hard bounce.
Notice that as Bitcoin hits $94K, it has gone oversold on the week RSI and has re-tested the previous tier - 2024 peak.
For this to be a perfect setup, MSTR would

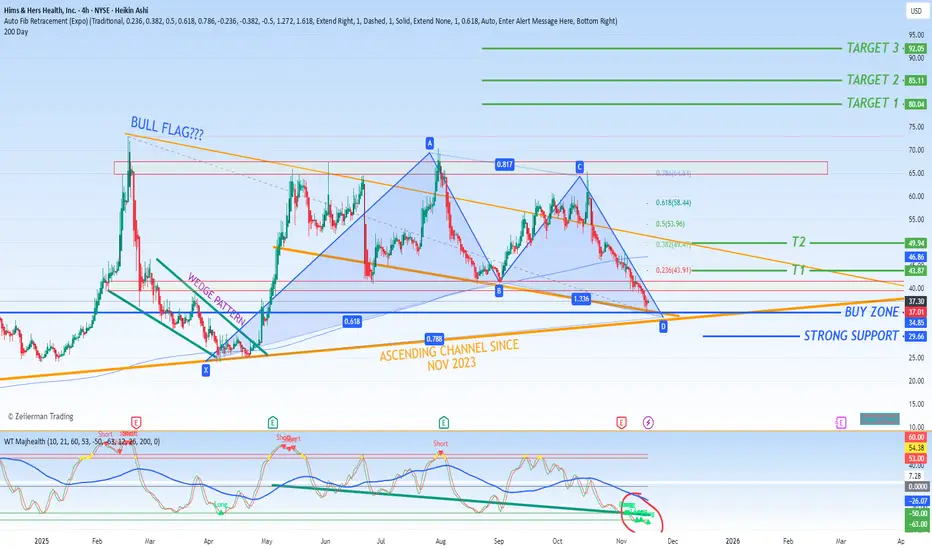
Technical Analysis Update: $HIMS Showing Signs of a Major Trend.The technical structure for NYSE:HIMS is aligning to form a compelling bullish narrative, suggesting the prolonged downtrend may be concluding and a significant new upward cycle could be beginning. The convergence of a key reversal level, a classic continuation pattern, and strong momentum indicat
TSLA Losing Momentum – Uptrend Breakdown RiskLooking at the current picture, both news flow and technical signals show that Tesla is entering a challenging phase. A series of recent negative developments — from large funds selling off, to declining sales in China, and Elon Musk potentially taking a loss on his latest share purchases — have cle

TESLA Technical Analysis! BUY!
My dear friends,
Please, find my technical outlook for TESLA below:
The price is coiling around a solid key level - 404.39
Bias - Bullish
Technical Indicators: Pivot Points Low anticipates a potential price reversal.
Super trend shows a clear buy, giving a perfect indicators' convergence.
Goal

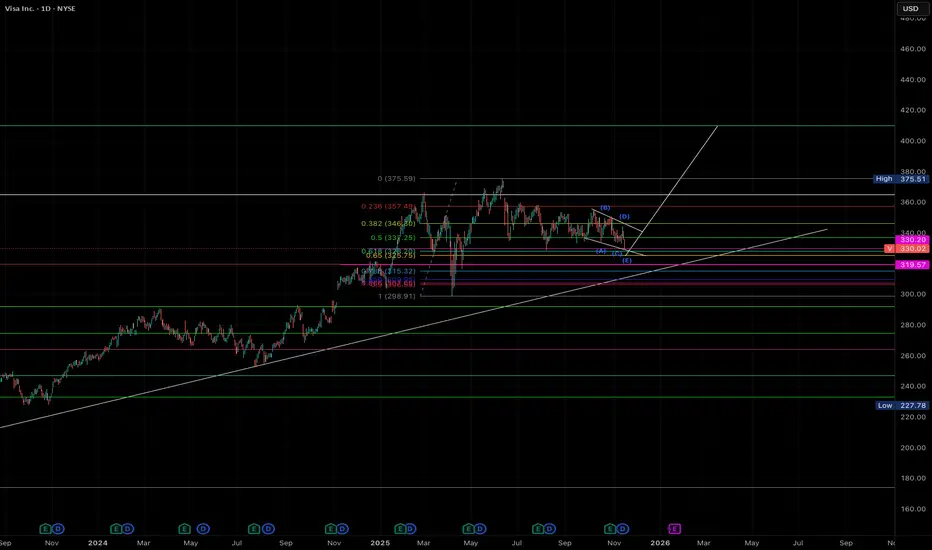
Visa Completing Corrective Structure Preparing for InflectionVisa is completing a corrective compression cycle into a multi-year trendline with Fib confluence and institutional support levels. This setup tilts the probability toward a bullish breakout and trend continuation. If visa holds this support area and breaks the descending wedge there is a possibilit
PYPL | PayPal - They said it would pump!!!!NASDAQ:PYPL
They said it would pump.
...but all it did was dump.
On X they said PayPal would moon!
I got suckered again
...like a buffoon.
Should I add at the support line ahead!??!?
...No. I think I'll sell low instead.

See all stocks ideas
Today
BRCBrady Corporation
Actual
1.21
USD
Estimate
1.19
USD
Today
DTSTData Storage Corporation
Actual
—
Estimate
−0.14
USD
Today
SBEVSplash Beverage Group, Inc. (NV)
Actual
—
Estimate
−2.80
USD
Today
MANUManchester
Actual
—
Estimate
0.08
USD
Today
BTTCBlack Titan Corp
Actual
—
Estimate
—
Today
AGAEAllied Gaming & Entertainment Inc.
Actual
—
Estimate
—
Today
IMPPImperial Petroleum Inc.
Actual
—
Estimate
0.10
USD
Today
NUTXNutex Health Inc.
Actual
—
Estimate
1.82
USD
See more events
Community trends
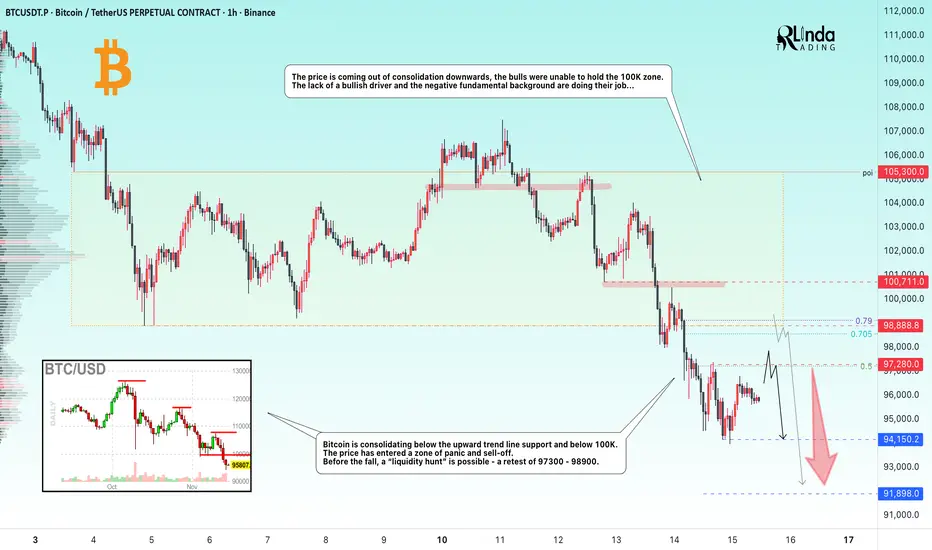
BITCOIN → 100K broken. Consolidation in the short zone...BINANCE:BTCUSDT.P broke through the 100K support level and is consolidating within the local range of 94,150 - 97,280. The decline may continue if the market does not receive support (news or other bullish drivers).
Bitcoin is consolidating below the upward trend line of support and below 100
ETHUSD – Bearish Channel Respect, Flag Breakdown SetupHi
The chart illustrates a clean, structured bearish trend where price continues to respect a broad descending channel. Each major reaction level and pattern aligns well with the larger downtrend, indicating that sellers are still in control.
Price recently tapped a key flip area near the upper bo

BTCUSD: Buyers Aiming for a Move Toward 99,000 ResistanceHello everyone, here is my breakdown of the current Bitcoin setup.
Market Analysis
BTCUSD has recently completed a strong downward phase inside a well-defined Downward Channel, where price continuously formed lower highs and lower lows. After reaching the Support Zone around $94,500–$95,200, buye

Bitcoin: Extreme support 91k! Big pump soon (easy, watch this)Bitcoin is in a critical situation because the price broke the falling wedge, and instead of a bullish breakout, we see a bearish breakdown! I expected this price action, please look at my previous posts. The falling wedge in general is a bullish pattern, but in bear markets they are bearish pattern

Bitcoin Death Cross! Save Yourselves! – November 2025A Death Cross. Sounds terrifying, doesn’t it? Like something out of a low-budget horror film. Here in deepest darkest Bavaria you can’t drive ten minutes without seeing Christ nailed to a cross at every T-junction, it’s practically the local logo. Cross the Austrian border and the numbers multiply l

Understanding Risk Management in TradingWelcome everyone back to Trading view article by King_BennyBag.
In today’s post we will discuss how one can understand risk management in trading, and action it.
We will start off by defining what risk management is.
Risk management definition:
Risk management is the process of identifying
SOLUSDT: Sellers in Control – Downtrend Remains DominantSolana is falling right at the moment when the altcoin market is under the most pressure. This week, a series of negative developments have weighed heavily on sentiment: strong ETF outflows, risk-off behavior, and fading expectations of a Fed rate cut in December. All of this makes it difficult for

Bitcoin FOMOThe technical levels I am watching in the near term are:
Upside Resistance:
104800
117,500
All Time High
Downside Support
87,700
84,100
Throughout this bull cycle, starting from the low in November 2022, following the January 2023 Ichimoku breakout that truly triggered the bull tre
ETH Support Bounce With Target at 3250Ethereum is trading above a key support level after a strong downward move. Price is showing early signs of a potential bullish correction, with projections pointing toward a possible recovery target around $3250. A break above minor resistance could confirm upward momentum.

Bitcoin: 100K Resistance Watch 88K Overlap.Bitcoin rejected the 105K area NEW resistance/old support. I wrote about this possibility a week ago and highlighted it during my stream. With the new low in progress, this area 95K and 90K are the next support areas to watch for swing trade reversals. Note the 90K to 88K area is a major support and

See all crypto ideas
XAUUSDHello Traders! 👋
What are your thoughts on GOLD?
Gold completed the expected bullish correction, reached the resistance zone and the broken trendline, and was strongly rejected from that area.
This rejection confirms continued bearish pressure in the market.
In the current region, we expect gold t

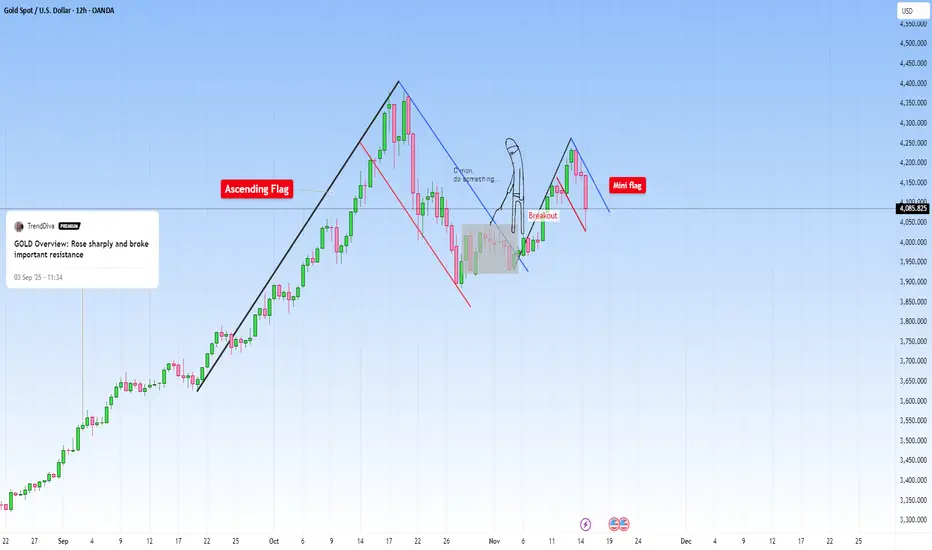
Overview: Gold isn’t Stalling, it’s Loading...Things have seemed a bit messy for gold lately: momentum getting shaky, traders unsure whether this is a top or the start of something bigger... But zoom out even slightly, and the story becomes stupidly simple.
First, after price broke an important resistance and accelerated upwards (Check my ana
XAUUSD Buyers Step In — Market Aiming for $4,140 RetestHello traders! Let’s take a look at XAUUSD (Gold). XAUUSD maintains a bullish structure after bouncing from the key $4,050–$4,060 support zone, where price also retested the ascending trendline. After breaking out of the descending channel, Gold formed a new accumulation zone and moved higher, appro

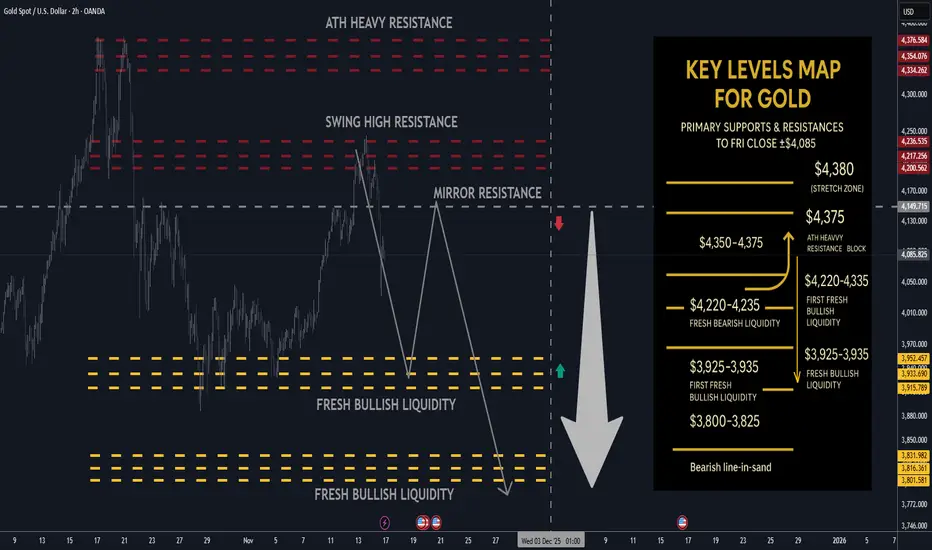
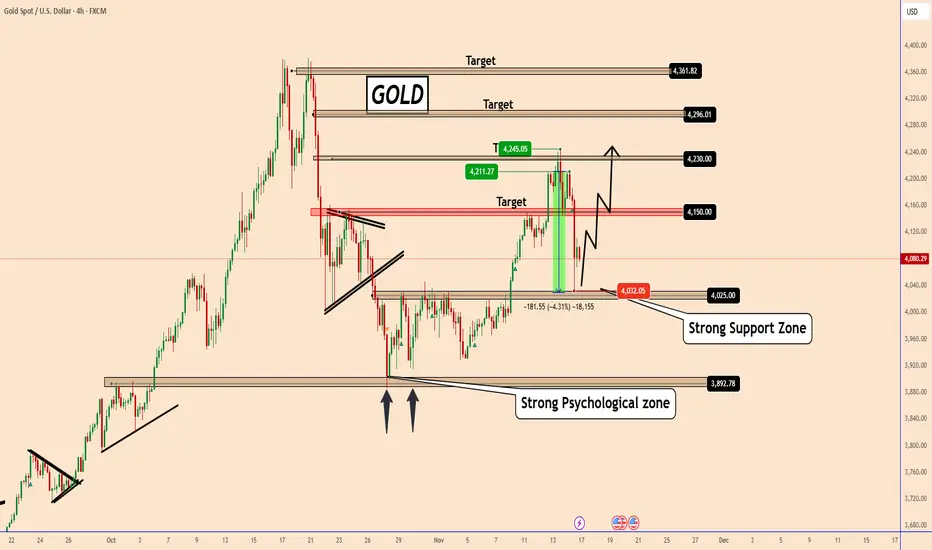
Gold next week: Key S/R Levels and Outlook for Traders🔥 GOLD WEEKLY SNAPSHOT — BY PROJECTSYNDICATE
🏆 High/Close: ~$4,244 → ~$4,085 — buyers punched through $4.20k but sellers defended the $4,220–4,250 band; weekly close is soft but still comfortably above $4k and mid-range.
📈 Trend: Bullish but in corrective / two-way mode ; treating current tape
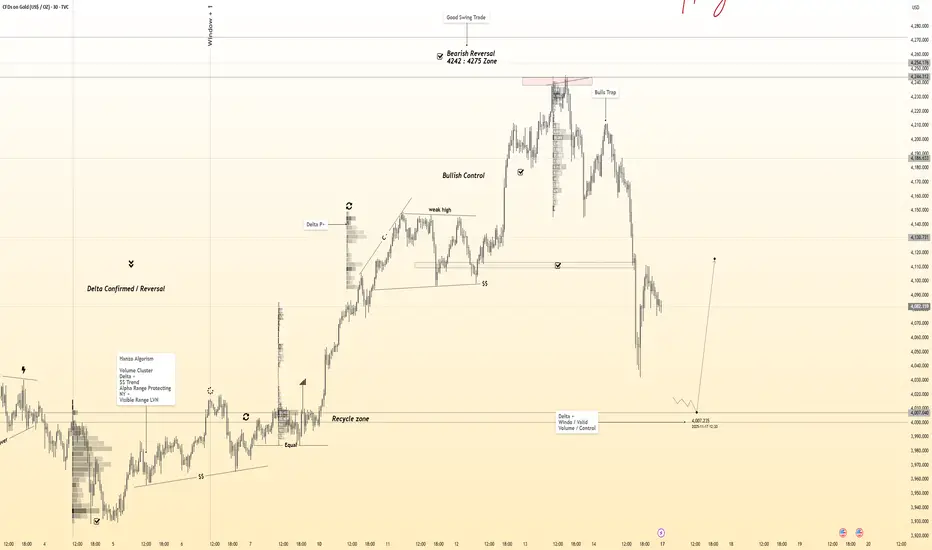
Gold 30-Min — Volume Buy Reversal Triggered⚡Base : Hanzo Trading Alpha Algorithm
The algorithm calculates volatility displacement vs liquidity recovery, identifying where probability meets imbalance.
It trades only where precision, volume, and manipulation intersect —only logic.
✈️ Technical Reasons
/ Direction — LONG / Reversal 4005 Area
Lingrid | GOLD Weekly Analysis: The $4,000 Gatekeeper DecidesOANDA:XAUUSD recent rally hit a wall, surrendering a significant chunk of its weekly gains as trading volume dried up, signaling waning bullish conviction. The critical resistance zone near $4,250 proved impenetrable, acting like a magnet that pulled price back down after a brief flirtation. This f

Is Gold About to Collapse?There are moments when the market doesn’t need to shout for us to sense that a storm is coming . Gold right now is the clearest example: after a wild surge of more than 245 USD in just a few sessions, the market has gone quiet — but it’s the kind of quiet that doesn’t feel safe.
The news backdrop

GOLD: Watching The Support Zone for the Next MoveGOLD: Watching The Support Zone for the Next Move
Gold has pulled back sharply after yesterday’s aggressive selloff, but price is now sitting right on a strong support zone.
This area aligns with the previous structure and could act as a launch point if buyers step back in.
If this zone holds,
Gold Price Retest Setup – Key Supply Zones in FocusGold (XAUUSD) has broken below its ascending structure, forming a clear weak low and shifting into a bearish environment. Price is now attempting a recovery toward two major supply zones highlighted on the chart.
The first reaction zone sits near 4099–4121, where sellers may re-enter. If this level

THE KOG REPORT THE KOG REPORT:
Last week was an extremely decent week in Camelot with all Gold targets hitting and completing.
Quick KOG Report this week.
We’re expecting a potential range to form here between the with the key level of support being the 4040 level while 4080 will need an engulfing to attack

See all futures ideas
EURUSD - Outlook for next week!Introduction
EURUSD has been steadily climbing, maintaining a firm uptrend that continues to show strength in market structure. The series of higher highs and higher lows suggests that bullish momentum remains intact, with the market consistently respecting key demand zones on its way upward. As th
EURGBP: Watching 0.87900 as UK Data Signals Stagflation RiskHey Traders,
In tomorrow's session we are monitoring EURGBP for a buying opportunity around the 0.87900 zone. The pair remains in a broader uptrend, and the current pullback is bringing price back toward a key support and resistance area at 0.87900.
From the fundamental side, the UK data continues

GBPCAD: Perfect Buying Opportunity In Making Worth 1000+ PipsDear Traders,
The GBP/CAD pair is at a turning point, and it might just reverse! Recent market data indicates a strong upward trend, with the pair gaining over 1000 pips in the last cycle. This surge is backed by increasing trading volume and a convincing week-closing candle, with smaller timeframe

EUR/USD - Ascending Triangle (17.11.2025)🧠 Setup Overview TICKMILL:EURUSD
EUR/USD has formed an ascending triangle, but instead of breaking upward, price failed at the horizontal resistance and slipped below the rising trendline — signaling potential bearish reversal. The pair is rejecting the 1.1650–1.1660 supply zone, and downside mo

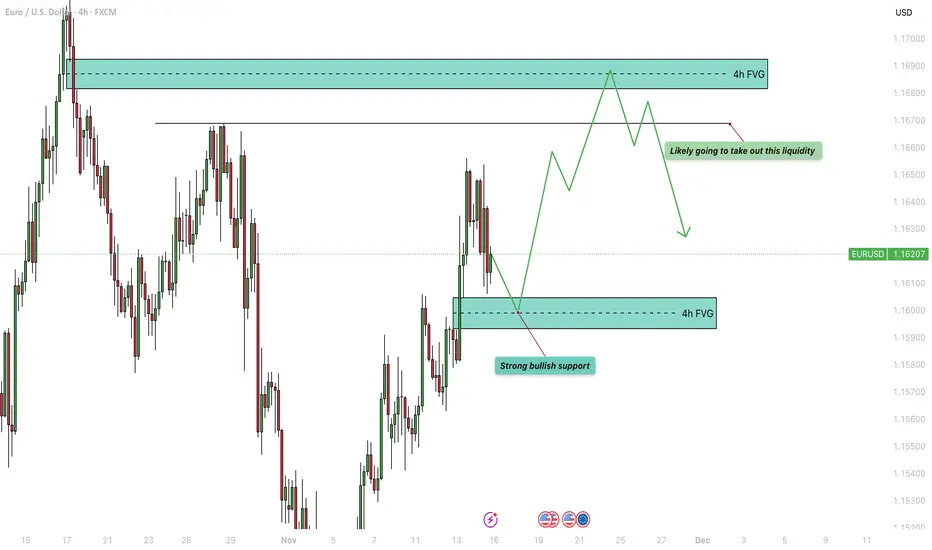
EURUSD Long: Buyers Targeting a Move Toward 1.1670 ResistanceHello traders! EURUSD is maintaining a bullish structure after rebounding from the Demand Zone at 1.1600–1.1610, where buyers consistently stepped in to defend support. This area also aligns with the Demand Line of the ascending channel, making it a key decision point for the current uptrend. Earlie

EURUSD: Breakout Structure Supports Move Toward 1.1650Hello everyone, here is my breakdown of the current Euro setup.
Market Analysis
EURUSD is showing a clear bullish shift after breaking out of multiple downward structures and reclaiming higher support levels. The chart highlights several key phases: a prolonged decline inside two consecutive Down

Eurusd buys
Reasons for a Bullish Bias (SMC Analysis)
1. Clear Uptrend Confirmation (Bullish Market Structure)
The most significant bullish signal is the establishment of a continuous uptrend pattern, indicated by the "Bos" (Break of Structure) labels.
• The chart shows multiple consecutive Bullish BOS

EURUSD: Bearish-Neutral. Look For Lower Prices vs USDWelcome back to the Weekly Forex Forecast for the week of Nov.17-21st.
The EURUSD is ranging and choppy. But if the US Dollar is to remain strong, and pushes higher this week, expect the EURUSD to slide lower.
Look for the bearish BOS to indicate the pullback is over as a confirmation for shorts.

EURUSD: Updated Support and Resistance Analysis 🇪🇺🇺🇸
Here is my latest structure analysis, important supports
and resistances for EURUSD for next week.
Consider these structures for pullback/breakout trading.
❤️Please, support my work with like, thank you!❤️
I am part of Trade Nation's Influencer program and receive a monthly fee for using the

EURCAD maintain further decline towardEUR/CAD is moving within an ascending channel but is showing signs of weakening momentum near the upper boundary. A potential double or triple top pattern is forming, suggesting bearish pressure.
From a technical perspective, the structure appears weak. Additionally, if Canadian employment data con

See all forex ideas
| - | - | - | - | - | - | - | ||
| - | - | - | - | - | - | - | ||
| - | - | - | - | - | - | - | ||
| - | - | - | - | - | - | - | ||
| - | - | - | - | - | - | - | ||
| - | - | - | - | - | - | - | ||
| - | - | - | - | - | - | - | ||
| - | - | - | - | - | - | - |
Trade directly on the supercharts through our supported, fully-verified and user-reviewed brokers.


