When Arctic Storm Meets Government ShutdownNYMEX: Micro Henry Hub Natural Gas Futures ( NYMEX:MNG1! )
A “Perfect Storm” is brewing by weather catastrophe and man-made events.
On Thursday, November 6th, forecaster Atmospheric G2 said that it predicted colder than normal weather over the Eastern US for November 11-15. Driven by the expectati

The best trades require research, then commitment.
Get started for free$0 forever, no credit card needed

Scott "Kidd" PoteetThe unlikely astronaut

Where the world does markets
Join 100 million traders and investors taking the future into their own hands.

ASTS 4H: space internet or orbital dream?AST SpaceMobile (ASTS) is consolidating above the $61–69 zone, right near the 0.618 Fibonacci level of its last major rally. On the 4H chart, momentum shows early reversal signs: falling volume on pullbacks, stochastic turning up, and buyers defending local lows. The bullish setup holds as long as p

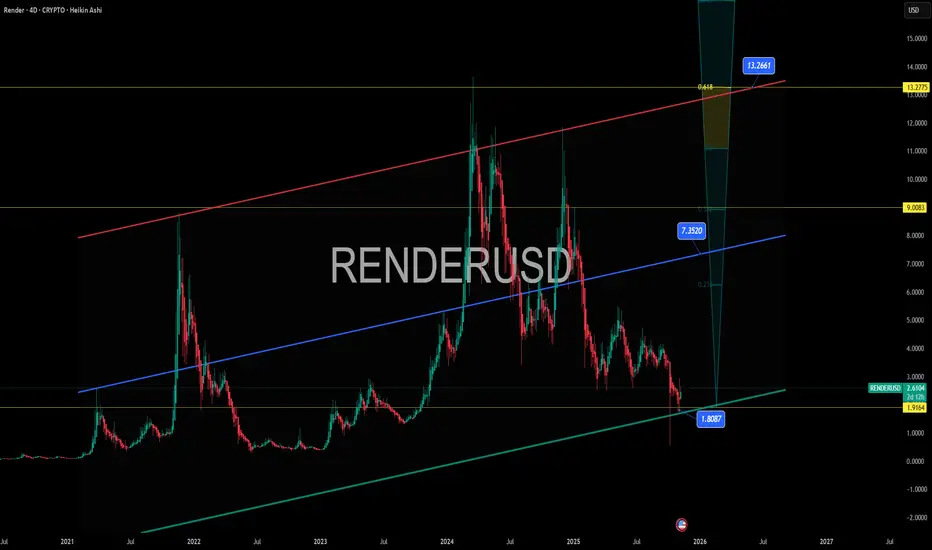
RENDER – Nvidia’s Favorite GPU Coin Testing Demand Zone RENDER – Nvidia’s Favorite GPU Coin Testing Demand Zone 🔍🎯
Render just kissed the $1.91–$2.00 demand zone — the base of the macro channel and a textbook long-term retest level.
This is not just any altcoin. Render powers the Las Vegas Virtual Dome and is the only crypto Nvidia has ever name-drop
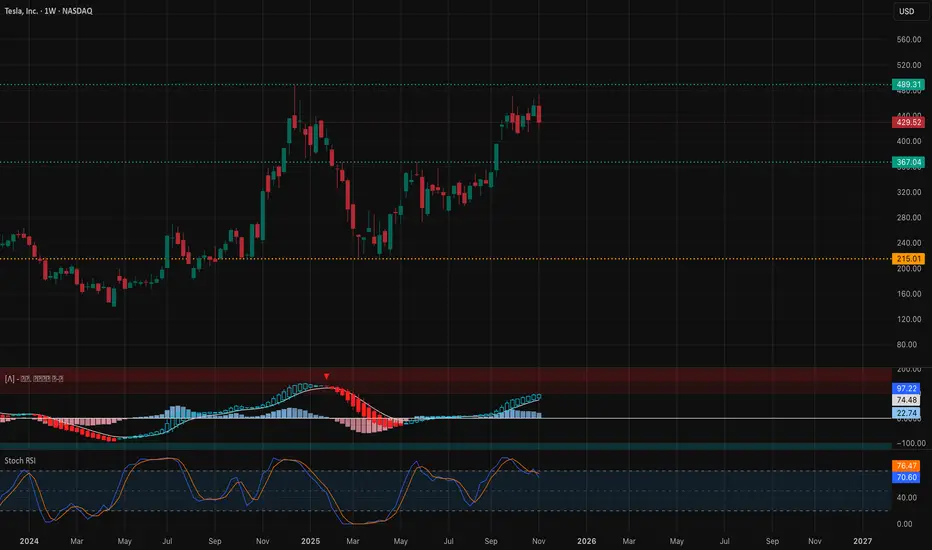
TSLA Setting Up for a Big Move This Week (Nov 10–14)Here’s the full multi-timeframe outlook for TSLA based on SMC structure, channels, BOS/CHoCH shifts, momentum, and the GEX map. Each section is separated so you can attach the matching chart under it.
1. Weekly Timeframe (1W)
Macro Structure
TSLA is still holding its bigger weekly breakout after cl
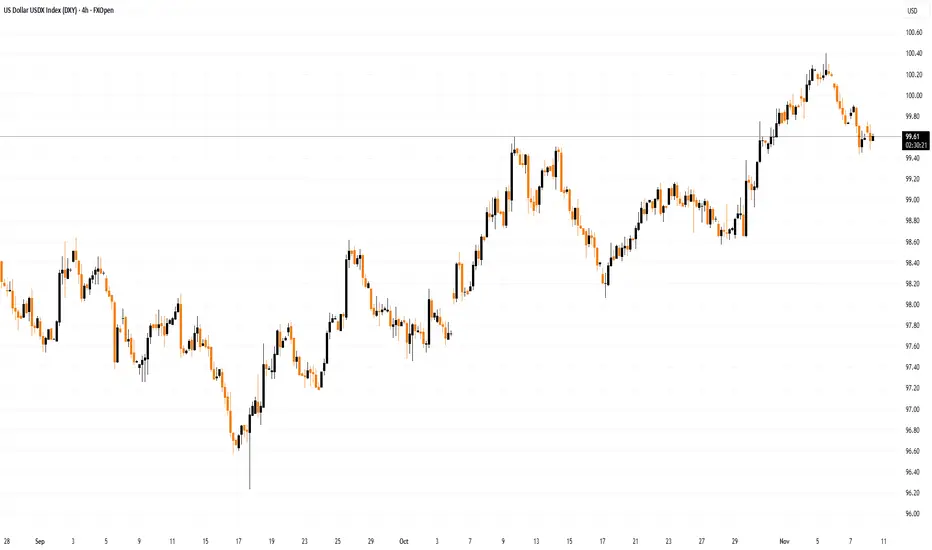
Dollar Index Pulls Back from a Key HighDollar Index Pulls Back from a Key High
As the Dollar Index (DXY) chart shows, the index is currently trading below its 5 November high, which formed after a false bullish breakout (marked by an arrow) above the 1 August peak — a scenario previously outlined in the post “The Dollar Index Near a Ke
US 500 - Has All the Good News Been Priced?After a volatile and nervy 5 days for US stock indices the week ended on a slightly more stable and positive footing.
In relation to the US 500 index this volatility saw it open on Monday November 3rd around 6885, trade down to a low of 6633 early on Friday November 7th, before rallying by over

XAUUSD: Buyers Defend $4,040 — Targeting $4,140 ResistanceHello everyone, here is my breakdown of the current Gold setup.
Market Analysis
XAUUSD has recently confirmed a bullish structure after bouncing strongly from the $4,000–$4,040 Support Zone, an area that coincides with the ascending Trend Line visible on the chart.
This level has repeatedly acted

EUR/USD Loses Momentum – Sellers Take Back Control!The market is beginning to show clear signs: the U.S. dollar is regaining strength , while EUR/USD faces strong correction pressure after a short-lived recovery. The latest news from the U.S. indicates that sentiment is shifting in favor of the greenback, as expectations for a government reopenin

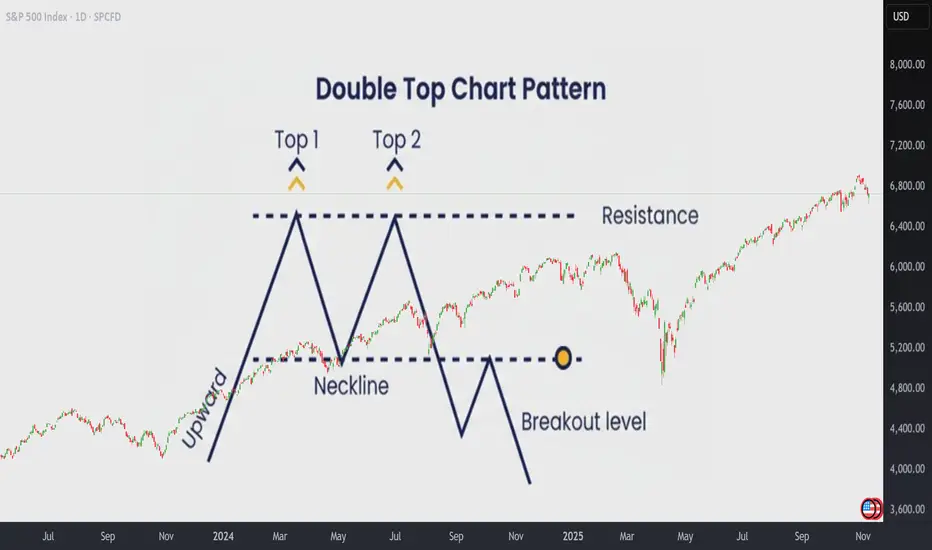
How to Trade the Double Top Pattern Like a ProHow to Trade the Double Top Pattern Like a Pro
The Double Top is one of the most reliable patterns in technical analysis. It often marks the beginning of a resistance zone and signals that bullish momentum is losing strength.
The first top is hard to anticipate, it’s usually just a continuati
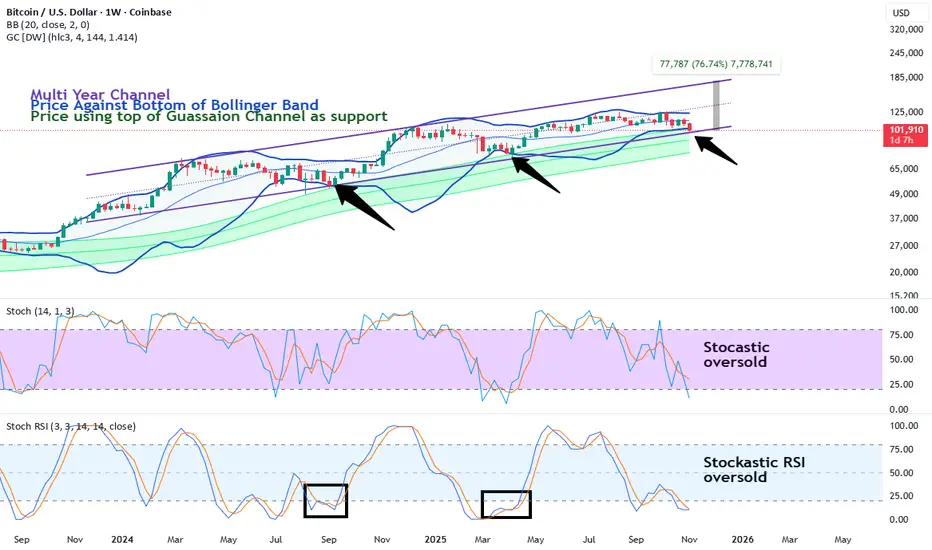
People Panic (again) as bitcoin returns to support (again)Bitcoin has been channeling up for about a year pretty consistently. The basic technical supports are still working. Price hits the weekly Bollinger band bottom, wicks through, builds structure and reverses to a new high. Price has also been bouncing off the top of the weekly gaussian channel. Th
See all editors' picks ideas
PriceFormatLibrary for automatically converting price values to formatted strings
matching the same format that TradingView uses to display open/high/low/close prices on the chart.
█ OVERVIEW
This library is intended for Pine Coders who are authors of scripts that display numbers onto a user's charts. T

LogNormalLibrary "LogNormal"
A collection of functions used to model skewed distributions as log-normal.
Prices are commonly modeled using log-normal distributions (ie. Black-Scholes) because they exhibit multiplicative changes with long tails; skewed exponential growth and high variance. This approach i

Range Oscillator (Zeiierman)█ Overview
Range Oscillator (Zeiierman) is a dynamic market oscillator designed to visualize how far the price is trading relative to its equilibrium range. Instead of relying on traditional overbought/oversold thresholds, it uses adaptive range detection and heatmap coloring to reveal where pri

Volume Surprise [LuxAlgo]The Volume Surprise tool displays the trading volume alongside the expected volume at that time, allowing users to spot unexpected trading activity on the chart easily.
The tool includes an extrapolation of the estimated volume for future periods, allowing forecasting future trading activity.
🔶 U

Smooth Theil-SenI wanted to build a Theil-Sen estimator that could run on more than one bar and produce smoother output than the standard implementation. Theil-Sen regression is a non-parametric method that calculates the median slope between all pairs of points in your dataset, which makes it extremely robust to o

Fair Value Gaps by DGTFair Value Gaps
A refined, multi-timeframe Fair Value Gap (FVG) detection tool that brings institutional imbalance zones to life directly on your chart.
Designed for precision, it visualizes how price delivers into inefficiencies across chart, higher, and lower (intrabar) timeframes — offering a fl

TASC 2025.11 The Points and Line Chart█ OVERVIEW
This script implements the Points and Line Chart described by Mohamed Ashraf Mahfouz and Mohamed Meregy in the November 2025 edition of the TASC Traders' Tips , "Efficient Display of Irregular Time Series”. This novel chart type interprets regular time series chart data to create an ir

Simplified Percentile ClusteringSimplified Percentile Clustering (SPC) is a clustering system for trend regime analysis.
Instead of relying on heavy iterative algorithms such as k-means, SPC takes a deterministic approach: it uses percentiles and running averages to form cluster centers directly from the data, producing smoo

Adaptive Volume Delta Map---
📊 Adaptive Volume Delta Map (AVDM)
What is Adaptive Volume Delta Map (AVDM)?
The Adaptive Volume Delta Map (AVDM) is a smart, multi-timeframe indicator that visualizes buy and sell volume imbalances directly on the chart.
It adapts automatically to the best available data resolution

Dynamic Equity Allocation Model"Cash is Trash"? Not Always. Here's Why Science Beats Guesswork.
Every retail trader knows the frustration: you draw support and resistance lines, you spot patterns, you follow market gurus on social media—and still, when the next bear market hits, your portfolio bleeds red. Meanwhile, institution

See all indicators and strategies
Community trends
TSLA Catalysts Ranking: Q1 2026 Outlook PT 600 USD________________________________________
TSLA: Updated Outlook (Nov-2025)
Here's an updated/revised outlook for TSLA including all the primary
catalyst ranking and analyst ratings and overview of latest developments
this was updated for Q1 2026 with all the viable market data.
_________________

Amazon’s Breakaway Gap After a Stunning Q3 Earnings BeatHello everyone, Amazon just electrified Wall Street with a phenomenal Q3 earnings report that shattered expectations. The company posted an EPS of $1.95 per share — more than double analysts’ forecasts , while revenue climbed to $180.2 billion , reflecting a 13% year-on-year growth . Both A

Amd - Here comes the massive reversal!🩻Amd ( NASDAQ:AMD ) is starting to reverse:
🔎Analysis summary:
Starting back in mid 2025, Amd retested a major confluence of support and rallied about +200%. All of this was expected and the rally ended with a retest of a significant trendline. Eventually, after some back and forth, Amd will

META entering Bear Cycle territory.Meta Platforms (META) has been on a steady decline since its August All Time High (ATH) that is lately accelerating. The reason the breaking below its 1W MA50 (blue trend-line) last week for the first time since April 2025. That was the time that the market formed the bottom of the Tariff War Crisis

Long Position Thesis: UnitedHealth Group (UNH)UnitedHealth Group (UNH) represents one of the most fundamentally solid long setups in the market right now. The company operates in both the insurance and healthcare services sectors through its UnitedHealthcare and Optum divisions, giving it a diversified revenue base that performs well across eco

NVDA Rebounds From Demand Zone, Eyeing $210 Supply AreaNASDAQ:NVDA has shown a strong rebound from the $177–$180 demand zone, signaling potential bullish momentum after a steep correction. The 1-hour chart shows a shift in structure, with higher lows beginning to form, suggesting renewed buyer interest.
As long as the price holds above $182, the shor

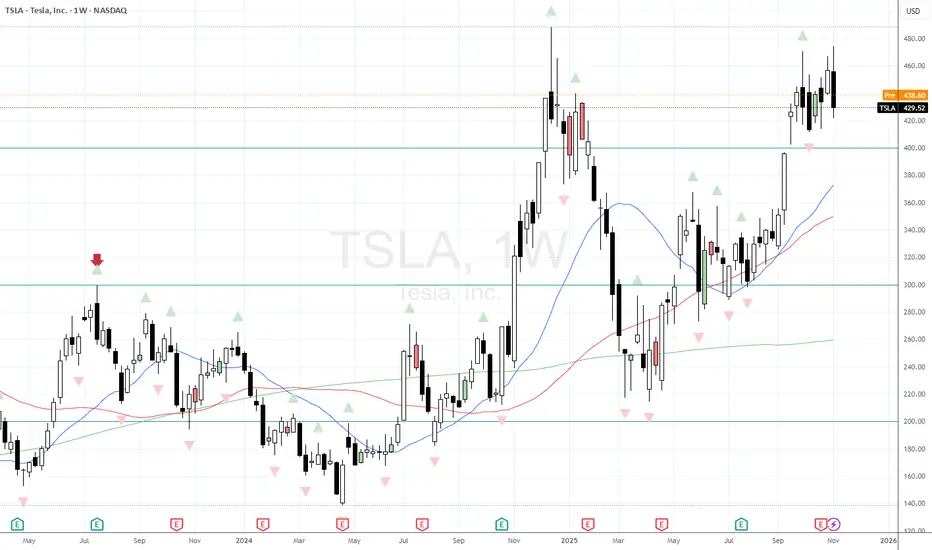
Tesla prints a weekly Key Reversal as part of a triple topTesla has been a volatile stock this year - and difficult to trade because of that.
However I now see that we've printed a weekly bearish key reversal as part of a double/ triple top. Is this now indication that we're likely to flow lower in the immediate future?
Well I am expecting some giddiness
ASTS 4H: space internet or orbital dream?AST SpaceMobile (ASTS) is consolidating above the $61–69 zone, right near the 0.618 Fibonacci level of its last major rally. On the 4H chart, momentum shows early reversal signs: falling volume on pullbacks, stochastic turning up, and buyers defending local lows. The bullish setup holds as long as p
NVO Swing LongFew ways to approach this trade. Look for previous lows at 45 to get taken and look to swing long once back above. More conservative approach would be to wait for a monthly close back above 56.46 as that would confirm a HTF change trend where one should look to buy on pullbacks. If price takes the l

UNH testing support. Next level $290.UNH is testing support level here and if we break the $315, we can continue lower down to $290.

See all stocks ideas
Today
FRMIFermi Inc.
Actual
−0.84
USD
Estimate
−0.02
USD
Today
GGRGogoro Inc.
Actual
−1.01
USD
Estimate
—
Today
SFLSFL Corporation Ltd
Actual
0.09
USD
Estimate
−0.02
USD
Today
NRXSNeuraxis, Inc.
Actual
−0.20
USD
Estimate
−0.20
USD
Today
DDSDillard's, Inc.
Actual
—
Estimate
6.18
USD
Today
ANVSAnnovis Bio, Inc.
Actual
—
Estimate
−0.30
USD
Today
SPIRSpire Global, Inc.
Actual
—
Estimate
−0.33
USD
Today
DSSDSS, Inc.
Actual
—
Estimate
—
See more events
Community trends
Bitcoin - New falling wedge! (no one talks about, must see)Bitcoin is forming a brand new falling wedge pattern no one really talks about! This falling wedge pattern is not complete, and it will take another week to see the whole pattern, but what we see now is the first skeleton of the pattern. Of course this is great because we can enter a short position

Bitcoin – Bulls Need Confirmation Before the Next Leg UpBitcoin first swept the all-time high, taking out liquidity before showing signs of exhaustion. This move triggered a sharp selloff that rebalanced the previous inefficiency left behind on the daily chart. The rejection from that premium area set the tone for a corrective phase, bringing price back

Moon time for Litecoin! - $700 ?? - November 2025Wait a minute… doom for Dogecoin, boom for Litecoin?
“ You can’t have a bearish idea for Doge and a bullish one for Litecoin, idiot!”
Yeah, yeah. I’ve had my coffee, I’m ready for the unhinged piffle that’ll inevitably clutter the comments. Bring it on..
For the rest of us: facts are facts. Chart

BTCUSD Bulls Aim Higher: Buyers Eye Breakout Toward $107,500Hello traders! Let’s take a look at the current BTCUSD structure. After an extended corrective phase within a descending movement, the market found solid support near the $100,000–$100,200 Buyer Zone, which aligns with both the horizontal Support Level and the lower boundary of the broader structure

BTC Preparing for the Next Parabolic Phase Patience Is KeyBitcoin continues to respect its macro bullish structure, maintaining a firm stance above both the Critical and Immediate Demand Zones. The recent consolidation is acting as a natural pause within the broader uptrend a healthy retest phase rather than a reversal.
The $92k–$101k zone remains the imm

DOGE Poised for a Fresh Upswing?Hello everyone, DOGE is trading around 0.1807–0.1810, retesting the FVG zone 0.175–0.180 after rebounding sharply from 0.155–0.160. The structure shows a clear series of higher lows, suggesting that buyers are regaining control. However, the price is pausing near 0.182–0.185, overlapping the Ichimo

DOGEUSDT weekly support hold strong wait for more pumpAs observed on the chart, the major weekly support for DOGEUSDT at $0.15 has demonstrated significant resilience, establishing a robust foundation for the asset. The subsequent bullish momentum we anticipated has indeed commenced, indicating a potential shift in market structure.
The critical techn

BTC: Decision Zone Ahead After Double Bottom ReversalHi!
Bitcoin has formed a clean double bottom at the daily support zone, followed by a sharp bullish impulse that also broke the descending trendline. This shift in momentum signals that buyers are regaining control in the short term.
Price is now approaching the Decision Zone, a key supply area wh

ETHUSDT: Shorts Still in ControlLooking at the ETHUSDT chart, I find it pretty fascinating.
The price has been moving within a well-defined descending channel, forming a consistent series of lower highs and lower lows while respecting both boundaries almost perfectly.
Right now, price is pressing against the upper edge of the c

Big Catalysts Behind Bitcoin’s Pump – Can BTC Hit $110K?Bitcoin ( BINANCE:BTCUSDT ) started pumping yesterday as I expected in my previous idea . Let's take a look at the fundamental reasons for Bitcoin .
Why the sudden BTC pump? Here are the 3 BIG catalysts hitting at once:
1-US Government Shutdown officially ending tomorrow (Nov 12)
Senate fi

See all crypto ideas
Lingrid | GOLD Weekly Market Outlook: Sell the SpikesOANDA:XAUUSD parabolic October rally has stalled, giving way to a sharp corrective phase. This signals waning momentum and the potential start of a deeper pullback. With price now testing key support near $4,000, the market is at a critical juncture: failure to hold this zone opens the door to targ

GOLD → False breakout of resistance after a rally...FX:XAUUSD is emerging from consolidation and entering a distribution phase. Spot metal is testing the 4085 mark, facing strong resistance amid progress in ending the US shutdown and weak economic data...
The US Senate has approved a funding bill, but the process takes time (voting in the House

Gold’s Next Move is Loading…Gold finally broke out of the sideways range after a period of consolidation.
Momentum is slowly shifting to the upside again.
From here, I expect a minor pullback into the broken range to retest it as new support, followed by a continuation higher towards around 4,150.
Waiting for a pullback here

After hitting resistance level going to target Gold is trading around 4080, showing a strong bullish momentum after bouncing from the support trend line. The price has broken above the previous resistance level, confirming an uptrend continuation. As long as it holds above the 4039 support zone, the bullish bias remains strong. The next potentia

Gold 30-Min — Volume Buy & Sell Reversals Triggered⚡Base : Hanzo Trading Alpha Algorithm
The algorithm calculates volatility displacement vs liquidity recovery, identifying where probability meets imbalance.
It trades only where precision, volume, and manipulation intersect —only logic.
✈️ Technical Reasons
/ Direction — LONG / Reversal 4103
☄️Bul

XAUUSD: Buyers Defend $4,040 — Targeting $4,140 ResistanceHello everyone, here is my breakdown of the current Gold setup.
Market Analysis
XAUUSD has recently confirmed a bullish structure after bouncing strongly from the $4,000–$4,040 Support Zone, an area that coincides with the ascending Trend Line visible on the chart.
This level has repeatedly acted
XAUUSDHello Traders! 👋
What are your thoughts on Gold?
The $3,900 level continues to act as a key support zone for gold, preventing further downside pressure for now.
Currently, the price is consolidating between the highlighted support and resistance levels, showing range-bound behavior in the short te

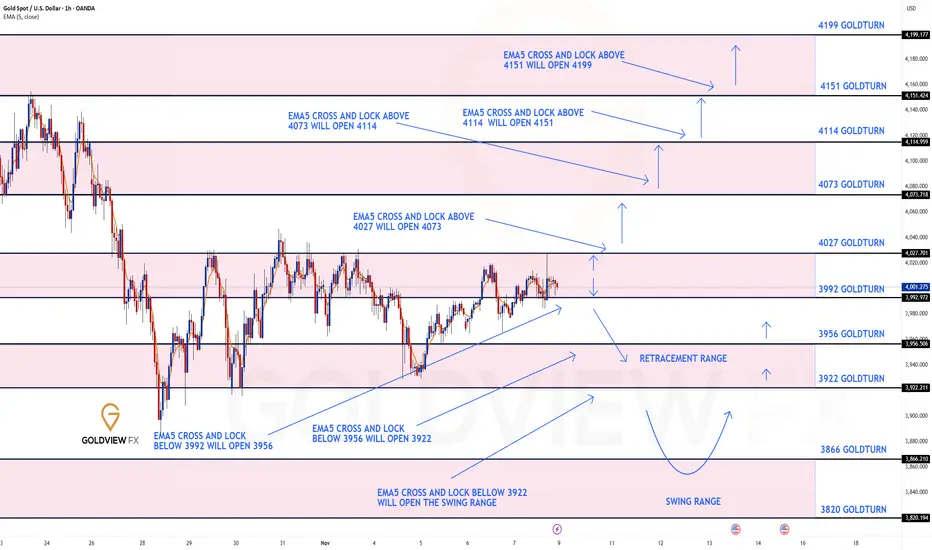
GOLD 1H CHART ROUTE MAP UPDATE & TRADING PLAN FOR THE WEEKHey Everyone,
Please see our updated 1h chart levels and targets for the coming week.
We are seeing price play between two weighted levels with a gap above at 4027 and a gap below at 3992. We will need to see ema5 cross and lock on either weighted level to determine the next range.
We will see le
Gold Finally Moves —Breakout Above 4020 Signals Bullish Momentum1. What Happened Last Week
Gold has spent most of last week consolidating in a narrow range 3960 and 4020, with only a short-lived downside spike on Wednesday. This range reflected market indecision , as traders waited for a clearer direction.
2. What’s Happening Now
The Asian session open this

THE KOG REPORT - UpdateEnd of day update from us here at KOG:
Well, we wanted to go long into the higher red box but we wanted a better entry for this trade from just a little lower. However, we broke the bias level and as soon as we did, we completed every single target including the 4070 target level given to Camelot.

See all futures ideas
USD/CHF - Trendline Rejection (10.11.2025)📊 Setup Overview : FX:USDCHF
USD/CHF continues to respect the descending trendline and Ichimoku cloud resistance, signaling potential downside pressure. Price is currently retesting the resistance zone (0.8070–0.8085) — a strong supply area that has rejected multiple times.As long as this zone h

AUDNZD: Extended Impulse Trend, We are still buying! The price is in a bullish impulse range, and we’re at the end of the final move. It’s unlikely to retrace anytime, and this trend is likely to continue being bullish. Please use accurate risk management.
If you like our work, consider liking and commenting on this idea. It will encourage us to post

EUR/USD in Pullback, Testing Resistance Near 1.1600Hello everyone, on the 2H chart, EUR/USD maintains its short-term uptrend, though momentum has slowed as price approaches the 1.1560–1.1580 resistance area. This zone coincides with an unfilled Fair Value Gap, where buyers often pause to take profits, and sellers begin reappearing. Trading volume h

EURUSD Retests Buyer Zone — Bullish Momentum Aiming for 1.1600Hello traders! I’d like to share my view on EURUSD. After an extended bearish trend inside a descending channel, the pair finally found strong buying interest around the 1.15300–1.15400 Buyer Zone, where price reacted multiple times in the past. This area aligns with both the horizontal Support Leve

GBPUSD Potential UpsidesHey Traders, in today's trading session we are monitoring GBPUSD for a buying opportunity around 1.31400 zone, GBPUSD is trading in an uptrend and currently is in a correction phase in which it is approaching the trend at 1.31400 support and resistance area.
Trade safe, Joe.

11.11.25 Morning ForecastPairs on Watch -
FX:GBPAUD (Currently live in a short)
FX:GBPUSD
FX:GBPJPY
A short overview of the instruments I am looking at for today, multi-timeframe analysis down to what I will be looking at for an entry. Enjoy!

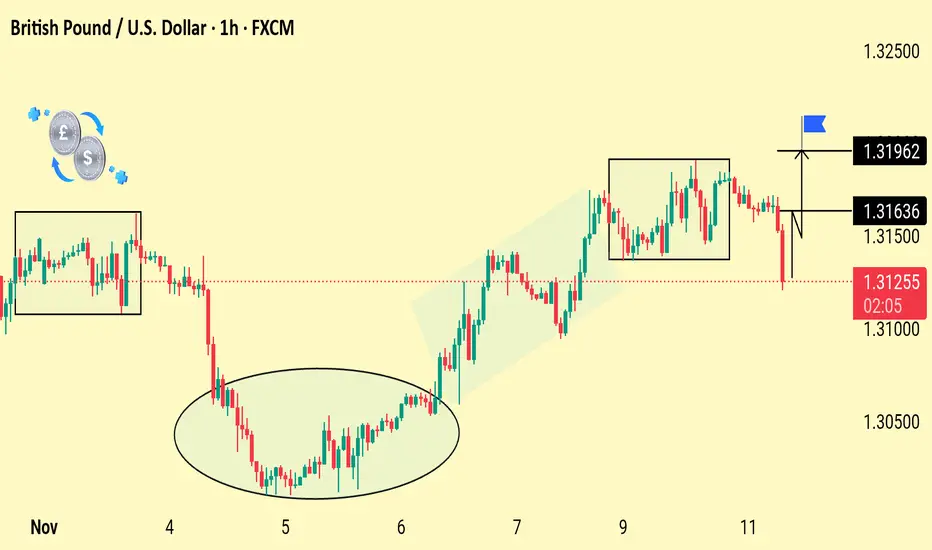
GBP/USD Breakout Watch: Key Levels in FocusGBP/USD is trading inside a consolidation zone after a sharp recovery. A breakout above 1.31636–1.31962 may signal bullish continuation, while failure to hold support increases downside risk.
Price dropped out of the recent consolidation box and is now trading below 1.31636 support. This breakdown s
EUR/USD Loses Momentum – Sellers Take Back Control!The market is beginning to show clear signs: the U.S. dollar is regaining strength , while EUR/USD faces strong correction pressure after a short-lived recovery. The latest news from the U.S. indicates that sentiment is shifting in favor of the greenback, as expectations for a government reopenin
EUR/USD Bearish Rejection from TrendlineEUR/USD shows rejection from the descending trendline near resistance, signaling potential bearish momentum. Price is expected to drop toward the 1.15300 support and FVG zone for possible reversal or continuation.

EUR/USD 4-hour chart Pattern...EUR/USD 4-hour chart:
The current price is around 1.1566.
The chart shows two upward “Target Point” zones marked on the right.
From the markings:
First Target Point ≈ 1.1700
Second Target Point ≈ 1.1890
✅ Targets:
🎯 TP1: 1.1700
🎯 TP2: 1.1890
These appear to be bullish breakout targets ba

See all forex ideas
| - | - | - | - | - | - | - | ||
| - | - | - | - | - | - | - | ||
| - | - | - | - | - | - | - | ||
| - | - | - | - | - | - | - | ||
| - | - | - | - | - | - | - | ||
| - | - | - | - | - | - | - | ||
| - | - | - | - | - | - | - | ||
| - | - | - | - | - | - | - |
Trade directly on the supercharts through our supported, fully-verified and user-reviewed brokers.


