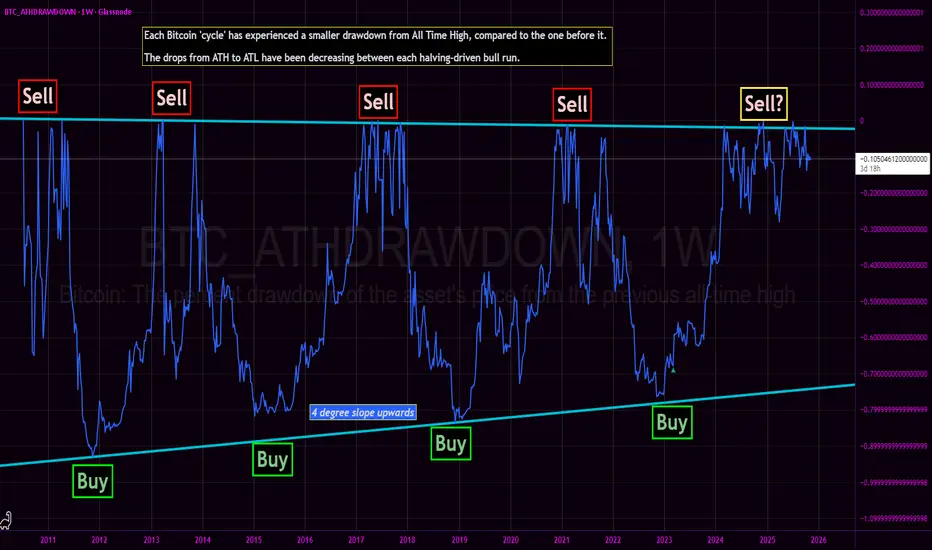
Bitcoin All Time High Drawdown - Bottom nowhere in sight?We revisit the Bitcoin All Time High Drawdown chart originally published in March 2023.
The core thesis of the BTC_ATHDRAWDOWN chart remains intact: each subsequent market cycle has exhibited a diminishing drawdown from its prior All-Time High, with generational cycle bottoms resting squarely on

The best trades require research, then commitment.
Get started for free$0 forever, no credit card needed

Scott "Kidd" PoteetThe unlikely astronaut

Where the world does markets
Join 100 million traders and investors taking the future into their own hands.
Wall Street Weekly Outlook - Week 44 2025 [27.10.- 31.10.2025]Wall Street Weekly Outlook – Week 44, 2025 📊💥
Let’s dive into another exciting trading week! 🚀
Rate decisions, month-end flows, and fresh quarterly earnings are setting the stage for strong market moves.
Sit back, enjoy the overview, and dive into the world of banks, hedge funds, and institution

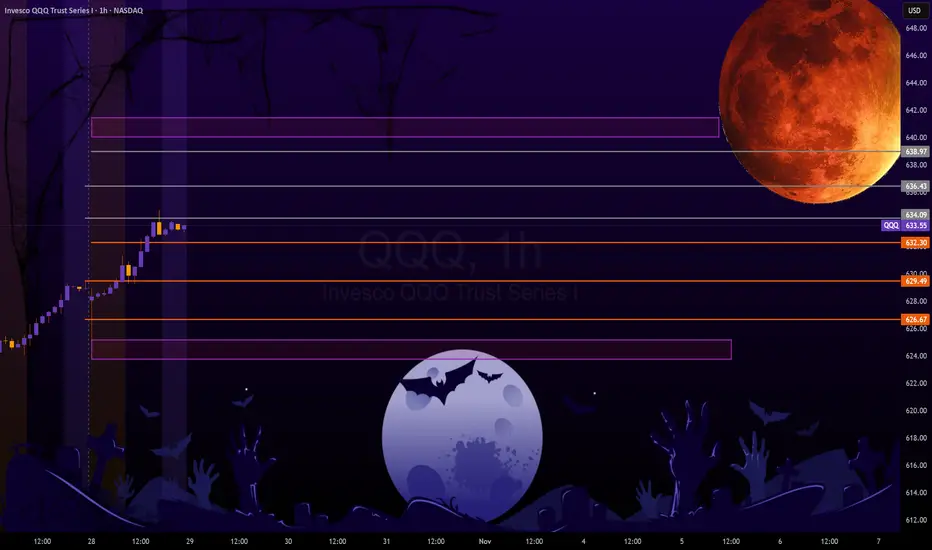
QQQ: Preparation for FOMC... and Halloween Okay, so here is my annual Halloween themed post! Have to stick to tradition I guess.
Here I am sharing intra-day predictions in anticipation for FOMC release tomorrow.
The FEDS are between a rock and a hard place. As the Federal reserve depends on the federal government to release statistics, i
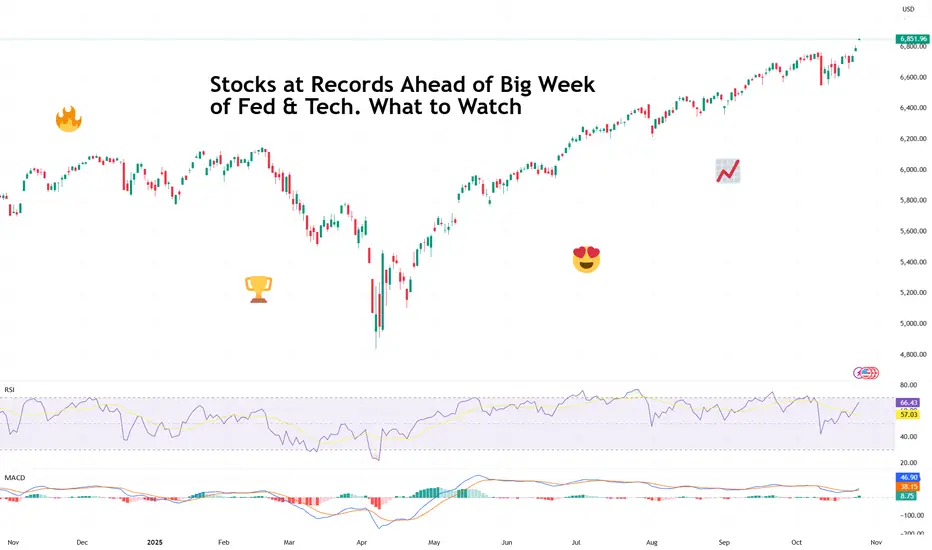
Stocks at Records Ahead of Big Week of Fed & Tech. What to WatchRecord highs, rate-cut optimism, five tech giants on deck — what a time to be a market participant!
It’s Monday, and Wall Street is back doing what it does best — setting new records and pretending not to worry about what comes next.
After a cooler-than-expected inflation print and some diplomat
BTCUSDT – When the Bullish Wave ReturnsBitcoin is showing a notable recovery phase after a series of previous corrections. On the daily timeframe, price continues to move within an ascending channel that has been forming since the beginning of Q3.
Currently, BTC is approaching the midline of the channel around 115,000–116,000 USD , w

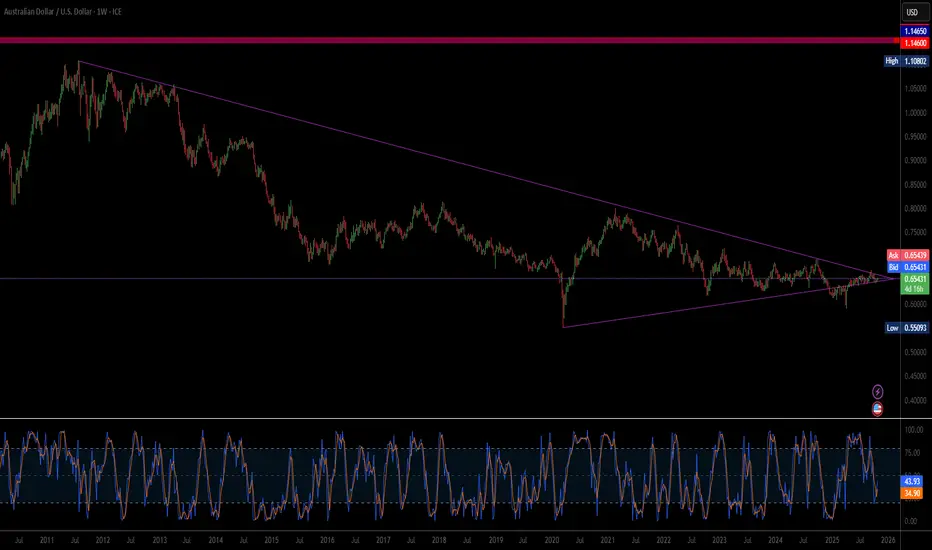
Is Geopolitical Re-Alignment the New AUD Catalyst?The Australian Dollar's (AUD) sharp surge against the US Dollar (USD) is driven by a powerful synergy of geopolitical de-escalation and structural economic realignment. Near-term momentum stems from optimism surrounding an imminent US-China trade deal. As a primary commodity exporter and a financial
Can WTI’s 8% Rally Hold After Trump-Putin Summit Collapse?WTI just staged its biggest two-day rally since June, as hopes for a Trump-Putin summit were dashed, leading to new US sanctions on Russian oil exports.
Here’s what’s fuelling the move and what traders should watch next:
- US sanctions on Russia’s top oil producers after failed Budapest summit tr

XAUUSD-seeking $4,000 region?As my H4 chart shows, gold did make a double top a few days ago and then crashed. You can give credit for this massive 3,800 points move to profit taking or economic uncertainty or any technical reason, maybe a combination but it really does not matter.
What does matter is that we now have a double

BTCUSDT: Bounce from Support Could Ignite Rally Toward $114KHello everyone, here is my breakdown of the current Bitcoin setup.
Market Analysis
Bitcoin (BTCUSDT) has recently transitioned from a bearish phase to a bullish structure after breaking out of a prolonged downward channel. The market had been forming a sequence of lower highs and lower lows until

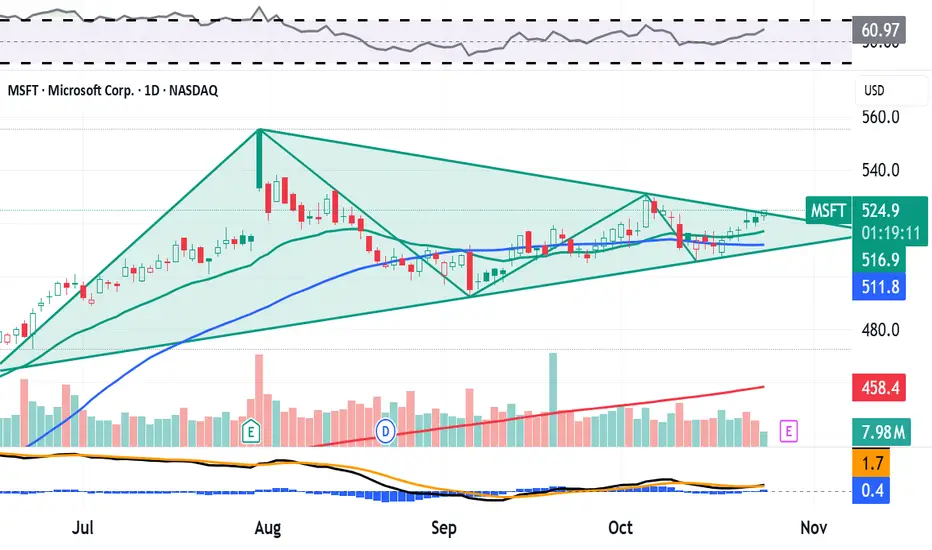
Here's What Microsoft's Chart Says Heading Into EarningsMicrosoft NASDAQ:MSFT , which will release earnings next week, is beating the S&P 500 SP:SPX year to date -- up 24.4% vs. about 15.7% for the SPX. MSFT has also gained roughly 112% over the past three years, while the S&P 500 has added just 78.9%. What does the company's chart show us ahead of e
See all editors' picks ideas
LogNormalLibrary "LogNormal"
A collection of functions used to model skewed distributions as log-normal.
Prices are commonly modeled using log-normal distributions (ie. Black-Scholes) because they exhibit multiplicative changes with long tails; skewed exponential growth and high variance. This approach i

Range Oscillator (Zeiierman)█ Overview
Range Oscillator (Zeiierman) is a dynamic market oscillator designed to visualize how far the price is trading relative to its equilibrium range. Instead of relying on traditional overbought/oversold thresholds, it uses adaptive range detection and heatmap coloring to reveal where pri

Volume Surprise [LuxAlgo]The Volume Surprise tool displays the trading volume alongside the expected volume at that time, allowing users to spot unexpected trading activity on the chart easily.
The tool includes an extrapolation of the estimated volume for future periods, allowing forecasting future trading activity.
🔶 U

Smooth Theil-SenI wanted to build a Theil-Sen estimator that could run on more than one bar and produce smoother output than the standard implementation. Theil-Sen regression is a non-parametric method that calculates the median slope between all pairs of points in your dataset, which makes it extremely robust to o

Fair Value Gaps by DGTFair Value Gaps
A refined, multi-timeframe Fair Value Gap (FVG) detection tool that brings institutional imbalance zones to life directly on your chart.
Designed for precision, it visualizes how price delivers into inefficiencies across chart, higher, and lower (intrabar) timeframes — offering a fl

TASC 2025.11 The Points and Line Chart█ OVERVIEW
This script implements the Points and Line Chart described by Mohamed Ashraf Mahfouz and Mohamed Meregy in the November 2025 edition of the TASC Traders' Tips , "Efficient Display of Irregular Time Series”. This novel chart type interprets regular time series chart data to create an ir

Simplified Percentile ClusteringSimplified Percentile Clustering (SPC) is a clustering system for trend regime analysis.
Instead of relying on heavy iterative algorithms such as k-means, SPC takes a deterministic approach: it uses percentiles and running averages to form cluster centers directly from the data, producing smoo

Adaptive Volume Delta Map---
📊 Adaptive Volume Delta Map (AVDM)
What is Adaptive Volume Delta Map (AVDM)?
The Adaptive Volume Delta Map (AVDM) is a smart, multi-timeframe indicator that visualizes buy and sell volume imbalances directly on the chart.
It adapts automatically to the best available data resolution

Dynamic Equity Allocation Model"Cash is Trash"? Not Always. Here's Why Science Beats Guesswork.
Every retail trader knows the frustration: you draw support and resistance lines, you spot patterns, you follow market gurus on social media—and still, when the next bear market hits, your portfolio bleeds red. Meanwhile, institution

First Passage Time - Distribution AnalysisThe First Passage Time (FPT) Distribution Analysis indicator is a sophisticated probabilistic tool that answers one of the most critical questions in trading: "How long will it take for price to reach my target, and what are the odds of getting there first?"
Unlike traditional technical indicators

See all indicators and strategies
Community trends
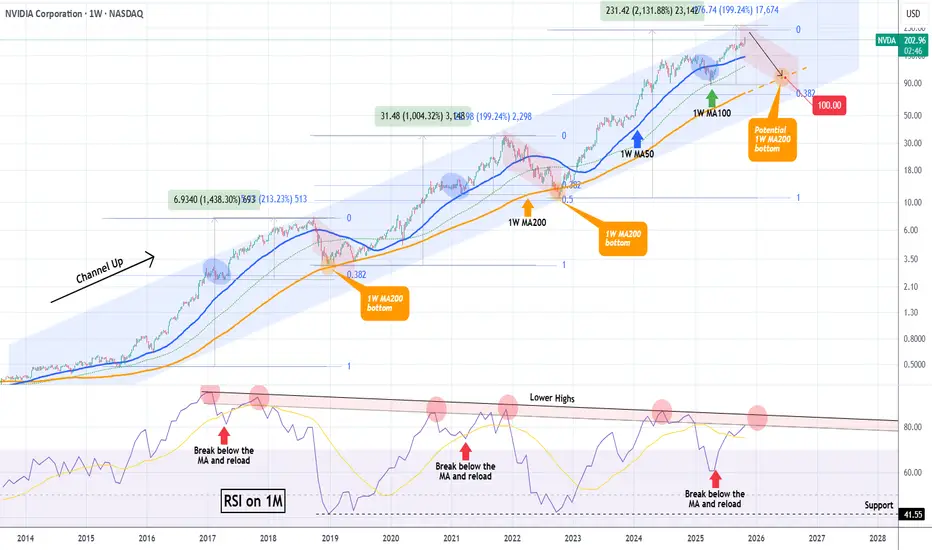
NVIDIA hit $5 Trillion but the end of the rally may be near.NVIDIA Corporation (NVDA) broke this week the $5 Trillion market cap barrier, becoming the first company to do so. In the meantime, it is extending the rally that started on the April 07 Low on the 1W MA100 (green trend-line), following the end of the Tariff War.
This rally has been nothing more th
GME: Bearish StructureAt $22.29, GME is not a dip. It’s a falling knife!
A close below $21.50 could trigger stop-loss cascades.
The combination of:
Bearish Patterns, broken trendline, low volume
Dilution overhang
Crypto beta risk (BTC proxy)
No growth narrative
Do your own research and trade at your own risk.

Meta long Meta dumped on earnings because of a one time tax event. I have long been following this company and have missed obvious setups multiple times. We are right at the .5 fib. This megaphone was drawn on the monthly chart but I zoomed in to show the swing trade setup I am looking at.
We note a basing O

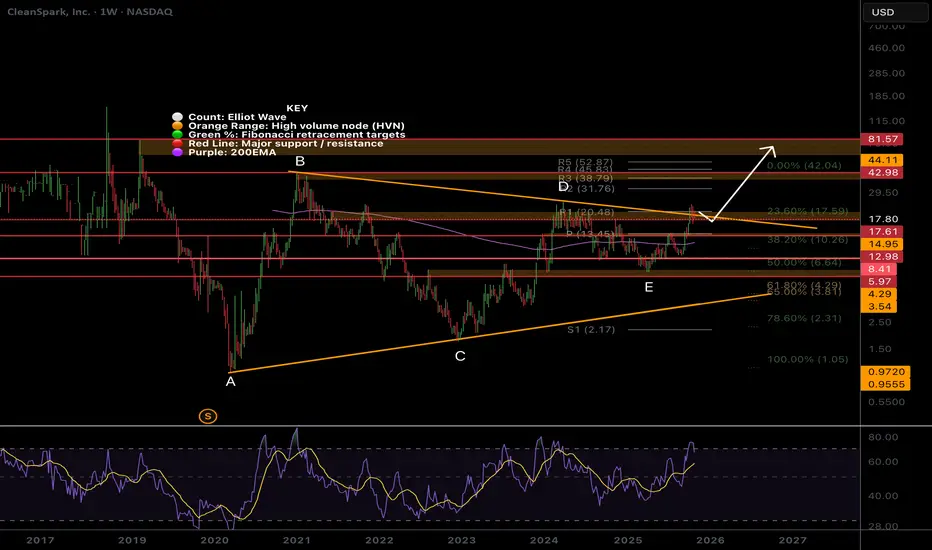
CLSK, Still much higher to goTheres a lot of fear in my comments across platforms due to the candle sizes. Participants need to understand the volatility of their holdings or face repeated mistakes and stress due to fear.
Price is attempting to breakout of the macro triangle upper boundary but was rejected. Breaking above wave
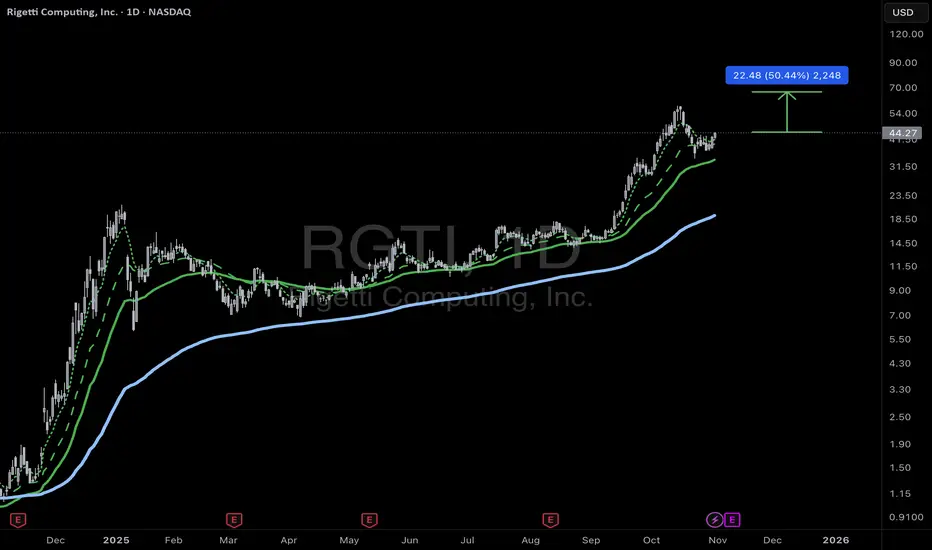
RGTI - quantum computing on the move?Rigetti RGTI beginning a 50% move? New technology requires more and more computing power. Quantum computing is the next frontier. Is the risk work the return?
META: Next Long Term Buy Following a disappointing earnings report, Meta (META) dropped more than 10% in post-market trading, decisively breaking through several key support levels. My primary support zones are typically derived from anchored VWAPs (Volume-Weighted Average Prices), which help identify where institutional bu

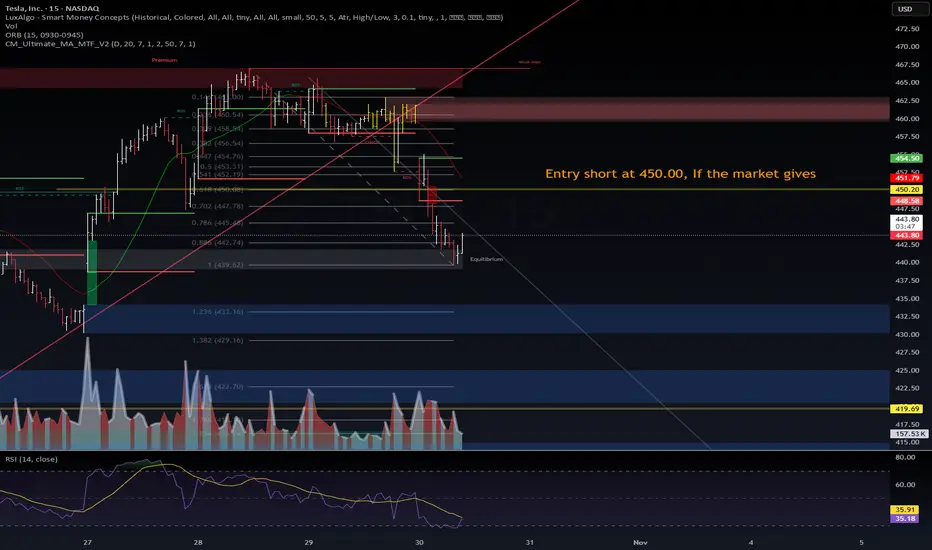
$TSLA | Short Setup Loading — 450 is the Line in the Sand⚙️ NASDAQ:TSLA | Short Setup Loading — 450 is the Line in the Sand
Tesla continues its controlled descent after rejecting the weak high at 465–470.
Price retraced into the 0.786 Fib (≈ 445) zone, finding short-term equilibrium before the next leg.
📊 VolanX DSS Technical Outlook (15m):
Structure
PALANTIR PLUS GOLD. 21 MONTHS OF ULTIMATE SHAG-ALL-BEARS SUCCESSSomewhere far far ago.. in the Faraway Kingdom, or maybe even in the Thirties Land... (in brief - "somewhere in another Galaxy"),
...in late December, 2024 (yet in era of 'altseason-2024' expectations),
..@TradingView has asked somewhat at it awesome Giveaway: Happy Holidays & Merry Christmas.
1️⃣

Amazon (AMZN): Ready for a New Breakout!Amazon isn’t just delivering packages — it’s delivering earnings surprises and a chart breakout too! 😎
After reporting strong Q3 earnings on 30 Oct 2025 , AMZN’s chart popped with a clean cup & handle breakout on 31 Oct 2025 — just in time for a bullish Halloween rally 🎃🐂
💰 Earnings Highligh

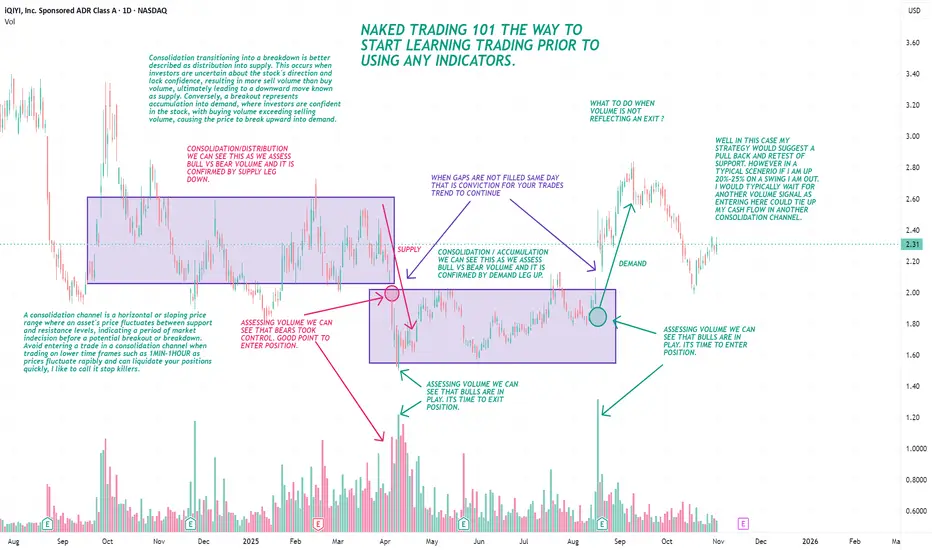
NAKED TRADING 101 - WHERE TO START WHERE TO REVISIT!Good Morning,
Many of us have come across cautionary stories on Reddit trading groups. A common theme among these stories is that the traders involved never mastered the art of naked trading, or they overlooked its importance entirely.
Personally, I have two layouts saved on my TradingView accou
See all stocks ideas
Tomorrow
LLoews Corporation
Actual
—
Estimate
—
Tomorrow
MDPediatrix Medical Group, Inc.
Actual
—
Estimate
0.47
USD
Tomorrow
IIIInformation Services Group, Inc.
Actual
—
Estimate
0.04
USD
Tomorrow
FRPTFreshpet, Inc.
Actual
—
Estimate
0.42
USD
Tomorrow
LQDALiquidia Corporation
Actual
—
Estimate
−0.39
USD
Tomorrow
IDXXIDEXX Laboratories, Inc.
Actual
—
Estimate
3.14
USD
Tomorrow
KTBKontoor Brands, Inc.
Actual
—
Estimate
1.36
USD
Tomorrow
HONEHarborOne Bancorp, Inc.
Actual
—
Estimate
0.19
USD
See more events
Community trends
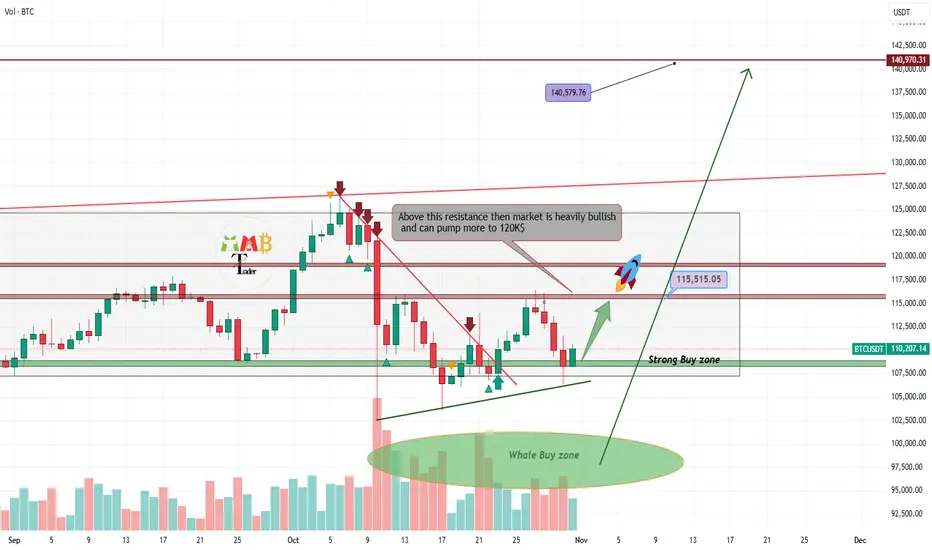
Bitcoin soon will hit 140K$ as new ATHAs the chart illustrates, Bitcoin continues to consolidate within a well-defined range, bounded by the key support at $100,000 and the significant resistance at $117,000. Periods of such compression are typically followed by a decisive directional move, which establishes a new trend path.
Our analy
Bitcoin Bullish Breakout Toward 112,000 TargetBitcoin (BTC/USD) is showing bullish momentum, trading above the trend line support. The price is targeting the 112,000 level, with potential resistance zones ahead. A sustained move above 110,000 could confirm further upside continuation.

TradeCityPro | Bitcoin Daily Analysis #207👋 Welcome to TradeCity Pro!
After a short break, let's get back to the daily Bitcoin analysis. The market is still in a very large range box.
⏳ 1-Hour Timeframe
Currently, Bitcoin is recovering after the drop to the 106319 level and has moved up to 110803.
✅ Today is Saturday, and as you can see,

Bitcoin - The manipulation!On the weekly Bitcoin chart, there’s a clear bearish rising wedge pattern, and right now it’s trading near the lower side of that wedge — getting ready for a downward weekly breakout.
But let me remind you of something important — this will likely be part of a psychological game played by market ma

Have we seen this before? Charting noob here. Perhaps someone with more experience can let me know if I'm just seeing things my mind wants me to see.
Over the past consolidation phases in this cycle, we've seen BTCUSD follow a very similar pattern before a breakout. It looks like we're in the same pattern again.
RSI also

Bitcoin’s Decentralization Is a Lie - Here’s the ProofYou’ve Been Fooled For Years
The narrative: Bitcoin is "decentralized money," free from banks, governments, and corporate control. A financial revolution for the people.
The reality: Bitcoin is one of the most centralized, surveilled, and manipulated financial systems in existence, and the publi

Head and shoulders triangle. Possible dump sub $100,000 in play.Our sell signals came in at top (126k) and last high for right shoulder. Looks like BTC will play within this pattern. Squeeze between max 113.5k and the 106k-104k bottom area (depending ion when it gets there) where it needs to make a decision: Either strong bounce and break to upside with possible

Solana Price Action Turns BearishSolana’s market structure shows a gradual weakening of bullish momentum after an extended upward phase earlier in the month. The asset experienced a breakout that temporarily fueled optimism among traders, but recent sessions indicate a loss of strength as sellers began to dominate. The volume profi

Bitcoin 2025-2029 CycleLikely bitcoin price movement for the rest of 2025 to the bear market bottom of 2026/27 and finally to the next bull peak of 2029
Check in early 2027 for accuracy

#AVAXUSD in next three monthsHey everyone. I think it's gearing up for a solid run in the next 3 months. I believe it'll at least hit the first target within that time frame.

See all crypto ideas
GOLD → Consolidation. The fundamental backdrop is changing...FX:XAUUSD stabilizes after a week-long decline, failing to consolidate above $4050. The market is taking a pause before new impulses. Focus on 4030 and 3980...
Investors are closing positions before the end of the week and month, the reason being the uncertainty surrounding the deal with China

XAUUSD Breaks Out and Continues Its Bullish RallyOANDA:XAUUSD The market is still in a strong downtrend, yet the bearish momentum is gradually losing strength as a double bottom pattern begins to form, a classic signal that sellers are running out of steam.
After the second bottom took shape, buyers stepped in with growing confidence, and the pr

XAU/USD (Gold Spot vs. U.S. Dollar) on the 30-minute timeframe..XAU/USD (Gold Spot vs. U.S. Dollar) on the 30-minute timeframe, using the Ichimoku Cloud with a clearly drawn ascending trendline providing support.
Here’s what’s visible:
Current price: around $4,002 – $4,009.
The price is sitting above the trendline and at the edge of the cloud, suggesting poss

XAU/USD | Gold Fills Liquidity Gap – Another Drop Below $3,900?By analyzing the #Gold chart on the 2-hour timeframe, we can see that after reaching the $3,915 demand zone, price reacted strongly and began to rise, filling the liquidity gap created by last night’s drop. Gold is currently trading around $3,973, and if it fails to hold above $4,015, we could see a

GOLD: Waiting For the Bulls To Join the PartyGOLD: Waiting For the Bulls To Join the Party
From our previous analysis, gold reached the same target twice. The bullish momentum is low, but it could increase over time.
The prevailing trend is evident, which is intact and remains bullish.
Today on the US economic calendar, the PCE data was e

Wall Street Weekly Outlook - Week 45 2025 [03.11.- 07.11.2025]Wall Street Weekly Outlook - Week 45 2025
📅 November 3 – November 7, 2025
Let’s kick off an exciting new trading week — and a brand-new trading month! 🚀
Seasonal factors often play a major role in November and December, and I’ll break them down for you in this week’s video. 🎥📈
Sit back, enjo

NEXT WEEK XAUUAS - GOLDnext week will are looking for short positions on the gold after taking the liquidity at 4046$

All is nothing...When the war begins, all resistance, all supply, all trendline, all dream about discount is nothing.

XAGUSDHello Traders! 👋
What are your thoughts on Silver ?
Silver entered a corrective phase following its recent rally and is now trading below the resistance zone and the broken trendline.
This structure suggests weakening bullish momentum and a potential continuation to the downside once the pullback

( Gold Protocol ) Bearish After Break Detected Status: Active Reversal Protocol
Symbol: Gold
Session: London–New York Overlap (Smart Exit Window)
Confidence Level: ★★★★★ ( Hanzo Volume Detected )
☄️ Bearish After Break Out 4005
Reasons
1. Alpha Sequence Engaged
— Smart flow detected within Hanzo precision range.
2. Volume Window Synce

See all futures ideas
GBPAUD Textbook Bear FlagGBPAUD price had been falling sharply, sellers were in full control, driving the market lower with strong bearish momentum.
Then came a pause. Price started climbing slowly, forming a rising channel. That’s the bear flag. Buyers are trying to recover, but it is weak and hesitant, every push higher

Hawkish Fed Tone Caps EURUSD Near 1.1580!!Hey Traders, in today’s trading session we’re monitoring EURUSD for a potential selling opportunity around the 1.15800 zone.
The pair remains in a downtrend, and the current correction phase is bringing price back toward the 1.15800 resistance area, aligning with the broader bearish structure.
On t

EUR/USD – Bears in Control but Demand Zone Could Spark a Rebound🔹 EUR/USD – Weekly Outlook (1–7 November 2025)
Bears remain in control, but a key demand zone is now in play.
The euro continues to trade under pressure as macro divergences between the U.S. and Eurozone persist.
In the U.S., the latest data confirmed a clear cooldown in growth and inflation, with

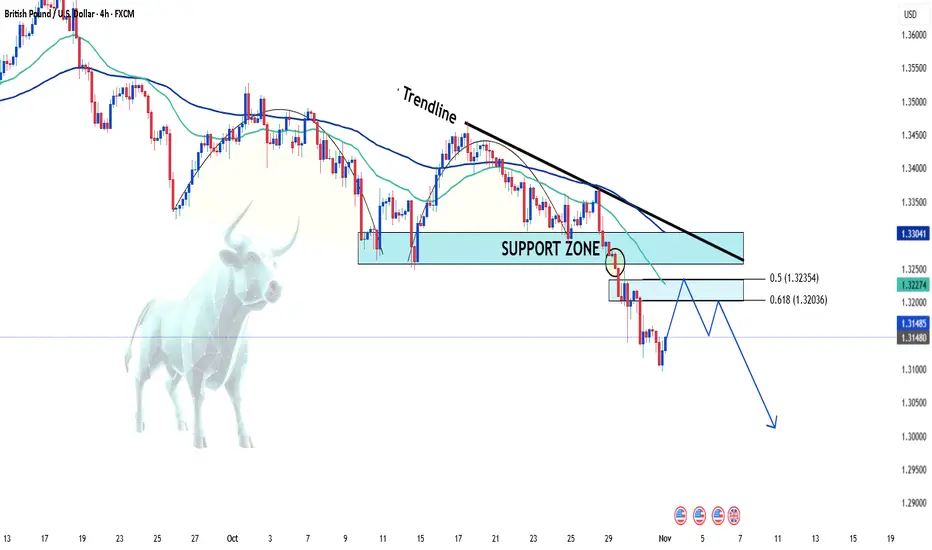
GBPUSD: Drops Sharply After Breaking Key Support👋Hello traders , what’s your view on FX:GBPUSD ?
The GBP/USD pair continues its bearish momentum in the first sessions of November, currently trading around the 1.314 zone after failing to hold the key 1.326 support — which has now turned into new resistance.
On the 4H technical chart, the desce
EUR/USD Faces Renewed Downside Pressure as Sellers DominateHello everyone, the EUR/USD pair is showing clear signs of weakness as sellers continue to dominate, pushing the price back to around 1.1550 after a brief rebound. On the H4 timeframe, the market structure remains in a medium-term downtrend with a series of lower highs and lower lows, confirming co

USDJPY 4H Long – Dollar Strength Holds Post FOMCPrice is consolidating near resistance after a strong bullish leg. USD sentiment shifted as the Fed dismissed potential rate-cut speculation, reinforcing dollar strength.
Liquidity sits below the 153.60 area, where prior resistance now acts as support. A sweep into this zone could trigger continuati


EURUSD rules forex due to unmatched liquidityCheck my weekly chart for its price structure and volatility clues.
What's your go-to pair? #ForexBasics

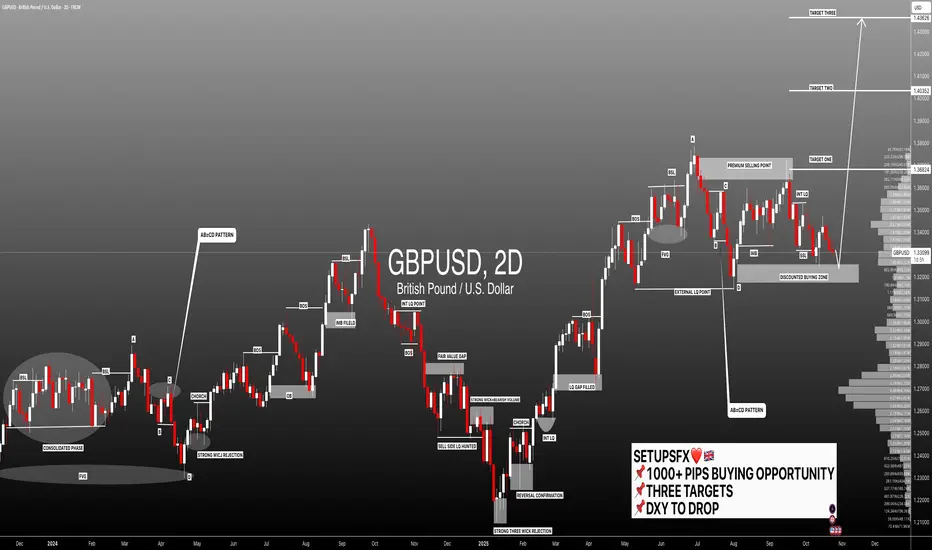
#GBPUSD:+1000 Pips Highly Probable Target! Agree with the idea? GBPUSD is currently trading at a highly probable point where we may see a strong bullish volume emerge in the market. This key level is only valid if the US dollar declines further, as a weak dollar will push our prices towards our target zones, helping us gain a higher risk-to-reward trade setup. P
NZD-USD Long From Demand Area! Buy!
Hello,Traders!
NZDUSD tapped into a horizontal demand area with strong rejection wicks. Expecting a short-term bullish reaction toward the next liquidity pocket at the target level.Time Frame 2H.
Buy!
Comment and subscribe to help us grow!
Check out other forecasts below too!
Disclosure: I a

See all forex ideas
| - | - | - | - | - | - | - | ||
| - | - | - | - | - | - | - | ||
| - | - | - | - | - | - | - | ||
| - | - | - | - | - | - | - | ||
| - | - | - | - | - | - | - | ||
| - | - | - | - | - | - | - | ||
| - | - | - | - | - | - | - | ||
| - | - | - | - | - | - | - |
Trade directly on the supercharts through our supported, fully-verified and user-reviewed brokers.


