NZDUSD H4 | Bullish Bounce Off PullbackMomentum: Bullish
Price has bounced off the buy entry, which is acting as a pullback support. This level aligns with the 38.2% Fibonacci retracement, adding significant confluence and strength to the zone.
Buy Entry: 0.5743
Overlap support
Slightly above the 38.2% Fibonacci retracement
Stop Loss:
Your 2025 space mission is here
Suit up and get ready to explore every highlight of your trading galaxy.


XAUUSD (H1) – Trading by LiquidityXAUUSD (H1) – Trading by Liquidity
Price breaks the channel but buying power is weakening, wait for a pullback to the trendline to enter a trade
Summary of today's strategy
Gold has broken the price channel, but the key point is that buying power is weakening after the breakout. As the market is a

Price Is Rising Fast, but the Key Move Lies in the Pullback to 4Hello, I'm Domic.
Looking closely at the H4 chart, gold is currently in a very strong acceleration phase. A steep sequence of bullish candles has pushed price into the 4.48xx area, while both trendlines on the chart are clearly sloping upward. This confirms that the uptrend remains dominant, but i

DOGE: The Cycle Repeats (1W) FRACTAL DOGE: The Cycle Repeats (1W Timeframe)
The Macro View: We are looking at a textbook fractal setup. The chart highlights four distinct structural points (1, 2, 3, 4). We are currently at Point 4, and the structure is rhyming perfectly with the pre-bull run accumulation phases of the past.
1. The Ro

Giveaway 2025: Merry Christmas & Happy Holidays!Another year, another stack of charts, lessons learned the hard way, and moments where the market reminded us who’s really in charge.
As 2025 winds down, we want to say a genuine thank you. Your ideas, comments, chart screenshots, hot takes, and valuable feedback are what make TradingView what it i

BTCUSDTHello Traders! 👋
What are your thoughts on Bitcoin?
Bitcoin has entered a corrective phase after a strong bearish move and is currently ranging between a clearly defined support and resistance zone. As long as price remains inside this range, no major directional move is expected.
At the moment,

EUR/AUD at a Crossroads!The EUR/AUD pair is trading in an upward trend on the four-hour timeframe following the pullback that took place between November 25 and December 10.
The pair is now at a crossroads between continuing the upward trend from the current support levels at 1.77340 and 1.77154, targeting 1.77792 as the

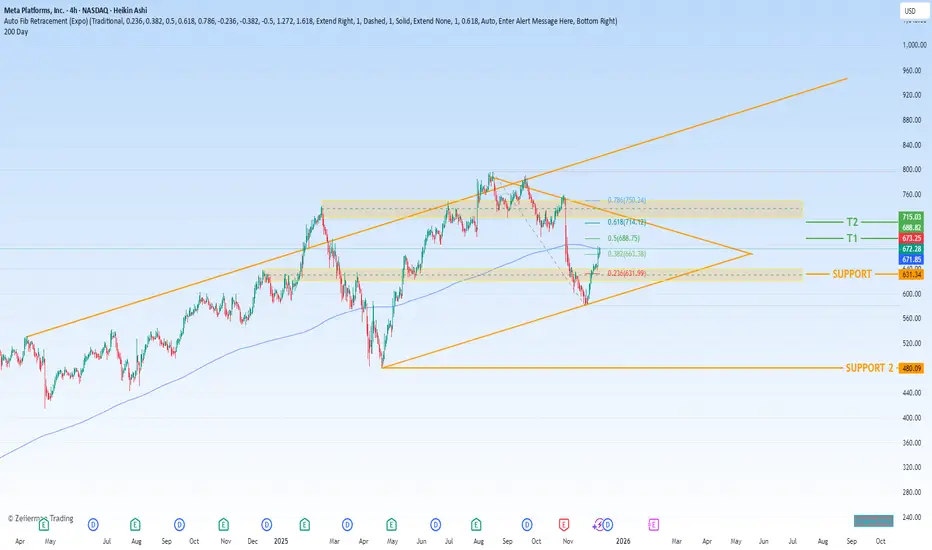
Navigating Volatility Amid Unprecedented Scale and Future InvestNASDAQ:META Meta Platforms, Inc. (META) presents a compelling bullish case rooted in its unparalleled execution within the digital advertising core business, juxtaposed against significant strategic investments in future technologies—investments that, while costly, are funded by immense cash flows
GC(XAU/USD) technical analysis and directional opinion*In this analysis I will not include macroecnomic analysis as we all know broad financial market is waiting for BoJ to create clear directional bias upcoming end of this week on Friday. However I will make a seperate post regarding "How to decode BoJ decision" on the day before the Japanese rate dec

Nasdaq-100: Lower Low and Lower High?The Nasdaq-100 made a lower low, and now it might have made a lower high.
The first pattern on today’s chart is the November 21 low of 23,854, some 353 points below the October trough. That broke a series of higher lows since April.
Second, the tech-heavy index peaked at 25,835 on December 10. Tha

See all editors' picks ideas
Multi-Distribution Volume Profile (Zeiierman)█ Overview
Multi-Distribution Volume Profile (Zeiierman) is a flexible, structure-first volume profile tool that lets you reshape how volume is distributed across price, from classic uniform profiles to advanced statistical curves like Gaussian, Lognormal, Student-t, and more.
Instead of forcin

Multi-Ticker Anchored CandlesMulti-Ticker Anchored Candles (MTAC) is a simple tool for overlaying up to 3 tickers onto the same chart. This is achieved by interpreting each symbol's OHLC data as percentages, then plotting their candle points relative to the main chart's open. This allows for a simple comparison of tickers to tr

Vdubus Divergence Wave Pattern Generator V1The Vdubus Divergence Wave Theory
10 years in the making & now finally thanks to AI I have attempted to put my Trading strategy & logic into a visual representation of how I analyse and project market using Core price action & MacD. Enjoy :)
A Proprietary Structural & Momentum Confluence System

Per Bak Self-Organized CriticalityTL;DR: This indicator measures market fragility. It measures the system's vulnerability to cascade failures and phase transitions. I've added four independent stress vectors: tail risk, volatility regime, credit stress, and positioning extremes. This allows us to quantify how susceptible markets are

Volatility Risk PremiumTHE INSURANCE PREMIUM OF THE STOCK MARKET
Every day, millions of investors face a fundamental question that has puzzled economists for decades: how much should protection against market crashes cost? The answer lies in a phenomenon called the Volatility Risk Premium, and understanding it may fundam

Volume Gaps & Imbalances (Zeiierman)█ Overview
Volume Gaps & Imbalances (Zeiierman) is an advanced market-structure and order-flow visualizer that maps where the market traded, where it did not, and how buyer-vs-seller pressure accumulated across the entire price range.
The core of the indicator is a price-by-price volume prof

Match Finder [theUltimator5]Match Finder is the dating app of indicators. It takes your current ticker and finds the most compatible match over a recent time period. The match may not be Mr. right, but it is Mr. right now. It doesn't forecast future connection, but it tells you current compatibility for today.
Jokes aside,

Trend Line Methods (TLM)Trend Line Methods (TLM)
Overview
Trend Line Methods (TLM) is a visual study designed to help traders explore trend structure using two complementary, auto-drawn trend channels. The script focuses on how price interacts with rising or falling boundaries over time. It does not generate trade sign

Breakouts & Pullbacks [Trendoscope®]🎲 Breakouts & Pullbacks - All-Time High Breakout Analyzer
Probability-Based Post-Breakout Behavior Statistics | Real-Time Pullback & Runup Tracker
A professional-grade Pine Script v6 indicator designed specifically for analyzing the historical and real-time behavior of price after strong All-Ti

Count█ OVERVIEW
A library of functions for counting the number of times (frequency) that elements occur in an array or matrix.
█ USAGE
Import the Count library.
import joebaus/count/1 as c
Create an array or matrix that is a `float`, `int`, `string`, or `bool` type to count elements from, t

See all indicators and strategies
Community trends
Oracle - This stock is heading higher!🚀Oracle ( NYSE:ORCL ) is heading higher now:
🔎Analysis summary:
Yes, over the course of the past couple of weeks, we witnessed a harsh drop of -50% on Oracle. But looking at the higher timeframe, Oracle is just creating a bullish break and retest. If we see bullish confirmation soon, Oracle w

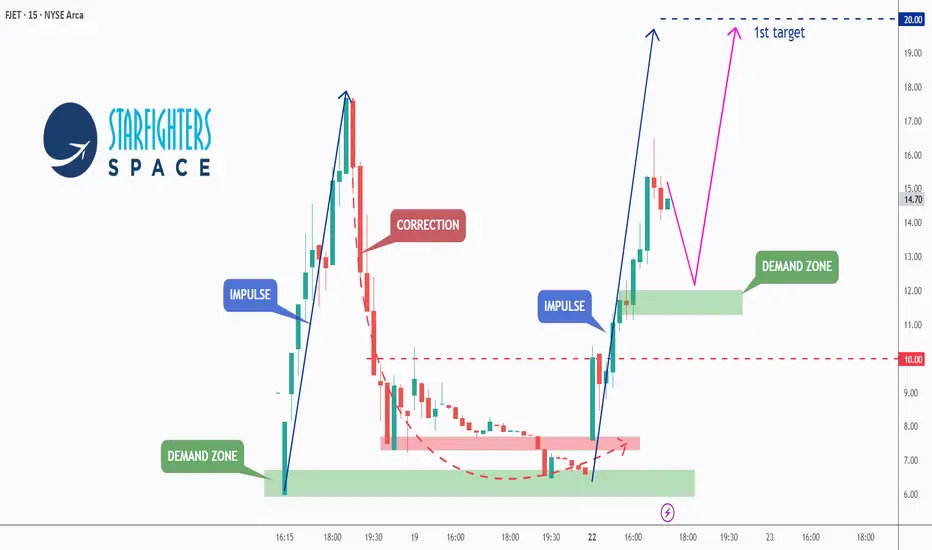
FJET - From Private Skies to Public Markets!!Most retail investors never had access to the biggest space winners.🌌
SpaceX went from a private valuation near $46B to over $800B without ever giving the public a chance to participate.
This time, the door is open❗️
Starfighters Space, Inc. AMEX:FJET has officially entered the public
Nvidia (NVDA) Shares Rise On Potential Chip Shipments to ChinaNvidia (NVDA) Shares Rise On Potential Chip Shipments to China
According to Reuters sources, Nvidia has informed Chinese clients of plans to begin shipments of its H200 chips by mid-February 2026. This has been made possible by a recent change in US export policy, which allows the sale of advanced

RIOT: Watch out for B waveYearend rally might be afoot. For RIOT, it is at a precarious spot. If this is the start of minor wave 3, then it is most likely in process of just 1 of 3. the move from $12 to $16 is a very short one. This opens up a potential zigzag scenario for a wave B of 2. This is also a good entry with a stop

Webull (BULL): Fibonacci Swing Setup Targeting $11.702-hour timeframe to identify potential price targets and reversal zones. Here's the structure:
- **Current Price**: $8.74
- **Volume**: 37.45K (moderate interest)
- **Fibonacci Levels**: 23.6%, 38.2%, 50%, 61.8%, 78.6% retracements used to mark support/resistance zones.
- **Extension Target**: 1.272

NVDA short Trade Setup – POC Reaction and Reversal PotentialPrice has just reacted to the Point of Control (POC), showing signs of absorption and potential exhaustion. I’m anticipating a reversal targeting yesterday’s POC, which aligns with a key round number—adding confluence to the setup.

$LAZR maybeGave a good thought about this one, I´ll put something in to it :
Entry : CMP
TP : 1.10
SL : 0.176
Liquidity zone at 0.18
A few more levels downward...
Be careful!
Financial Disclaimer:
This is not financial advice. This is a technical perspective based on price action and market structure. Al

Repeat of 2 years ago?HIMS may be repeating what it did over 2 years ago, which was the last time the 100 DMA crossed below the 200 DMA. Typically, this is considered bearish; however, as occurred in 2023, when accompanied by an RSI bullish divergence, the move can be a constructive signal. Price is currently oversold. W

NVO: Demand volume confirmed!NVO: Demand volume confirmed!
.
Backtest at LPS and go up short view, then.
.
US STOCKS- WALL STREET DREAM- LET'S THE MARKET SPEAK!

SMCI Loss of this Support can result into crash to $10.Supermicro Computer Inc. (SMCI) has been under heavy pressure since its March 2024 ATH and last month hit and held its 1M MA50 (blue trend-line). This is a key Support level, which even though it broke on the November 2024 crash, the price managed to recover and close the month back up above it. In

See all stocks ideas
Dec 31
MSSMaison Solutions Inc.
Actual
—
Estimate
0.00
USD
Dec 31
JVACoffee Holding Co., Inc.
Actual
—
Estimate
—
Jan 1
FCFranklin Covey Company
Actual
—
Estimate
0.04
USD
Jan 1
ANGOAngioDynamics, Inc.
Actual
—
Estimate
−0.10
USD
Jan 1
LNNLindsay Corporation
Actual
—
Estimate
1.47
USD
Jan 1
LFCRLifecore Biomedical, Inc.
Actual
—
Estimate
−0.14
USD
Jan 1
PKEPark Aerospace Corp.
Actual
—
Estimate
—
Jan 2
TAYDTaylor Devices, Inc.
Actual
—
Estimate
0.53
USD
See more events
Community trends
Bitcoin - Channel no one talks about! (new Year's crash!)Bitcoin's price and development (code) are completely controlled by banks and government. They already have a roadmap on Bitcoin price, so they know what the price will be in 2030. Bitcoin technology is great for total control because all transactions are public. How to profit from that? First of al

Bitcoin: Leaning Towards BullishWe're sitting at equilibrium ($89,619) with a clean higher low formation intact above both EMAs. The structure favors continuation, but the 64.9% rejection wick at $90,599 created a supply zone we need to respect. Volume is 68% below average—this is consolidation, not distribution.
1. THE TECHNICA

BTCUSDT Long: Demand at 88K Could Fuel a Move to $92,700Hello traders! Here’s a clear technical breakdown of BTCUSDT based on the current chart structure. Bitcoin recently completed a prolonged move lower within a well-defined descending channel, confirming strong bearish pressure during that phase. This bearish structure remained intact until price reac

BTC/USD- H1 - Rejection at Supply (23.12.2025)📝 Description 🔍 Setup (Market Structure) WHITEBIT:BTCUSDT
Bitcoin faced multiple rejections from a strong resistance / supply zone, clearly marked by repeated wick rejections. After the latest rejection, price broke below the rising trendline, signaling trend weakness on the H1 timeframe.
Key

ETH at Key Support – Breakdown Could Trigger a Deeper Sell-OffETH at Key Support – Breakdown Could Trigger a Deeper Sell-Off
ETH is currently trading at a very critical technical zone after failing to sustain momentum above the rising channel resistance.
Price has already been rejected from the major supply zone and is now retesting the lower trendline supp

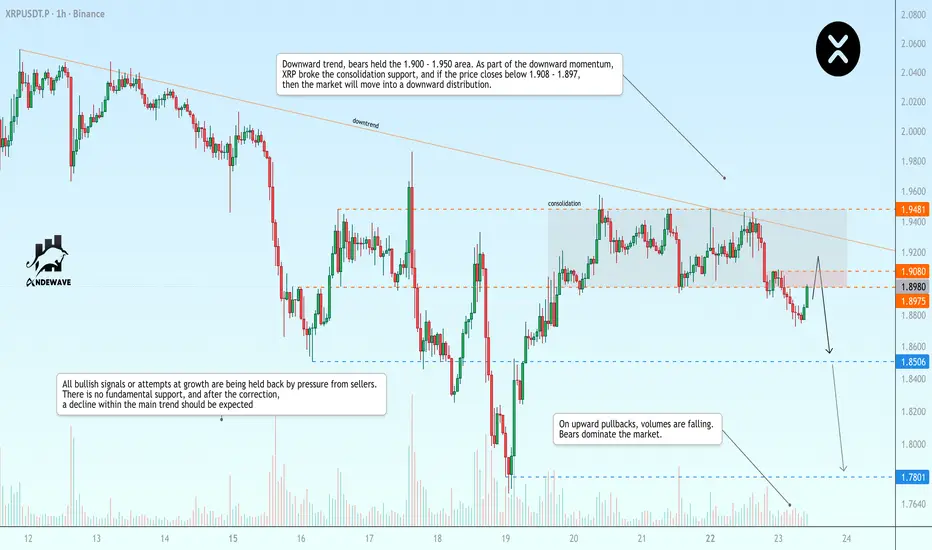
XRPUSDT may resume its decline after a pullback Downward trend, bears held the 1.900 - 1.950 area. As part of the downward momentum, XRP broke through the consolidation support, and if the price closes below 1.908 - 1.897, the market will move into a downward distribution.
On upward pullbacks, volumes are falling. Bears dominate the market. All
ETHUSDT: Bearish Drop to 2840?BINANCE:ETHUSDT is eyeing a bearish reversal on the 1-hour chart , with price testing a key resistance zone near cumulative sell liquidation, converging with a potential entry area that could trigger downside momentum if sellers defend against further upside. This setup suggests a pullback oppor

BTCUSDT Holds Support - Retest of 88,900 Resistance LikelyHello traders! Here’s my technical outlook on BTCUSDT (2H) based on the current chart structure. Bitcoin is trading within a broader recovery phase after a prolonged corrective move. Earlier, price formed a base and broke out of a consolidation range, signaling that selling pressure was weakening an

APTUSDT - Correction and liquidity capture before the fall BINANCE:APTUSDT.P is making a countertrend move towards the zone of interest 1.66 - 1.68. Global and local trends are downward, and bearish pressure may do its job...
Bitcoin is consolidating within a downward trend. A retest of resistance is forming; if bears keep the market under pressure ag

BTC/USDT | More Downside Ahead? Let's Discuss in the Comments!Bitcoin climbed back to $90,500, tapped resistance, and is now trading around $87,800. This bounce looks more like a classic liquidity grab than a trend reversal. I’m still leaning bearish. As long as $90,000 doesn’t flip into solid support, we’re likely heading lower. My next downside targets: $85,

See all crypto ideas
GOLD - We've updated ATH. What's next? A correction?FX:XAUUSD hit a new all-time high, approaching $4,425, for a bunch of reasons, one of which is increased interest in hedging against geopolitical risks...
Fundamental situation:
The US has increased sanctions pressure on Venezuela. Israel is considering options for attacking Iran's nuclear p

Price Is Rising Fast, but the Key Move Lies in the Pullback to 4Hello, I'm Domic.
Looking closely at the H4 chart, gold is currently in a very strong acceleration phase. A steep sequence of bullish candles has pushed price into the 4.48xx area, while both trendlines on the chart are clearly sloping upward. This confirms that the uptrend remains dominant, but i
GOLD 1H CHART ROUTE MAP UPDATE & TRADING PLAN FOR THE WEEKHey Everyone,
Please see our 1h chart levels and targets for the coming week.
We are seeing price play between two weighted levels with a gap above at 4360 and a gap below at 4327, as support. We will need to see ema5 cross and lock on either weighted level to determine the next range.
We will se

Lingrid | GOLD Short-Term Pullback Expected After ATHOANDA:XAUUSD perfectly played out my previous trading idea . Price has pushed into a fresh all-time high zone after a strong impulsive leg, but momentum is starting to stretch near the upper boundary of the rising channel. The latest higher high was formed directly into major psychological level.

XAUUSD: Rejection from 4,420 Resistance - Pullback Toward 4,350Hello everyone, here is my breakdown of the current XAUUSD setup.
Market Analysis
XAUUSD continues to trade within a broader bullish structure, but the current price action signals a short-term corrective phase. After forming a strong upward impulse, gold established a well-defined upward channel

Gold (XAUUSD) – 4H Continuation After Bullish ConsolidationHi!
Market Structure:
Gold remains in a strong ascending channel, maintaining higher highs and higher lows. After briefly breaking above the mid-channel resistance, price respected the broader bullish structure, confirming trend continuation rather than reversal.
Price Action & Patterns:
The m

All depends on new year candleXAUUSD (30M): Gold is holding bullish structure after a healthy pullback. Price is respecting major support and consolidating above 4470, suggesting potential continuation toward 4496 (ATH area) and further upside toward 4560 if momentum sustains.

Gold Enters PRZ After New ATH — Time to Watch for Shorts?Gold ( OANDA:XAUUSD ) started the new week by printing a New All-Time High(ATH).
At the moment, price is moving inside the Potential Reversal Zone(PRZ) and is also approaching the upper lines of the Small/Large ascending channel.
Technically, there is a strong probability that these upper channel

The Christmas Silver Finally Breaks FreeFor decades, Silver has celebrated the holidays the same way 🎄
Strong rallies.
Rising excitement.
And a familiar ceiling.
🎄 Christmas 1980
Silver climbed like a Christmas tree, fast, vertical, and emotional.
The star was reached at the $50 level.
And just like that, the lights went out ✨
The

Elise | XAUUSD | 30M – Bullish Continuation StructureOANDA:XAUUSD
Following the impulsive breakout from the flip zone, price is consolidating within the channel. This consolidation indicates controlled bullish continuation rather than exhaustion. A shallow pullback toward channel equilibrium is expected before continuation higher.
Key Scenarios
✅

See all futures ideas
EURUSD Fake Breakout Signals Pullback to 1.1700 SupportHello traders! Here’s my technical outlook on EURUSD (4H) based on the current chart structure. EURUSD is trading within a broader bullish recovery after completing a prolonged corrective phase. Earlier, price broke above a descending resistance line, which marked a clear shift in market structure a

EURUSD Pullback Toward 1.178 as Dollar Weakness Builds!Hey Traders,
In today’s trading session, we’re monitoring EURUSD for a potential buying opportunity around the 1.17800 zone.
From a technical standpoint, EURUSD remains in a well-defined uptrend and is currently undergoing a healthy correction, pulling back toward trend support and a key support/r

AUDCAD: Structural Shift After Prolonged Bearish TrendHi!
AUDCAD previously traded within a clear bearish structure, forming lower highs and lower lows inside a descending channel. Toward the latter stage of the move, selling pressure began to weaken as downside momentum slowed and price struggled to print new lows, signaling seller exhaustion and ea

NZDUSD H4 | Bullish Bounce Off PullbackMomentum: Bullish
Price has bounced off the buy entry, which is acting as a pullback support. This level aligns with the 38.2% Fibonacci retracement, adding significant confluence and strength to the zone.
Buy Entry: 0.5743
Overlap support
Slightly above the 38.2% Fibonacci retracement
Stop Loss:
EUR/USD | Retesting the supply zone (READ THE CAPTION)As you can see in the 4H chart of EURUSD, it reached the supply zone, and then with the news coming out, it started dropping in price. It went as low as 1.17744, just below the low of FVG. I believe EURUSD will go back to yet again challenge the supply zone and sweep the liquidity above there. We sh

EURUSD Short: Head & Shoulders at Resistance - Target 1.1670Hello, traders! EURUSD previously traded within a well-defined Descending Channel, confirming sustained bearish pressure and controlled sell-side momentum. Price consistently respected the channel boundaries, forming a sequence of lower highs and lower lows. Multiple breakout attempts occurred withi

23.12.25 Daily ForecastPairs on Watch -
FX:EURUSD
FX:EURNZD
FX:EURJPY
A short overview of the instruments I am looking at for today, multi-timeframe analysis down to what I will be looking at for an entry. Enjoy!

USDJPY: Sell the Rally, Chasing Is a Mistake?Hello traders,
For USDJPY, I am currently leaning more toward a short-term BEARISH scenario. The key reason comes from Japan’s side: officials have repeatedly signaled their dissatisfaction with one-sided FX moves and left the door open for possible action if the yen weakens excessively. This

AUDUSD SELL | Idea Trading AnalysisAUDUSD is moving on Resistance zone..
The chart is above the support level, which has already become a reversal point twice.
We expect a decline in the channel after testing the current level.
We expect a decline in the channel after testing the current level
Hello Traders, here is the full analysi

EURUSD Awaiting Confirmation Before Bearish ContinuationQuick Summary
EURUSD has rallied strongly in recent days leaving a clear liquidity void below price .. A break above 1.18039 is expected first After that a bearish structure is required to confirm that the upside move is complete and that price is ready to target lower levels
Full Analysis
After

See all forex ideas
| - | - | - | - | - | - | - | ||
| - | - | - | - | - | - | - | ||
| - | - | - | - | - | - | - | ||
| - | - | - | - | - | - | - | ||
| - | - | - | - | - | - | - | ||
| - | - | - | - | - | - | - | ||
| - | - | - | - | - | - | - | ||
| - | - | - | - | - | - | - |
Trade directly on Supercharts through our supported, fully-verified, and user-reviewed brokers.


